Figures & data
Table 1. Demographics and risk factors.
Table 2. Clinical input variables.
Figure 1. Simulated progression of HbA1c in the treatment (saxagliptin + metformin) and control (glimepiride + metformin) arms over the modeled time horizon. HbA1c = glycated hemoglobin.
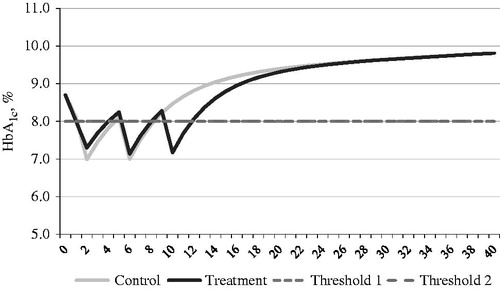
Figure 2. Simulated progression of weight in the treatment (saxagliptin + metformin) and control (glimepiride + metformin) arms over the modeled time horizon.
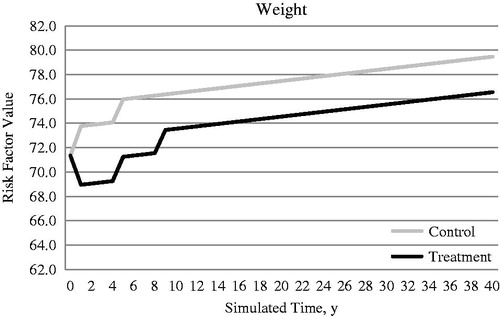
Table 3. Annual direct medical costs for diabetes-related complications and severe hypoglycemia (2014¥).
Table 4. Annual treatment costs for different drugs.
Table 5. BMI-related costs.*†.
Table 6. Utility decrements.
Table 7. Results for SAXA + MET vs GLI + MET.
Figure 3. Tornado diagram of the univariate sensitivity analysis. BMI, body mass index; HbA1c, glycated hemoglobin; HDL, high-density lipoprotein; ICER, incremental cost effectiveness ratio; SBP, systolic blood pressure.
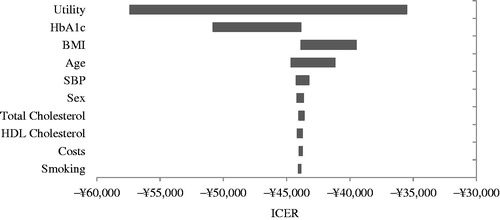
Table 8. Sensitivity analyses for SAXA + MET vs GLI + MET (results per patient).
Figure 4. Scatter plot of incremental cost-effectiveness ratios for saxagliptin + metformin vs glimepiride + metformin with a CE threshold value of ¥43,320 (GDP per capita in China in 2013). CE, cost effectiveness; GDP, gross domestic product.
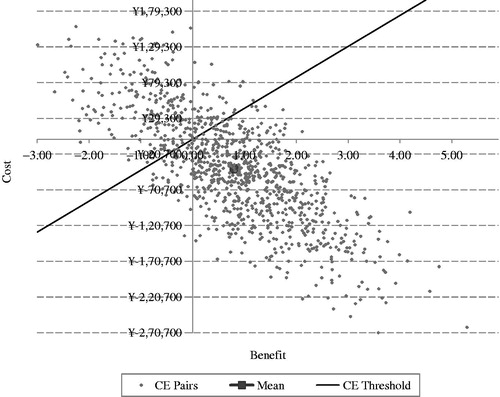
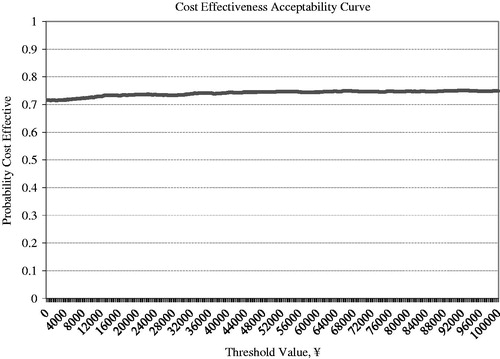
Figure 5. Cost-effectiveness acceptability curve for saxagliptin + metformin vs glimepiride + metformin.