
Figures & data
Figure 1. Patients screening and enrollment flow chart.
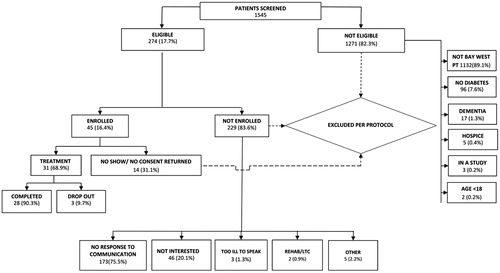
Table 1. Baseline characteristics.
Figure 2. Effect of propensity score weighting at reducing absolute standard difference among treatment groups.
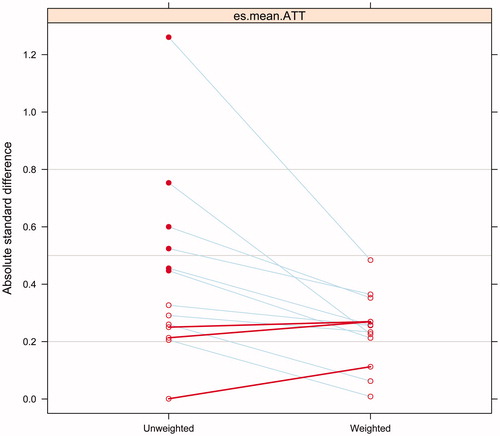
Figure 1. Patients screening and enrollment flow chart.
Figure 2. Effect of propensity score weighting at reducing absolute standard difference among treatment groups.
Please note: Selecting permissions does not provide access to the full text of the article, please see our help page How do I view content?
To request a reprint or corporate permissions for this article, please click on the relevant link below:
Please note: Selecting permissions does not provide access to the full text of the article, please see our help page How do I view content?
Obtain permissions instantly via Rightslink by clicking on the button below:
If you are unable to obtain permissions via Rightslink, please complete and submit this Permissions form. For more information, please visit our Permissions help page.