Figures & data
Figure 1. *Sample selection flow chart. Conditions include malignancy, human immunodeficiency virus, cachexia, anorexia, abnormal weight gain or loss, feeding difficulties, gastrointestinal disorders, inflammatory bowel diseases, pancreatitis, and nutritional deficiencies (except for vitamin deficiency). BMI, Body mass index; FPG, Fasting plasma glucose; HbA1c, Glycosylated hemoglobin; ICD-9-CM, International Classification of Diseases, Ninth Revision, Clinical Modification; GHP, Geisinger Health Plan; T2D, Type 2 diabetes.
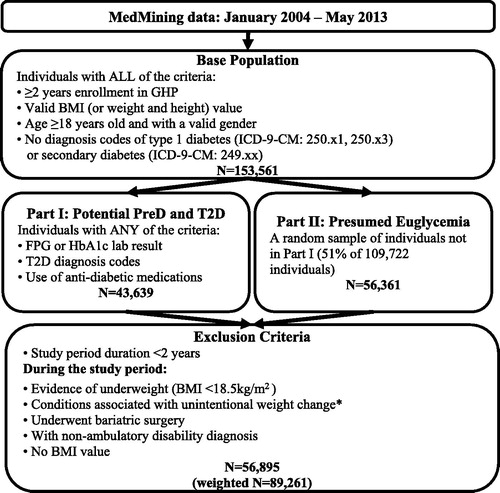
Table 1. Annual prevalence of obesity-related comorbidities.
Table 2. Individual characteristics.
Table 3. Estimated costs ratios and annual costs of obesity-related comorbidities.
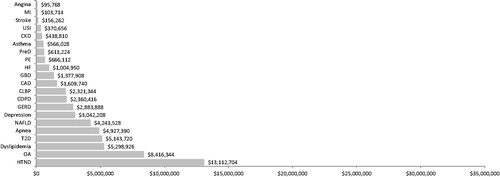
Figure 2. Population level annual incremental costs of obesity-related comorbidities vs without any comorbidity. Incremental costs were calculated by multiplying prevalence and incremental costs for each obesity-related comorbidity in a population of 100,000 individuals. The bars are sorted by the incremental costs of the comorbidities. Apnea, Sleep apnea; CAD, Coronary artery disease; CKD, Chronic kidney disease; CLBP, Chronic lower back pain; COPD, Chronic obstructive pulmonary disease; GBD, Gallbladder diseases; GERD, Gastroesophageal reflux disease; HF, Heart failure; HTND, Hypertensive diseases; MI, Myocardial infarction; NAFLD, Non-alcoholic fatty liver disease; OA, Osteoarthritis; PE, Pulmonary embolism; PreD, Pre-diabetes; Stroke, Ischemic stroke; T2D, Diabetes; USI, Urinary stress incontinence.
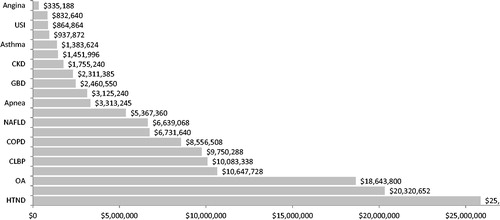
Figure 3. Differences in annual incremental costs of obesity-related comorbidities in obesity group vs non-obesity group. Incremental costs were calculated by multiplying incremental costs for each obesity-related comorbidity to the corresponding prevalence in a population of 100,000 individuals without obesity and in a population of 100,000 individuals with obesity, respectively. The differences between the obesity population vs non-obesity population were reported. Apnea, Sleep apnea; CAD, Coronary artery disease; CKD, Chronic kidney disease; CLBP, Chronic lower back pain; COPD, Chronic obstructive pulmonary disease; GBD, Gallbladder diseases; GERD, Gastroesophageal reflux disease; HF, Heart failure; HTND, Hypertensive diseases; MI, Myocardial infarction; NAFLD, Non-alcoholic fatty liver disease; OA, Osteoarthritis; PE, Pulmonary embolism; PreD, Pre-diabetes; Stroke, Ischemic stroke; T2D, Diabetes; USI, Urinary stress incontinence.