Figures & data
Table 1. Renal angiomyolipoma staging criteria.
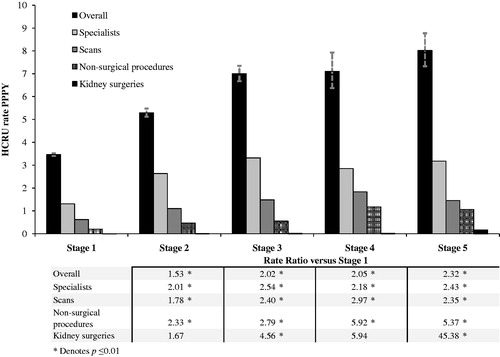
Figure 1. GFR by patient age. Age range depicted includes ages for which there are at least 10 patients in the current study. GFR from UMCU cohort of patients with TSC: Mean GFR among patients at a given age, estimated from serum creatinine using the CKD-EPI formula. The same patient may contribute multiple observations to a given age and to multiple ages. Shading depicts 95% confidence interval for the mean. GFR from normal population: Based on GFR estimated from serum creatinine for Caucasian males and females using the CKD-EPI formula, reported in a 2007 population-based cross-sectional study conducted in the eastern part of the NetherlandsCitation19,Citation20. Plot depicts weighted averages of median GFR reported for males and females. Weights equal to the proportion of each gender within a given age cohort of the current study.
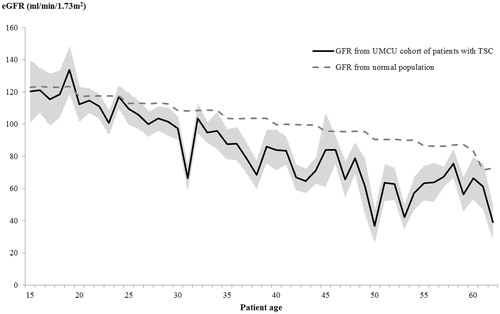
Table 2. Patient characteristics by CKD stage.a
Table 3. Patient characteristics by renal angiomyolipoma (AML) size.
Figure 2. HCRU rates by CKD stage. Overall consists of specialists, scans, non-surgical procedures, and kidney surgeries, as well as non-kidney surgeries, medication, and dialysis (not shown). Dashed lines depict 95% confidence interval of utilization rates.