Figures & data
Table 1. Demographics and clinical characteristics of clopidogrel/prasugrel pre-matched and matched-cohorts.
Table 2. Strength of evidence using Bayes factorsCitation21.
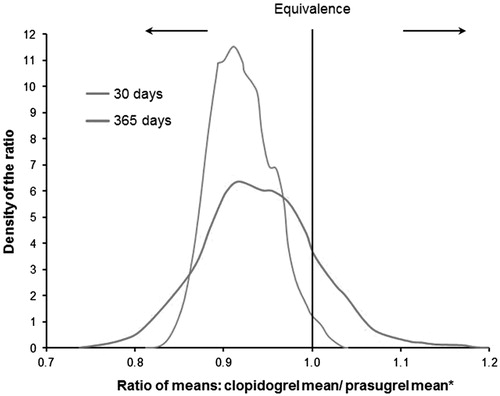
Figure 1. Illustration of the five key posterior probabilities. r, ratio of means; d, non-inferiority/equivalence margin. The posterior probabilities are the areas under the posterior density curve for the indicated intervals. This figure has been reproduced with permission from Olson et al.Citation26. © 2014 John Wiley & Sons Ltd.
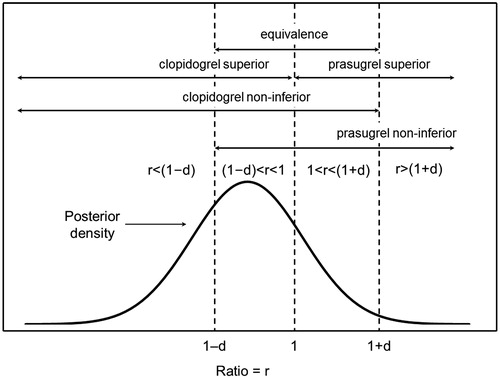
Table 3. Mean ACS-related healthcare cost and all-cause healthcare costs per patient for up to 30 and 365 days of follow-up for clopidogrel/prasugrel matched-cohort.
Figure 2. Posterior densities for ratio of means of ACS-related hospitalization costs at 30 days and 365 days. *A ratio of <1 indicates that the mean cost of clopidogrel is lower than the mean cost of prasugrel.