Figures & data
Table 1. Baseline characteristics of the simulated cohorts.
Table 2. Treatment effects applied in the first year of the analysis.
Table 3. Cost-effectiveness outcomes of the base case analyses.
Figure 1. Mean direct costs associated with liraglutide 1.2 mg and sitagliptin over patient lifetimes. EUR, 2013 Euros.
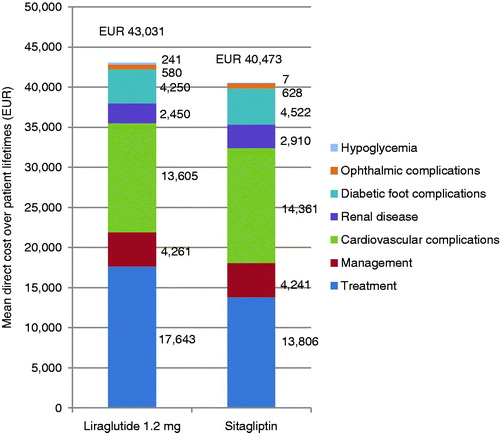
Table 4. Liraglutide vs sitagliptin: Results of the sensitivity analyses.
Figure 2. Liraglutide vs sitagliptin: Cost-effectiveness scatterplot for the probabilistic sensitivity analyses. EUR, 2013 Euros, QALY, quality-adjusted life year.
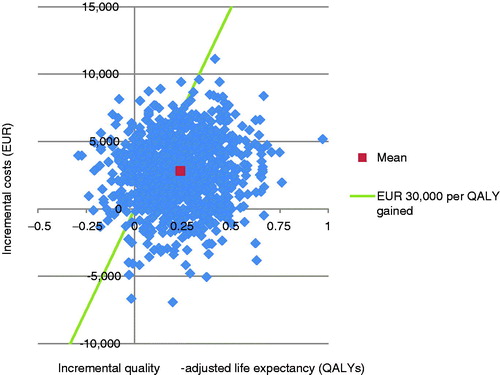
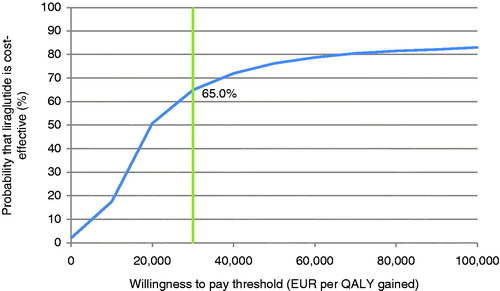
Figure 3. Liraglutide vs sitagliptin: Cost-effectiveness acceptability curve for the probabilistic sensitivity analysis. EUR, 2013 Euros; QALY, quality-adjusted life year.
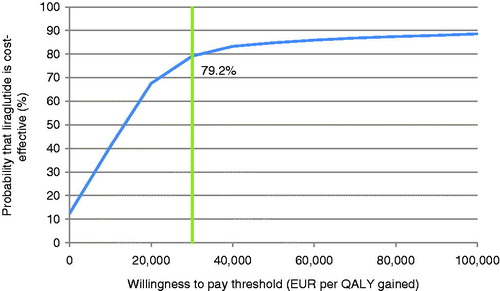
Figure 4. Mean direct costs associated with liraglutide 1.2 mg and glimepiride over patient lifetimes EUR, 2013 Euros; QALYs, quality-adjusted life years.
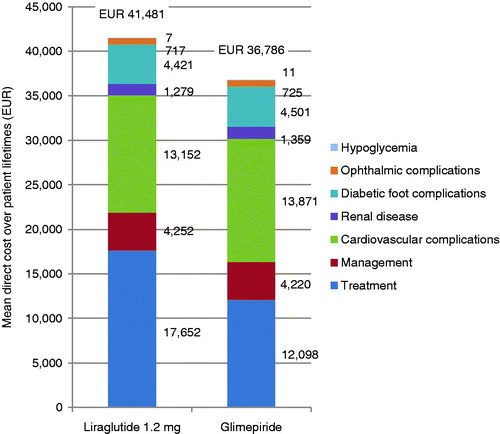
Table 5. Liraglutide vs glimepiride: Results of the sensitivity analyses.
Figure 5. Liraglutide vs glimepiride: Cost-effectiveness scatterplot for the probabilistic sensitivity analyses. EUR, 2013 Euros, QALY, quality-adjusted life year.
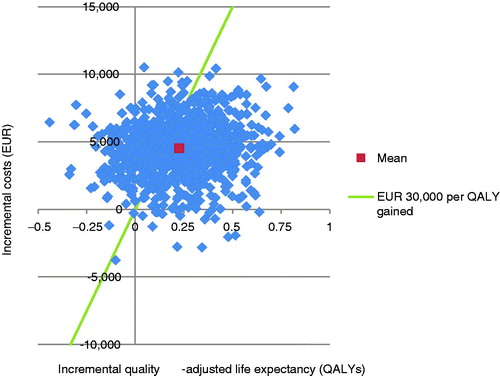
Figure 6. Liraglutide vs glimepiride: Cost-effectiveness acceptability curve for the probabilistic sensitivity analysis. EUR, 2013 Euros; QALY, quality-adjusted life year.