Figures & data
Table I. Treatment guidelines for patients with seasonal affective disorder. Adapted from ref 9: Lewy AJ. Treating chronobiologic sleep and mood disorders with bright light. Psychiatric Annals, 1987; 17:664-669. Copyright © Charles Slack 1987.
![Figure 4. Pretreatment SIGH-SAD depression score as a function of PAD (the interval between the DLMO and midsleep, as shown in Figure3). (The circled data point from a 36-year-old female SAD subject who was assigned to placebo treatment was the only one that met outlier criteria [z =3.02] and was therefore removed from all subsequent analyses and did not substantially affect any of the above findings [no outliers were detected in any other analyses].) The parabolic curve (minimum =5.88) indicates that PAD accounts for 17% of the variance in SIGH-SAD scores (F [2, 65] =6.43). A significant linear correlation was found for the absolute deviation from the parabolic minimum (r=0.39, R2 =0. 15, df =65, P =0.001), confirming the validity of the parabolic curve fit. SAD, seasonal affective disorder; PAD, phase angle difference. Adapted from ref 20: Lewy AJ, Lefler BJ, Emens JS, Bauer VK. The circadian basis of winter depression. Proc Natl Acad Sci U S A. 2006:103:74147419. Copyright © National Academy of Sciences 2006](/cms/asset/ca4fa954-e7c1-46da-ac46-ae847e6bb616/tdcn_a_12130674_f0004_oc.jpg)
![Figure 5. Post-treatment SIGH-SAD score as a function of PAD. The parabolic curve (minimum =6. 18) indicates that PAD accounts for 11% of the variance in SIGH-SAD scores [F (2, 65)=3.96] for all subjects and 19% for phase-delayed subjects [F (2,45)=5.19]. Absolute deviations from the parabolic minima (6. 18 and 5.85, respectively) were statistically significant (advanced and delayed subjects: r=0.29, R2 =0.09 df=65, P=0.02; delayed subjects: r=0.48, R2 =0.23, df=65, P=0.001). SAD, seasonal affective disorder; PAD, phase angle difference Adapted from ref 20: Lewy AJ, Lefler BJ, Emens JS, Bauer VK. The circadian basis of winter depression. Proc Natl Acad Sci USA. 2006: 103:7414-7419. Copyright © National Academy of Sciences 2006](/cms/asset/2188563e-4260-4619-b502-496ad78735a7/tdcn_a_12130674_f0005_oc.jpg)
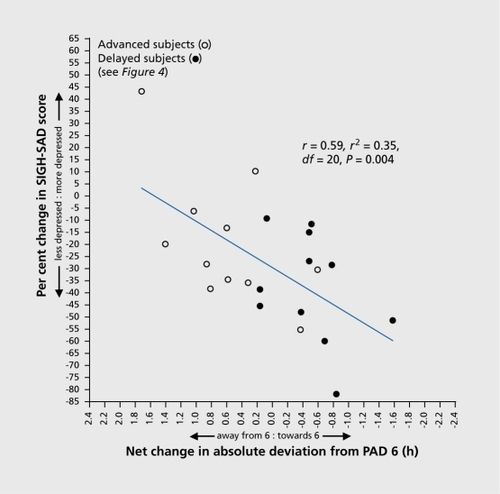
![Figure 6. Post-treatment SIGH-SAD score as a function of PAD in delayed subjects. (The parabolic curve and related statistics for the delayed subjects are provided in Figure 4). The linear correlation between PAD and SIGH-SAD score (diagonal hatched line) did not reach statistical significance, confirming that the parabolic curve in Figure 4 for delayed subjects (R2=0.19, P=0.009) is the better fit for these data. Directional linear correlations for underand overshifters (to the right and left of PAD 6, respectively) were both statistically significant. The parabolic curve for subjects receiving PM melatonin indicates that PAD accounts for 65% of the variance in SIGH-SAD scores (F [2, 8] =7.57; minimum =5.56); the correlation between the absolute deviation from the parabolic minimum was also statistically significant (r=0.75, R2=056, df=8, P=0.001 SAD, seasonal affective disorder; PAD, phase angle difference. Adapted from ref 20: Lewy AJ, Lefler BJ, Emens JS, Bauer VK. The circadian basis of winter depression. Proc Natl Acad Sci U S A. 2006:103:74147419. Copyright © National Academy of Sciences 2006](/cms/asset/fd0e90f3-f123-43d0-a9ed-4967c349217e/tdcn_a_12130674_f0006_oc.jpg)
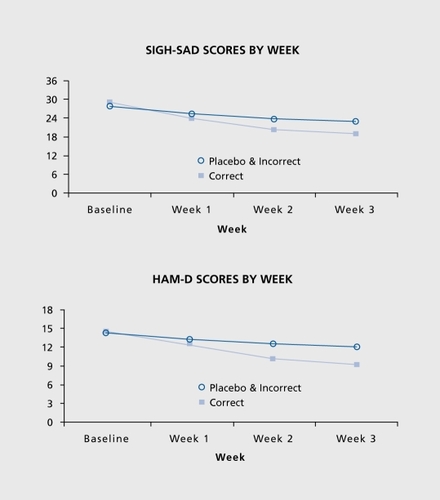
![Figure 8. Percent change in (SIGH-SAD) depression score after correct treatment incorrect treatment and placebo, as well as incorrect treatment and placebo combined (correct treatment such as giving PM melatonin to phase-delay SAD patients, etc; see text for details of the composition of these treatment groups). Baseline SIGH-SAD scores for the three treatment groups (correct treatment incorrect treatment and placebo) were 28.9+1.0, 28.8+1.3, and 26.6+1.4, respectively. The Kruskal-WallisHtest (χ2=5.83, df=2, P=0.05) was statistically significant, but not the one-way ANOVA (F =2.96 on [2, 65], P=0.06). By using the Welch two-sample f test to compare differences in the change scores of the correct-treatment group with those of the other groups, correct treatment significantly decreased depression ratings more than the other groups: incorrect (19.1%: t =2.09, df =40.8, P =0.04); placebo (20.9%: t=2. 60, df =34.2, P=0.01); the latter two groups combined (19.9%: t=2.65, df =32.1, P=0.01). Pretreatment to post-treatment percent changes were significant for all groups: correct (t =5.43, df = 16, P<0.001), incorrect (f =2.20, df =26, P=0.04), placebo (t=2.50, df =23, P=0.02), and the latter two groups combined (t =3.25, df =50, P =0.002). Effect sizes (ES) are shown for pretreatment to posttreatment percent change scores for each group; also shown are the more conservative ES for differences in change scores between the correct treatment group and the other groups. (Before phase typing, percent change in the pm treated group was -28.5 + 5.6, and percent change in the am treated group was -15.5 + 8.0, although there were no statistically significant differences between the three treatment groups in percent changes in SIGH-SAD scores [see above]). SAD, seasonal affective disorder Adapted from ref 20: Lewy AJ, Lefler BJ, Emens JS, Bauer VK. The circadian basis of winter depression. Proc Natl Acad Sci U S A. 2006:103:74147419. Copyright © National Academy of Sciences 2006.](/cms/asset/71e1b578-0b46-46c1-a4c4-f5e6cb17ba85/tdcn_a_12130674_f0008_oc.jpg)