850
Views
16
CrossRef citations to date
0
Altmetric
Supplement 1, 2013

Prevalence and sensitization of atopic allergy and coeliac disease in the Northern Sweden Population Health Study

, , , &
Article: 21403 | Published online: 05 Aug 2013

Figures & data

Fig. 1 Antibody measurement stratified according to age correlations with self-reported data. (A) Phadiatop, (B) F×5 and (C) IgG-tTG vs IgA-tTG. Dotted lines indicate clinical cut-off for elevated values. For A and B, these represent 0.35kU/L. The ages are (left to right) 14–34 (n=237), 35–54 (n=307), 55–74 (n=324), 74+ (n=128) and all ages (n=1,048). A red (blue) coloured box depicts significantly (Fisher's exact test, *p<0.05, **p<0.001) enriched (depleted) number of elevated individuals compared to the whole cohort. (D) The IgE measurements have been adjusted for age, sex and BMI. Red coloured *indicated significant correlations (p<0.01).

Fig. 1 Antibody measurement stratified according to age correlations with self-reported data. (A) Phadiatop, (B) F×5 and (C) IgG-tTG vs IgA-tTG. Dotted lines indicate clinical cut-off for elevated values. For A and B, these represent 0.35kU/L. The ages are (left to right) 14–34 (n=237), 35–54 (n=307), 55–74 (n=324), 74+ (n=128) and all ages (n=1,048). A red (blue) coloured box depicts significantly (Fisher's exact test, *p<0.05, **p<0.001) enriched (depleted) number of elevated individuals compared to the whole cohort. (D) The IgE measurements have been adjusted for age, sex and BMI. Red coloured *indicated significant correlations (p<0.01).

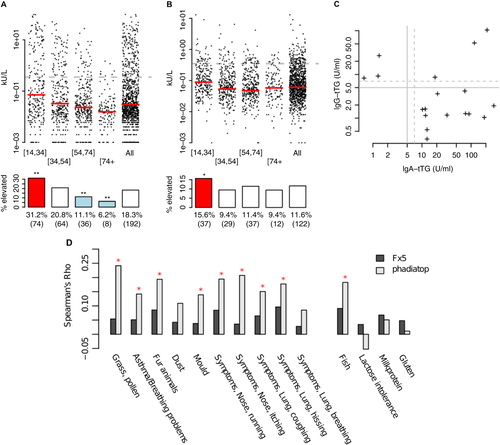
Table I Number of individuals with self-reported allergies