Figures & data
Figure 1. Facial preadipocytes are more responsive to rosiglitazone-containing differentiation compositions, relative to abdominal preadipocytes. Human facial and abdominal preadipocytes in control media (CD; insulin, dexamethasone, and IBMX), or CD plus 10 μM rosiglitazone (CDR). Lipid droplets are shown by Oil Red O staining. Microscopic images of the cells were taken on day 14 after plating. The pictures are representative of 3 individual experiments. DEX, dexamethasone; INS, insulin.
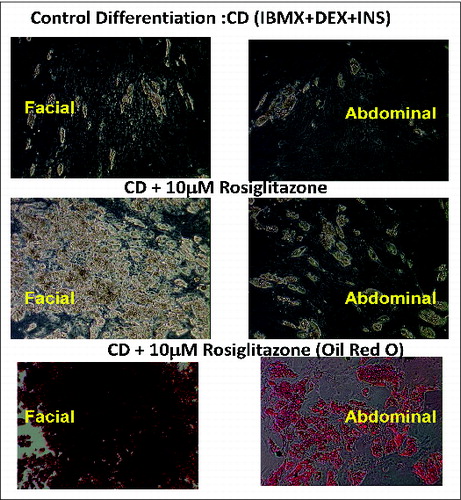
Figure 2. Facial preadipocytes retain their ability to differentiate through later subpassages than abdominal preadipocytes. Human facial and abdominal preadipocytes at the indicated subpassages were induced to differentiate by CDR. Images of the cells were taken on day 14 after plating. The pictures are representative of 3 individual experiments. CDR, control differentiation media + 10 μM rosiglitazone; P, passage number.
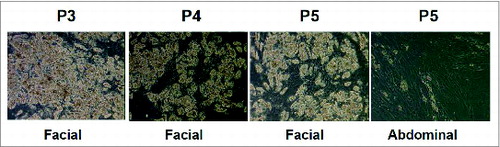
Figure 3. Morphology and gene expression of adipogenic markers in facial and abdominal preadipocytes. Facial and abdominal preadipocytes were grown for 14 d in the CD media or CDR media. (A) Images are representative of four individual experiments. (B) Gene expression was evaluated by qPCR and normalized by expression of the RPL13A gene. UD, undifferentiated (cultured in growth medium); CD, control differentiation; CDR, CD + 10 μM rosiglitazone; FABP4, fatty acid binding protein 4; FAS, fatty acid synthase; P, passage number; PPAR-γ, peroxisome proliferator-activated receptor gamma; qPCR, quantitative polymerase chain reaction.
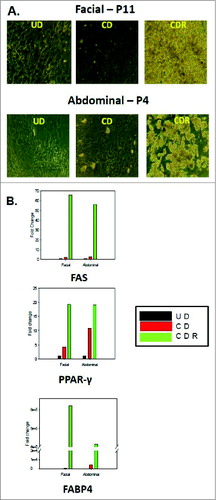
Figure 4. β-adrenergic receptor expression and responsiveness to isoproterenol in differentiated facial and abdominal preadipocytes. On day 14, cultures remained untreated (CDR) or were incubated with 10 μM isoproterenol (CDR+ IPTL) for up to one week. (A) Acute glycerol release after 5 hour isoproterenol treatment (2 μM). Data represented as mean ± SEM. Abdominal cells, n = 5 donors and facial cells, n = 7 donors. *Student t test P < 0.05. (B) Representative image of facial and abdominal adipocytes before and after 1 week of isoproterenol exposure. (C) After 1 week of isoproterenol treatment, the expression of lipid metabolic genes was evaluated by qPCR analysis and was normalized by expression of the RPL13A gene. Abdominal cells, n = 6 donors and facial cells, n = 4 donors. CD, control differentiation; CDR, CD + 10 μM rosiglitazone; ADRB2, β2-adrenergic receptor. Passages 2 until 6 were used for abdominal cells and passages 3 untill 11 were used for facial cells.
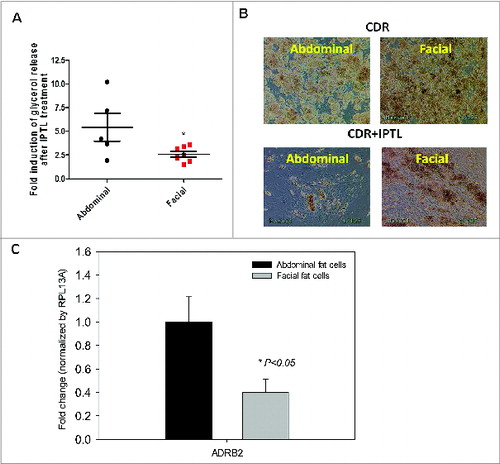
Figure 5. Expression of adipocyte markers in facial and abdominal subcutaneous fat tissues. mRNA was isolated immediately following tissue harvest from females 50–60 years of age. Gene expression was evaluated by qPCR analysis; expression of fat cell markers was normalized by expression of the RPL13A gene (mean ± SEM). (A) Gene expression pattern in freshly harvested adipose tissues(n = 4 donors per group). (B) β3-adrenergic receptor expression in facial (n = 5 donors) and abdominal (n = 10 donors) tissues. *P < 0.05 versus abdominal cells. BLD, below limit of detection; CPT2, carnitine palmitoyltransferase 2; FABP4, fatty acid binding protein 4; FAS, fatty acid synthase; GLUT4, glucose transporter 4; GPR81, G-protein coupled receptor 8; PPAR-α, peroxisome proliferator-activated receptor α; PPAR-γ, peroxisome proliferator-activated receptor gamma; TNF-α, tumor necrosis factor α.
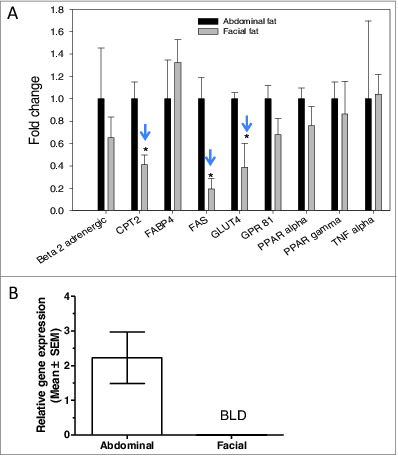
Table 1. Genes differentially regulated in facial adipocytes compared to abdominal adipocytes
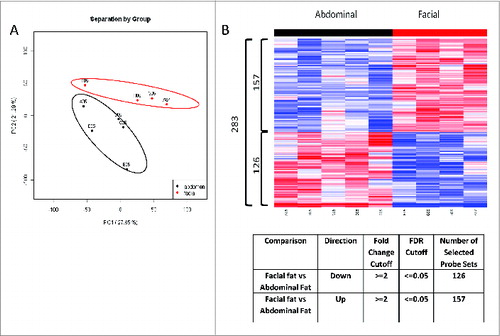
Figure 6. Depot specific gene expression profile in human facial vs abdominal adipocytes by Microarray analysis. (A) PCA analysis demonstrated a distinct gene expression pattern between 2 depots (Abdominal; n = 5, Facial; n = 4). (B) Heat-map illustration showing identified 283 probes differentially regulated between 2 depots. 126 probe sets were significantly down-regulated in facial fat as compared to abdominal fat. 157 probe sets were significantly up-regulated in facial fat cells as compared to abdominal fat cells.