Figures & data
Figure 1. Changes in brain (NAc), temporal muscle and skin temperatures induced by iv injection of cocaine (1 mg/kg) and 3-min tail-pinch in freely moving rats under quiet resting conditions. Top graphs (A) show relative changes in temperatures, middle graphs (B) show changes in NAc-Muscle and Skin-Muscle temperature differentials and bottom graphs (C) show changes in locomotor activity. Filled symbols mark values significantly different from baseline.
Figure 2. Relationships between basal brain (NAc) temperature and its changes induced by cocaine (1 mg/kg, iv) in freely moving rats (A). As can be seen, cocaine-induced NAc temperature increase (assessed as a peak value) was stronger when basal NAc temperatures were lower and weaker when basal temperatures were higher (r = −0.831; p < 0.001). Cocaine-induced locomotor activation was also dependent upon basal NAc temperature (r = −0.661; p < 0.01) but correlation was weaker in this case. Vertical line in (A) shows intersection of the regression line with the line of no effect, suggesting that the hyperthermic effect of cocaine disappears when basal NAc temperature is close to 38°C.
Figure 3. Changes in brain (NAc) and temporal muscle temperatures during cocaine self-administration behavior in trained rats. (A) shows mean (±SEM) values of absolute temperatures at each event of cocaine self-administration session. L+S, presentation of a light-sound cue. (B, C and D) show rapid time-course dynamics of NAc temperatures associated with critical events of self-administration behavior (initial self-administration of a session; “regular” self-injections, the last self-injection of a session). Close circles show data obtained from self-administering animals and open circles represent data obtained from yoked-control rats. For clarity, standard errors are not shown in these graphs. The word “regular” refer to multiple self-injections within a session and these mean data were obtained for all fifth, tenth, and fifteens injections. Original data of this study were reported in.Citation34,35
Figure 4. Changes in brain (NAcc) and temporal muscle temperatures induced by methamphetamine (9 mg/kg, sc) under quiet resting conditions at standard ambient temperatures (A), during social interaction with female (B, activated conditions) and at moderately warm ambient temperatures (29°C). (A, B) show mean (±SEM) changes in absolute temperatures and (C) shows individual temperature responses in all tested rats. As can be seen, 4 of 6 rats tested died during the experimental session and one more rat (No 1) died overnight.
Figure 5. Mean changes in brain (NAc), temporal muscle, and skin temperatures and locomotor responses induced by sc injections of methylone (9 mg/kg), MDPV (1 mg/kg), MDMA (9 mg/kg), and saline in freely moving rats under quiet resting conditions. Top graphs show mean (±SEM) values of absolute temperature changes; middle graphs show changes in NAc-Muscle and Skin-Muscle differentials; and bottom graphs show mean (±SEM) changes in locomotor activity. Filled symbols mark values significantly different from pre-injection baselines. Bold arrows mark the moment of injection. Original data shown in this graph were reported in Citation73,74
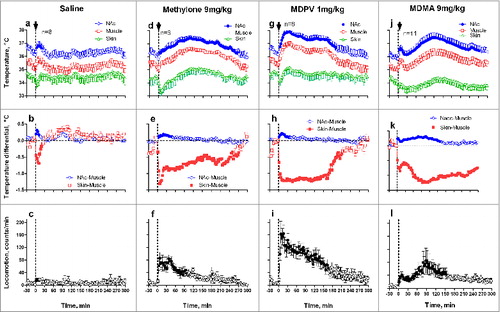
Figure 6. Mean changes in brain (NAc), temporal muscle, and skin temperatures and locomotor responses induced by sc injections of methylone (9 mg/kg), MDPV (1 mg/kg), MDMA (9 mg/kg), and saline during social interaction. Top graphs show mean (±SEM) values of absolute temperature changes; middle graphs show changes in NAc-Muscle and Skin-Muscle differentials; and bottom graphs show mean (±SEM) changes in locomotor activity. Filled symbols mark values significantly different from the pre-injection baseline. The first and third vertical hatched lines in each graph show onset and offset of social interaction (60 min) and black arrows at the second hatched lines mark the moment of drug administration. Original data shown in this graph were reported in. Citation73,74
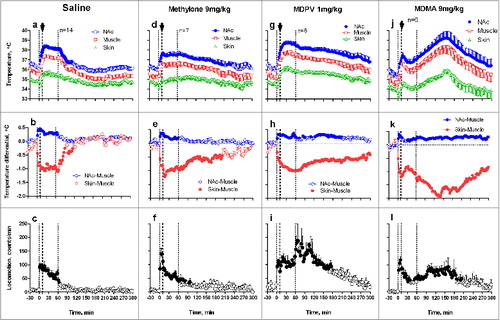
Figure 7. Mean changes in brain (NAc), temporal muscle, and skin temperatures and locomotor responses induced by sc injections of methylone (9 mg/kg), MDPV (1 mg/kg), MDMA (9 mg/kg), and saline in freely moving rats at warm ambient temperatures (29°C). Top graphs show mean (±SEM) values of absolute temperature changes; middle graphs show changes in NAc-Muscle and Skin-Muscle differentials; and bottom graphs show mean (±SEM) changes in locomotor activity. Filled symbols mark values significantly different from the pre-injection baseline. Black arrows at the hatched lines mark the moment of drug administration. Since all rats exposed to MDMA died within 6 hrs post-injection, MDMA data are shown as individual changes (j) and mean values of NAc-Muscle, Skin-Muscle differentials and locomotion (k and l) for the first 80 min post-injection when all rats were still alive. Original data shown in this graph were reported in. Citation73,74
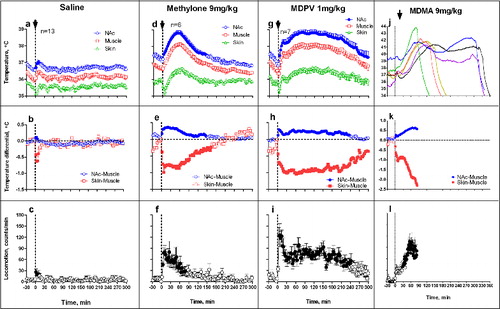
Figure 8. Mean values of brain (NAc) temperature increases (area under curve for 5-hrs post-injection) induced by sc injections of methylone (9 mg/kg), MDPV (1 mg/kg), MDMA (9 mg/kg), and saline in rats under quiet resting conditions, during social interaction, and at warm ambient temperatures. Top graphs (A) show mean (±SEM) temperature changes and bottom graphs (B) show “net” or “pure” drug effects (drug - saline). Horizontal hatched lines in (B) show values induced by each drug under quiet resting conditions.
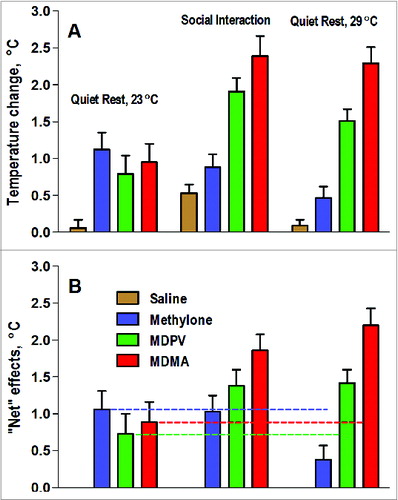
Figure 9. Photograph of the author.