1,098
Views
21
CrossRef citations to date
0
Altmetric
Research Paper

Time- and residue-specific differences in histone acetylation induced by VPA and SAHA in AML1/ETO-positive leukemia cells

, , , , , , & show all
Pages 210-219 | Received 03 Sep 2012, Accepted 08 Jan 2013, Published online: 15 Jan 2013

Figures & data

Figure 1. Effects of VPA or SAHA on total H4 or H3 acetylation. Kasumi-1 cells were incubated or not (time 0) in the presence of 2 mM VPA or 1 μM SAHA for the indicated times (hours). (A) Western Blotting was performed with the indicated antibodies. (B and C) Graphs represent (mean ± SEM of data from three independent experiments) total acetylation of H4 (B) or H3 (C) following treatment with VPA (diamond) or SAHA (square), as determined by densitometry of bands. Values were intra-experimentally normalized for H4 (B) or H3 (C) content and expressed as fold-increase with respect to the time 0 value. The statistical significance of differences within the same time point was determined by the Student’s t-test for paired samples (*p < 0.05).
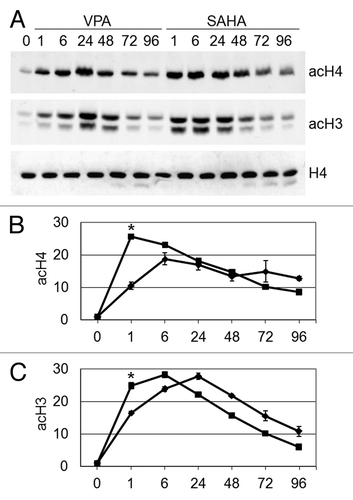
Figure 1. Effects of VPA or SAHA on total H4 or H3 acetylation. Kasumi-1 cells were incubated or not (time 0) in the presence of 2 mM VPA or 1 μM SAHA for the indicated times (hours). (A) Western Blotting was performed with the indicated antibodies. (B and C) Graphs represent (mean ± SEM of data from three independent experiments) total acetylation of H4 (B) or H3 (C) following treatment with VPA (diamond) or SAHA (square), as determined by densitometry of bands. Values were intra-experimentally normalized for H4 (B) or H3 (C) content and expressed as fold-increase with respect to the time 0 value. The statistical significance of differences within the same time point was determined by the Student’s t-test for paired samples (*p < 0.05).

Figure 2. Effects of VPA or SAHA on H4 acetylation at specific lysine residues. Kasumi-1 cells were incubated or not (time 0) in the presence of 2 mM VPA or 1 μM SAHA for the indicated times (hours). (A) Western Blotting was then performed with the indicated antibodies. (B–E) Graphs represent (mean ± SEM of data from three independent experiments) H4 acetylation following treatment with VPA (diamond) or SAHA (square) at K5 (B), K8 (C), K12 (D) or K16 (E), as determined by densitometry of bands. Values were intra-experimentally normalized for H4 content and expressed as fold-increase with respect to the time 0 value. The statistical significance of differences within the same time point was determined by the Student’s t-test for paired samples (*p < 0.05; **p < 0.01).
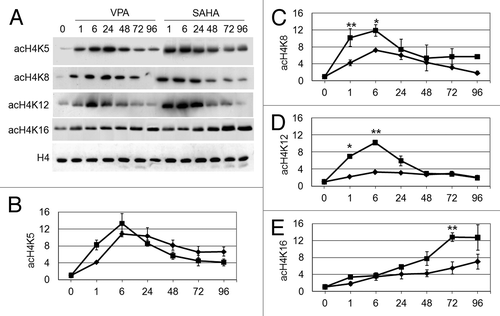
Figure 2. Effects of VPA or SAHA on H4 acetylation at specific lysine residues. Kasumi-1 cells were incubated or not (time 0) in the presence of 2 mM VPA or 1 μM SAHA for the indicated times (hours). (A) Western Blotting was then performed with the indicated antibodies. (B–E) Graphs represent (mean ± SEM of data from three independent experiments) H4 acetylation following treatment with VPA (diamond) or SAHA (square) at K5 (B), K8 (C), K12 (D) or K16 (E), as determined by densitometry of bands. Values were intra-experimentally normalized for H4 content and expressed as fold-increase with respect to the time 0 value. The statistical significance of differences within the same time point was determined by the Student’s t-test for paired samples (*p < 0.05; **p < 0.01).

Figure 6. Pro-apoptotic effects of VPA or SAHA on Kasumi-1 cells. (A) Kasumi-1 cells were incubated or not (time 0) in the presence of 2 mM VPA or 1 μM SAHA for the indicated times (hours). Cells were then lysed and western blotting performed with the indicated antibodies. Results are from one typical experiment out of three. (B) Cells were incubated without (NT) or with 2 mM VPA or 1 μM SAHA for the indicated times (days) and apoptosis was measured by the Annexin V test and flow cytometry. Values are means ± SEM of the percentages of apoptotic cells obtained from three independent experiments. The statistical significance of differences was determined by the Student’s t-test for paired samples (*p < 0.05; **p < 0.01). (C) Blasts from two t(8;21) AML patients (#1 and #2) were incubated or not (NT) in the presence of 2 mM VPA or 1 μM SAHA for the indicated times (hours). Cells were then lysed and western blotting performed with the indicated antibodies.
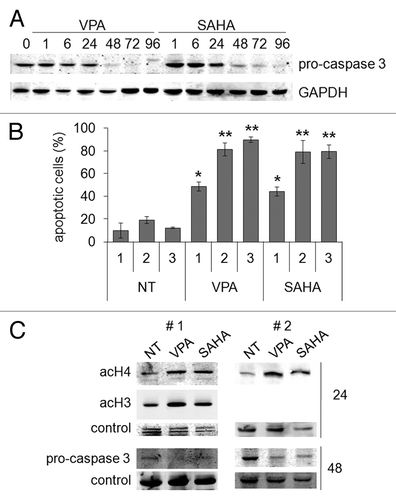
Figure 6. Pro-apoptotic effects of VPA or SAHA on Kasumi-1 cells. (A) Kasumi-1 cells were incubated or not (time 0) in the presence of 2 mM VPA or 1 μM SAHA for the indicated times (hours). Cells were then lysed and western blotting performed with the indicated antibodies. Results are from one typical experiment out of three. (B) Cells were incubated without (NT) or with 2 mM VPA or 1 μM SAHA for the indicated times (days) and apoptosis was measured by the Annexin V test and flow cytometry. Values are means ± SEM of the percentages of apoptotic cells obtained from three independent experiments. The statistical significance of differences was determined by the Student’s t-test for paired samples (*p < 0.05; **p < 0.01). (C) Blasts from two t(8;21) AML patients (#1 and #2) were incubated or not (NT) in the presence of 2 mM VPA or 1 μM SAHA for the indicated times (hours). Cells were then lysed and western blotting performed with the indicated antibodies.

Figure 3. Effects of VPA or SAHA on H3 acetylation at specific lysine residues. Kasumi-1 cells were incubated or not (time 0) in the presence of 2 mM VPA or 1 μM SAHA for the indicated times (hours). (A) Western Blotting was then performed with the indicated antibodies. (B and C) Graphs represent (mean ± SEM of data from three independent experiments) H3 acetylation following VPA (diamond) or SAHA (square) at K9 (B) or K27 (C), as determined by densitometry of bands. Values were intra-experimentally normalized for H3 content and expressed as fold-increase with respect to the time 0 value. Differences within the same time point were not statistically significant, as determined by the Student’s t-test for paired samples.
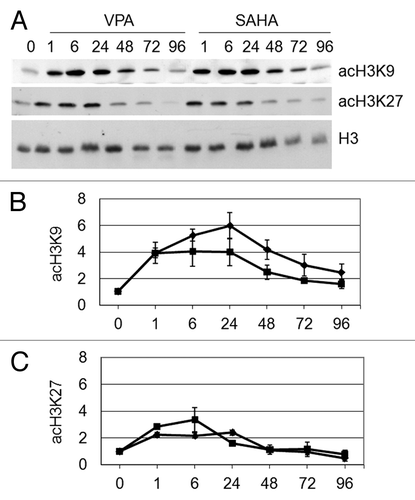
Figure 3. Effects of VPA or SAHA on H3 acetylation at specific lysine residues. Kasumi-1 cells were incubated or not (time 0) in the presence of 2 mM VPA or 1 μM SAHA for the indicated times (hours). (A) Western Blotting was then performed with the indicated antibodies. (B and C) Graphs represent (mean ± SEM of data from three independent experiments) H3 acetylation following VPA (diamond) or SAHA (square) at K9 (B) or K27 (C), as determined by densitometry of bands. Values were intra-experimentally normalized for H3 content and expressed as fold-increase with respect to the time 0 value. Differences within the same time point were not statistically significant, as determined by the Student’s t-test for paired samples.

Figure 4. Effects of VPA or SAHA on H4 epigenetic modifications at IL3 promoter. (A) Schematic representation of the IL3 promoter region analyzed. Grey boxes: AML1/ETO binding sites. (B-G) Kasumi-1 cells were incubated in the absence (NT) or the presence of 2 mM VPA or 1 μM SAHA for the indicated times (hours). ChIP was performed (IP: immunoprecipitates) using the indicated antibodies (rIgG: control rabbit IgG; no Ab: negative control). The IL3 promoter region was then amplified by RT-PCR (B) or Q-PCR (C–G). Histograms represent the relative quantification of DNA recovered from IP with antibodies against acH4 (C) or individual acK residues of H4, as indicated (D–G). Values were intra-experimentally normalized for input DNA and control IgG and data expressed as fold-increase with respect to the respective value obtained for untreated cells at 24 h of incubation (NT). Histograms are means ± SEM of data from three independent experiments. The statistical significance of differences was determined by the Student’s t-test for paired samples (*p < 0.05; **p < 0.01; ns: not significant).
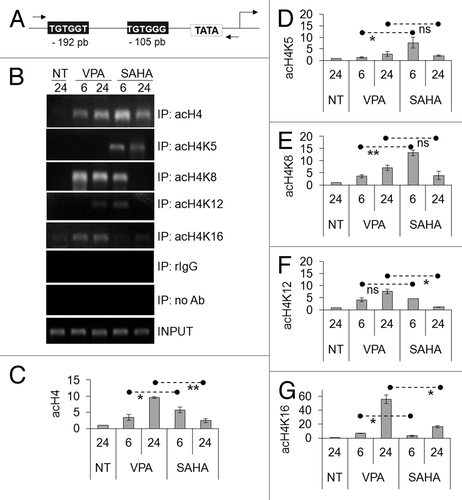
Figure 4. Effects of VPA or SAHA on H4 epigenetic modifications at IL3 promoter. (A) Schematic representation of the IL3 promoter region analyzed. Grey boxes: AML1/ETO binding sites. (B-G) Kasumi-1 cells were incubated in the absence (NT) or the presence of 2 mM VPA or 1 μM SAHA for the indicated times (hours). ChIP was performed (IP: immunoprecipitates) using the indicated antibodies (rIgG: control rabbit IgG; no Ab: negative control). The IL3 promoter region was then amplified by RT-PCR (B) or Q-PCR (C–G). Histograms represent the relative quantification of DNA recovered from IP with antibodies against acH4 (C) or individual acK residues of H4, as indicated (D–G). Values were intra-experimentally normalized for input DNA and control IgG and data expressed as fold-increase with respect to the respective value obtained for untreated cells at 24 h of incubation (NT). Histograms are means ± SEM of data from three independent experiments. The statistical significance of differences was determined by the Student’s t-test for paired samples (*p < 0.05; **p < 0.01; ns: not significant).
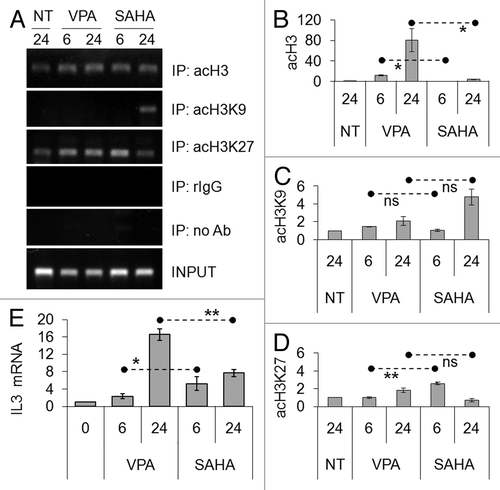
Figure 5. Effects of VPA or SAHA on H3 epigenetic modifications at IL3 promoter and on IL3 mRNA expression. (A–D) Kasumi-1 cells were incubated in the absence (NT) or the presence of 2 mM VPA or 1 μM SAHA for the indicated times (hours). ChIP was performed (IP: immunoprecipitates) using the indicated antibodies (rIgG: control rabbit IgG; no Ab: negative control). The IL3 promoter region was then amplified by RT-PCR (A) or Q-PCR (B–D). Histograms represent the relative quantification of DNA recovered from IP with antibodies against acH3 (B) or individual acK residues of H3, as indicated (C–D). Values were intra-experimentally normalized for input DNA and control IgG and data expressed as fold-increase with respect to the respective value obtained for untreated cells at 24 h of incubation (NT). (E) Cells were incubated in the absence (0) or the presence of 2 mM VPA or 1 μM SAHA for the indicated times (hours) and then lysed and total RNA was extracted. The relative expression of IL3 was calculated by Q-PCR using rRNA18S for normalization and the untreated sample as calibrator. (B–E) Values are means ± SEM of data from three independent experiments. The statistical significance of differences was determined by the Student’s t-test for paired samples (*p < 0.05; **p < 0.01; ns: not significant).

Figure 5. Effects of VPA or SAHA on H3 epigenetic modifications at IL3 promoter and on IL3 mRNA expression. (A–D) Kasumi-1 cells were incubated in the absence (NT) or the presence of 2 mM VPA or 1 μM SAHA for the indicated times (hours). ChIP was performed (IP: immunoprecipitates) using the indicated antibodies (rIgG: control rabbit IgG; no Ab: negative control). The IL3 promoter region was then amplified by RT-PCR (A) or Q-PCR (B–D). Histograms represent the relative quantification of DNA recovered from IP with antibodies against acH3 (B) or individual acK residues of H3, as indicated (C–D). Values were intra-experimentally normalized for input DNA and control IgG and data expressed as fold-increase with respect to the respective value obtained for untreated cells at 24 h of incubation (NT). (E) Cells were incubated in the absence (0) or the presence of 2 mM VPA or 1 μM SAHA for the indicated times (hours) and then lysed and total RNA was extracted. The relative expression of IL3 was calculated by Q-PCR using rRNA18S for normalization and the untreated sample as calibrator. (B–E) Values are means ± SEM of data from three independent experiments. The statistical significance of differences was determined by the Student’s t-test for paired samples (*p < 0.05; **p < 0.01; ns: not significant).

Figure 7. Effects of VPA or SAHA on maturation of Kasumi-1 cells. (A) Cells were incubated in the presence or the absence (NT) of 2 mM VPA or 1 μM SAHA for 2 (upper pictures) or 3 (lower pictures) days. Cytospin preparations were stained with May–Grünwald/Giemsa and examined using a 100x immersion lens. Histograms represent the percentages of blasts (gray) or differentiated (white) cells at the indicated times (days), determined as described in Materials and Methods. (B–F) Cells were treated as in A for 2 d. (B-E) Cell surface expression of markers was evaluated by flow cytometry using FITC- (CD11b and CD15) or PE- (CD14 and CD34) conjugated monoclonal antibodies. MFI was calculated with respect to that of cells treated with FITC- or PE-conjugated IgG. (F) The relative expression of CD11a was calculated by Q-PCR using rRNA18S for normalization and untreated sample as calibrator. (A–F) Values are means ± SEM of data from three independent experiments. The statistical significance of differences was determined by the Student’s t-test for paired samples (*p < 0.05; **p < 0.01). (G) Cells were incubated or not (time 0) in the presence of 2 mM VPA or 1 μM SAHA for the indicated times (hours). Cells were then lysed and western blotting performed with the indicated antibodies. Results are from one typical experiment out of three.
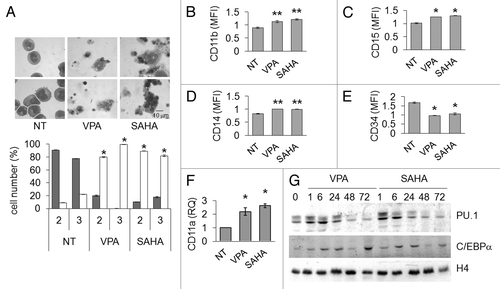
Figure 7. Effects of VPA or SAHA on maturation of Kasumi-1 cells. (A) Cells were incubated in the presence or the absence (NT) of 2 mM VPA or 1 μM SAHA for 2 (upper pictures) or 3 (lower pictures) days. Cytospin preparations were stained with May–Grünwald/Giemsa and examined using a 100x immersion lens. Histograms represent the percentages of blasts (gray) or differentiated (white) cells at the indicated times (days), determined as described in Materials and Methods. (B–F) Cells were treated as in A for 2 d. (B-E) Cell surface expression of markers was evaluated by flow cytometry using FITC- (CD11b and CD15) or PE- (CD14 and CD34) conjugated monoclonal antibodies. MFI was calculated with respect to that of cells treated with FITC- or PE-conjugated IgG. (F) The relative expression of CD11a was calculated by Q-PCR using rRNA18S for normalization and untreated sample as calibrator. (A–F) Values are means ± SEM of data from three independent experiments. The statistical significance of differences was determined by the Student’s t-test for paired samples (*p < 0.05; **p < 0.01). (G) Cells were incubated or not (time 0) in the presence of 2 mM VPA or 1 μM SAHA for the indicated times (hours). Cells were then lysed and western blotting performed with the indicated antibodies. Results are from one typical experiment out of three.

Figure 8. Effects of VPA or SAHA on apoptosis in AML cells not expressing AML1/ETO. THP-1 (A) or NB4 (B) cells were incubated or not (time 0) in the presence of 2 mM VPA or 1 μM SAHA for the indicated times (hours). Cells were then lysed and Western Blotting performed with the indicated antibodies. Results are from one typical experiment out of two. THP-1 (C) or NB4 (D) cells were incubated in the presence or the absence (NT) of 2 mM VPA or 1 μM SAHA for the indicated times (days). Apoptosis was then measured by the Annexin V test and flow cytometry. Values are means ± SEM of the percentages of apoptotic cells obtained from three independent experiments. The statistical significance of differences was determined by the Student’s t-test for paired samples (*p < 0.05). (E) Cells were incubated in the presence or the absence (NT) of 2 mM VPA or 1 μM SAHA for 3 d. Cytospin preparations were stained with May–Grünwald/Giemsa and the percentages of blasts (gray) or differentiated (white) cells determined as described in Materials and Methods. Differences, as determined by the Student’s t-test for paired samples, were not significant. (F) Cells were incubated or not (NT) in the presence of 2 mM VPA or 1 μM SAHA for 24 h and lysed. Western Blotting was then performed with the indicated antibodies. Results are from one typical experiment out of two.
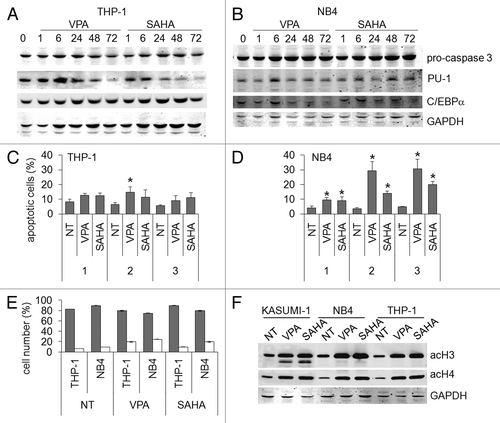
Figure 8. Effects of VPA or SAHA on apoptosis in AML cells not expressing AML1/ETO. THP-1 (A) or NB4 (B) cells were incubated or not (time 0) in the presence of 2 mM VPA or 1 μM SAHA for the indicated times (hours). Cells were then lysed and Western Blotting performed with the indicated antibodies. Results are from one typical experiment out of two. THP-1 (C) or NB4 (D) cells were incubated in the presence or the absence (NT) of 2 mM VPA or 1 μM SAHA for the indicated times (days). Apoptosis was then measured by the Annexin V test and flow cytometry. Values are means ± SEM of the percentages of apoptotic cells obtained from three independent experiments. The statistical significance of differences was determined by the Student’s t-test for paired samples (*p < 0.05). (E) Cells were incubated in the presence or the absence (NT) of 2 mM VPA or 1 μM SAHA for 3 d. Cytospin preparations were stained with May–Grünwald/Giemsa and the percentages of blasts (gray) or differentiated (white) cells determined as described in Materials and Methods. Differences, as determined by the Student’s t-test for paired samples, were not significant. (F) Cells were incubated or not (NT) in the presence of 2 mM VPA or 1 μM SAHA for 24 h and lysed. Western Blotting was then performed with the indicated antibodies. Results are from one typical experiment out of two.
Supplemental material

Additional material

Download Zip (1.1 MB)