Figures & data
Figure 1. Assessment of G6–31 activity against lung lesions when administrated intraperitoneally. (A) Experimental procedure; Four month-old K-rasLA1 mice received G6–31 or an isotype control, administrated by i.p injection or aerosol, once a week for 4 wk. At the time of death visible lesions were counted on the whole lungs. (B) Quantification of visible nodules per mouse (n = 15 mice per group; 2.5 mg/kg and 10 mg/kg; *P< 0.05 Mann-Whitney test). Results are expressed as the mean ± SEM of nodules. (C) Quantification of lung lesions on H&E stained sections from control and G6–31 treated group (n = 15 mice per group; 2.5 mg/kg and 10 mg/kg; P< 0.05 Mann-Whitney test). Results are expressed as the mean ± SEM of the number of lesions.
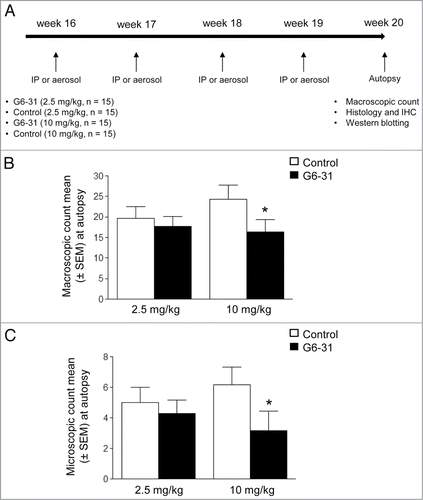
Figure 2. Assessment of aerosolized G6–31 activity against lung lesions. (A) Quantification of visible nodules per mouse (n = 15 mice per group; 2.5 mg/kg and 10 mg/kg; *P < 0.05 Mann-Whitney test). Results are expressed as the mean ± SEM of nodules. (B) Quantification of lung lesions on H&E stained sections from control and G6–31 treated group (n = 15 mice per group; 2.5 mg/kg and 10 mg/kg; P < 0.05 Mann-Whitney test). Results are expressed as the mean ± SEM of the number of lesions.
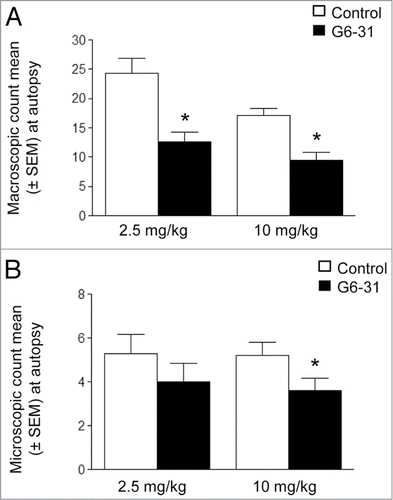
Figure 3. Effect of G6–31 at 10 mg/kg administered by i.p. injection or aerosol on K-rasLA1 lung tumors according to each lesion type and effect on microvascular density. (A) Quantification of AAH (atypical alveolar hyperplasia), Ad (adenoma) and ADC (adenocarcinoma), on H&E stained lung sections from control and G6–31-treated (10 mg/kg dose) mice (n = 30 mice per group; *P < 0.05 Mann-Whitney test). Results are expressed as the mean ± SEM of the number of each lesion type. (B) Representative image of vWFimmunostaining in the lung of K-ras LA1 mice. Bold arrow shows large vessel while standard arrow shows small vessel. (C) Quantification of the microvascular density, from vWFimmunostaining in control and G6–31-treated (10 mg/kg dose) mice (n = 30 mice per group; *P < 0.05 Mann-Whitney test). Results are expressed as the mean ± SEM.
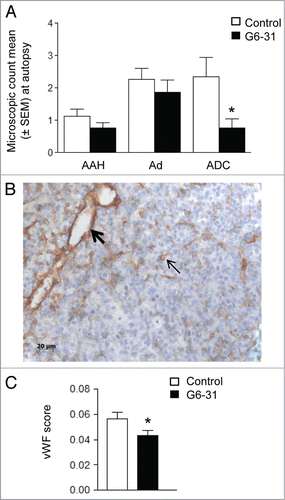
Table 1. Effect of G6–31 (10 mg/kg) on microvascular density in K-rasLA1 lung tumors, assessed from vWFimmunostaining. Quantification of the microvascular density (MVD) of small (< 10 μm) and large (> 10 μm) vascular structures (n = 30 mice per group; control and G6–31 10 mg/kg; *P< 0.05 Mann-Whitney test)
Table 2. Quantification of the level of PCNA (detected by western blotting) by densitometric analysis in mice treated with G6–31 by i.p. or aerosol (15 mice per group, 10 mg/kg) and in control mice (15 mice per group) (*P < 0.05 for both, Mann-Whitney test). Results are expressed as the mean ratio of PCNA normalized to β-actin and relative to the control group ± SEM
Figure 4. (A) Detection of PCNA by western blotting in whole lung protein extracts from control mice (mice 1–4) and G6–31-treated (10 mg/kg) mice (mice 5–9). Pulmonary delivery is on the right and i.p. delivery is on the left. (B) CC-3 immunostaining. Representative images of the control (left) and G6–31 (10 mg/kg dose) delivered either by i.p. (middle) or by pulmonary route (right). Brown cells are positive for CC-3 (arrows show some representative cells). The slices were counterstained with hematoxylin (× 400 magnification). Quantification of apoptosis in tumor lesions of the right lung of K-ras LA1 mice (n = 15 mice per group; *P < 0.05 Mann-Whitney test). Results are expressed as the mean staining scores of CC-3 positive cells relative to the control group ± SEM.
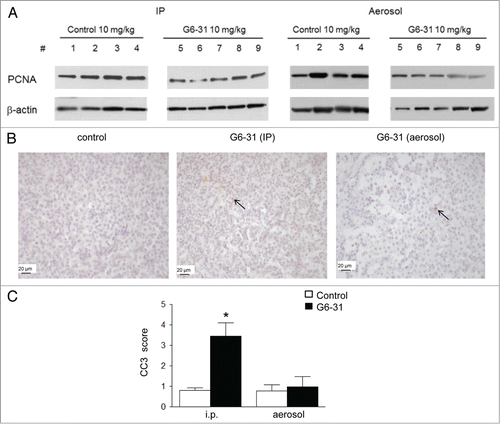
Table 3. Quantification of the level of phosphorylated VEGFR2 and total VEGF-2 by densitometric analysis in mice treated with G6–31 by i.p. injection or aerosol (15 mice per group, 10 mg/kg) and in control mice (15 mice per group) (*P< 0.05, Mann-Whitney test). Results are expressed as the mean ratio of phospho-VEGFR2 Y1175 to total VEGFR2 relative to that of the control group ± SEM. The same method of quantification was applied to Phospho-PI3K, β-actin, Phospho-AKT, total AKT, phosphor-ERK and total ERK. Results are expressed as the mean ratio of Phospho-PI3K to β-actin relative to that of the control group ± SEM, of Phospho-AKT to total AKT relative to that of the control group ± SEM and of Phospho-ERK to total ERK relative to that of the control group ± SEM
Figure 5. Blockade of VEGFR2 signaling pathway. Phospho-VEGFR2 Y1175, total VEGFR2, Phospho-PI3K, β-actin, Phospho-AKT, total AKT, Phospho-ERK and total ERK were analyzed by western blotting in whole lung protein extracts from control mice (mice 1–4) and from mice treated with G6–31 at 10 mg/kg (mice 5–9). Pulmonary delivery is on the right and i.p. delivery is on the left.
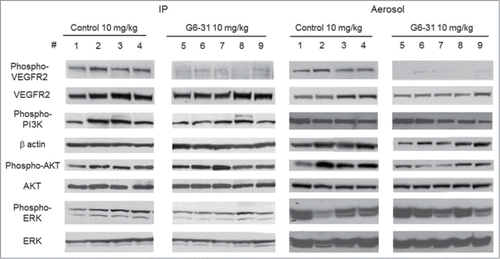
Table 4. Estimated values of compartmental pharmacokinetic parameters. Abbreviations: F, bio available fraction; ka, absorption rate; V1, central volume of distribution; k10 systemic elimination and k12, k21 distribution rates. Vmax maximum elimination rate; and kM, Michaelis constant
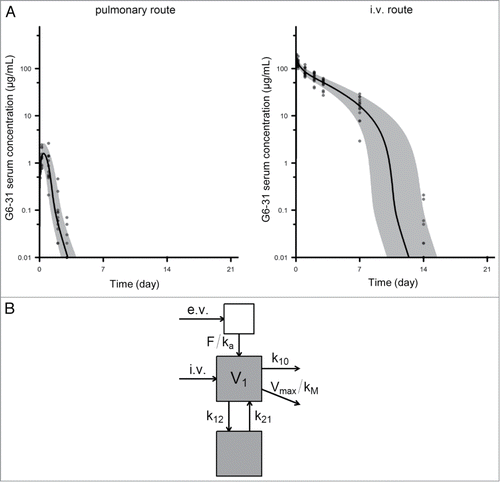
Figure 6. Pharmacokinetics of G6–31. (A) Serum concentration of G6–31 mAb was measured by ELISA in the serum collected at different time points from mice that received a single dose of the mAb (10 mg/kg) either by the pulmonary route (left, n = 13) or intravenously (right, n = 15). Gray area and solid line show the 5th-95th and 50th percentiles of the model-predicted time-concentration profiles, respectively. (B) Schematic representation of the pharmacokinetic compartmental model of G6–31.
