533
Views
5
CrossRef citations to date
0
Altmetric
Author's View

Immunotherapy

Is it different for sarcomas?

, &
Pages 255-257 | Published online: 01 Mar 2012

Figures & data

Figure 1. Osteosarcoma samples are infiltrated with CD14 and CD163 single and double positive macrophages. Spectral imaging was used to reduce autofluorescence of osteosarcoma cells. In the composite image, CD14-positive cells are represented in green, CD163-positive cells are represented in red, and CD14/CD163 double positive cells are represented in yellow. Background autofluorescence of tumor cells is represented in gray.
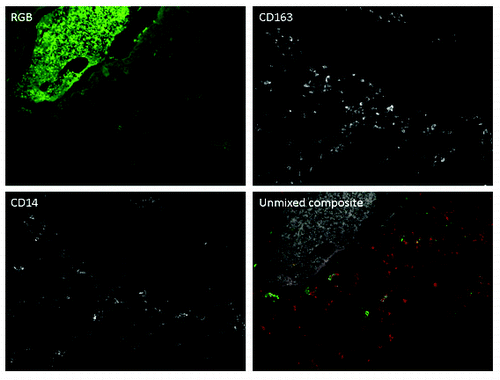
Figure 1. Osteosarcoma samples are infiltrated with CD14 and CD163 single and double positive macrophages. Spectral imaging was used to reduce autofluorescence of osteosarcoma cells. In the composite image, CD14-positive cells are represented in green, CD163-positive cells are represented in red, and CD14/CD163 double positive cells are represented in yellow. Background autofluorescence of tumor cells is represented in gray.