Figures & data
Figure 1. HTS identified miRNA inhibitors that affect cell viability or sensitivity to paclitaxel in NSCLC cells. Cells were transiently transfected with 50 nM miRNA inhibitors. After 48 h of incubation and 72 h treatment with paclitaxel or carrier, cell viability was measured by quantification of ATP produced using the Luminescent Cell Viability Assay (Promega). (A–C) The distributions of the cell viability measurements for individual inhibitors. (D–F) The distributions of paclitaxel responses for individual inhibitors, determined by the ratio of cell viability measurements in the presence and absence of paclitaxel.

Figure 2. HTS identified miRNA inhibitors that have general effects on lung cancer cell survival and response to paclitaxel. Shown are Venn diagrams of the miRNA inhibitors that affect cell survival and response to paclitaxel of the three lung cancer cell lines, using thresholds of 30% (A) and 20% (B) for the magnitude of their effects on cell survival and response to paclitaxel.
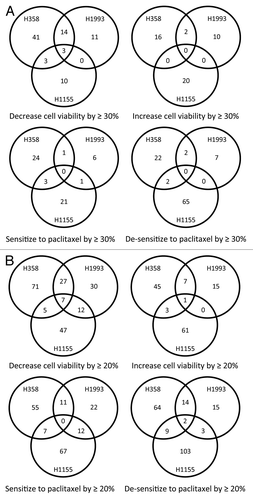
Figure 3. miR-133a/b, miR-361-3p, and miR-346 inhibitors show general inhibitory effects on cell viability in lung cancer cell lines. (A–F) Cell viability as a function of the concentration of the miRNA inhibitors. Cells were transfected with different concentrations of the indicated miRNA inhibitors or control oligos. After 120 h, cell viability was measured as described above. (G) Colony formation assay as a function of miRNA inhibitors in H1993 cells. Treatments were conducted in triplicate. (H) Quantification of the number of colonies for the colony formation assay. ** P < 0.01; *** P < 0.001.
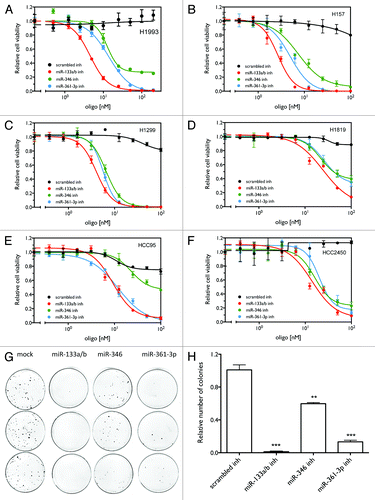
Figure 4. Combining the miRNA inhibitors with each other and with other anti-cancer agents enhances their effects on cell viability. (A) Effect of combining the miR-133ab and miR-361-3p inhibitors on cell viability in H1993 cells. (B–G) Effect of combining miR-133ab inhibitor (B–D) and miR-361-3p inhibitor (E–G) with paclitaxel, vinorelbine, and gemcitabine on cell viability in H1993 cells. The red lines indicate predicted thresholds for synergy under the assumption of Bliss independence.
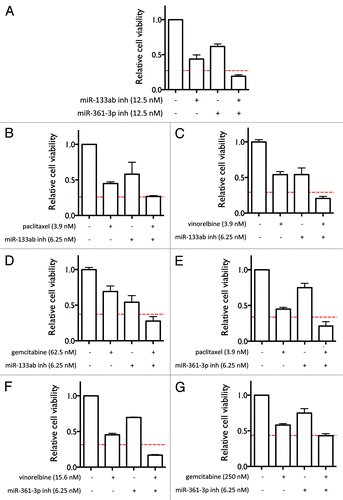
Figure 5. Effect of miR-133a/b, miR-346, and miR-361-3p inhibitors on caspase-3 activation in H1993 cells. (A) Time-dependent effect of the miRNA inhibitors on the induction of cell apoptosis. Cells were transfected with 10 nM of the indicated oligos. Cells undergoing apoptosis were stained using the CellPlayer Caspase-3/7 Reagent (Essen BioScience) and apoptotic events were counted using the IncuCyte live cell imaging system. The percentage of cells induced into apoptosis was calculated by normalizing to total cell numbers quantified by staining for total DNA content. (B) Cell confluence as a function of time was quantified using the IncuCyte live cell imaging system. (C) Representative images at the end point of the apoptotic assay. Apoptotic cells fluoresce green. (D) Western blot analysis of Caspase-3 activation. Cells were transfected with 50 nM of the indicated oligos and incubated for 72 h, after which cell lysates were harvested. Caspase-3 was detected using the specified antibodies, with calnexin levels measured as a loading control. Band intensities were quantified using ImageJ.
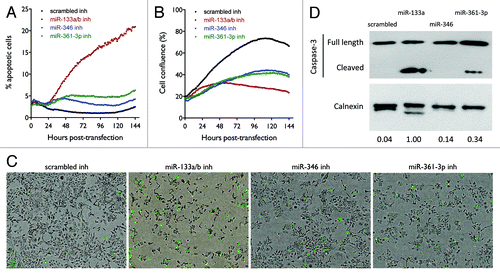
Figure 6. Effect of miR-133a/b, miR-346, and miR-361-3p inhibitors on cell cycle distribution. Cells were transfected with 50 nM of the indicated oligos. After 48 h, cells were collected and stained with PI for cell cycle analysis. (A–D) Flow cytometry images show the distribution of cell numbers at each cell cycle stage under each treatment condition. (E) The fraction of cells in G1, S, and G2 phases was quantified using the Watson pragmatic model. Similar results were obtained from two independent experiments. (F) Effect of miR-133a/b, miR-346, and miR-361-3p inhibitors on DNA synthesis as measured by BrdU incorporation. Shown are representative results from three replicate experiments. (G) Effect of miR-133a/b and miR-361-3p inhibitors on cell cycle progression in G1 phase-synchronized cells. (H) Effect of miR-133a/b, miR-346, and miR-361-3p inhibitors on total and phosphorylated Chk1 and Chk2 protein levels in H1993 cells.
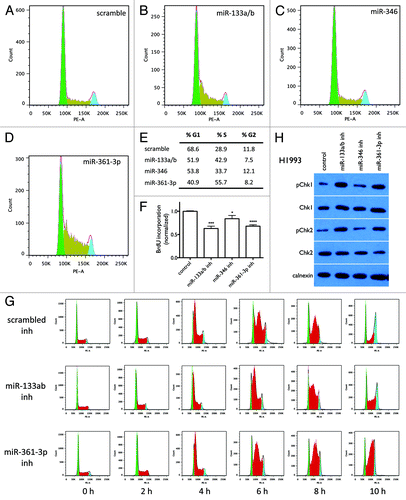
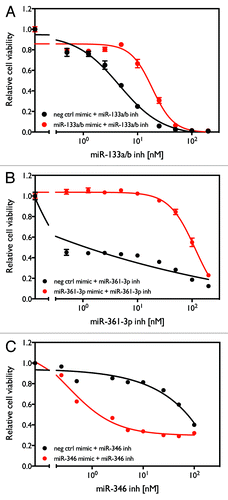
Figure 7. Rescue of cytotoxicity induced by miR-133a/b, miR-361-3p, and miR-346 inhibitors with miRNA mimics. H1993 cells were transfected with combinations of either the indicated miRNA mimic or negative control oligo with different concentrations of the indicated miRNA inhibitor. After 96 h, cell viability was measure as described above.