
Abstract
Objective
A prospective cohort study on changes of health complaints after removal of amalgam restorations was carried out at the request of the Norwegian Directorate of Health. The aim was to provide and evaluate experimental treatment to patients with health complaints attributed to dental amalgam fillings.
Methods
Patients (n = 32) with medically unexplained physical symptoms (MUPS), which were attributed to dental amalgam restorations had all their amalgam restorations removed and replaced with other dental restorative materials. Samples of blood were collected before and 1 year after removal of the fillings, and concentration of inorganic mercury (I-Hg), methylmercury (MeHg), silver (Ag) and selenium (Se) in serum was determined by inductively coupled plasma–sector field mass spectrometry. The comparison groups (one with MUPS but without attribution to amalgam [n = 28] and one group of healthy individuals [n = 19]) received no treatment. The participants responded to questionnaires at baseline and at follow-up after 1 and 5 years.
Results
Concentration of I-Hg and Ag in serum decreased significantly after removal of all amalgam restorations. Concentration of MeHg and Se in serum were not changed. Intensity of health complaints was significantly reduced after amalgam removal, but there were no statistically significant correlations between exposure indicators and health complaints.
Conclusions
Removal of all amalgam restorations is followed by a decrease of concentration of I-Hg and Ag in serum. The results support the hypothesis that exposure to amalgam fillings causes an increase of the daily dose of both I-Hg and Ag. Even though intensity of health complaints decreased after removal of all amalgam restorations there was no clear evidence of a direct relationship between exposure and health complaints. Trial registration: The project is registered at Clinicaltrials.gov (NCT01682278).
Introduction
Dental amalgam is a mixture of liquid elemental mercury (Hg0) and an alloy consisting of silver, tin and copper. Sometimes small amounts of other elements are included as well [Citation1]. Since mercury is a highly toxic element there are concerns regarding the risk for adverse effects from the exposure to mercury released from dental amalgam [Citation1–4].
The main sources of mercury in the population are seafood, which contains methylmercury (MeHg), and dental amalgam restorations, which releases inorganic mercury (I-Hg) and elemental mercury (Hg0) [Citation5]. All these forms of mercury are absorbed to various degrees by the body and distributed systemically. About 80% of inhaled elemental mercury vapour is absorbed by the lungs, distributed to body organs and rapidly oxidized to I-Hg. Concentration of total mercury in blood is strongly influenced by the intake of seafood [Citation5]. Thus, monitoring of exposure to I-Hg and Hg0 using samples of blood requires speciation analyses, which allows to differentiate between MeHg and I-Hg [Citation6,Citation7]. The biological half-life of I-Hg in plasma after exposure to Hg0 is short [Citation8,Citation9], and thus, the concentration of I-Hg in plasma (and serum) reflects mainly recent exposure (the last days).
Silver (Ag) is another constituent of dental amalgam, which has toxic effects on aquatic organisms at very low concentrations [Citation10,Citation11]. For some marine species Ag is assumed to be more toxic than mercury [Citation12]; thus, Ag should also be considered when potential side effects from dental amalgam are investigated. In humans, very high exposure to Ag may cause argyria, which appears as grey discolouration of the skin [Citation13]. Animal experiments have shown that Ag nanoparticles may cause immunotoxicity [Citation14], but the potential for adverse reactions due to Ag released from dental amalgam is largely unknown.
Selenium (Se) is an essential trace element with importance for antioxidant status and the immune system [Citation15]. Low plasma Se levels indicate suboptimal Se status, while elevated levels of Se in serum may be found in individuals taking dietary supplements including Se. There are indications that Se deficiency is related to muscle pain [Citation16], cardiomyopathy [Citation17], impaired immune response, cardiovascular disease, cancer, disorders of the nervous system and neurodegenerative diseases [Citation18]. Se interacts in the body with both mercury and Ag, which can form complexes with selenide and be stored in the body [Citation17]. Furthermore, toxic effects of both mercury and Ag can be reduced by Se [Citation17].
The primary aim of this article was to describe concentrations of biomarkers of exposure to dental amalgam (i.e. concentration of I-Hg and Ag in serum) and Se status (as reflected by concentration of Se in serum) before and after removal of all amalgam fillings in a group of patients with medically unexplained physical symptoms (MUPS) [Citation19,Citation20] attributed to dental amalgam fillings. In addition, correlations between the exposure indicator (number of amalgam surfaces) and biomarkers in serum (I-Hg and Ag) were explored as well as associations between change scores of general health complaints (GHC) index and the exposure indicator and biomarkers in serum.
Data were obtained from an experimental treatment project on changes of health complaints after removal of amalgam restorations. The project was designed as a prospective cohort study [Citation21]. The primary outcome of the project was changes of intensity of GHC index [Citation22] 1 year after amalgam removal and replacement with other dental restorative materials. The analysis of the primary outcome showed a significant reduction of the intensity of the GHC index following amalgam removal [Citation21]. In addition, there was a significant improvement of health-related quality of life measured by SF-36 [Citation21] and EQ-5D-5L [Citation23].
In the present article, concentrations of mercury in serum (a predefined secondary outcome) and other relevant trace elements in serum collected before and 1 year after completed removal of all amalgam restorations are presented. We expected the concentration of both I-Hg and Ag in serum to be reduced after amalgam removal. We did not expect the concentration of MeHg to change, since the number of amalgam surfaces is not significantly associated with MeHg in blood [Citation7,Citation24]. Neither was any change of the concentration of Se in serum expected following removal of amalgam restorations. Thus, the following main hypotheses were tested: Concentration of mercury, silver and selenium in serum is not changed after removal of all amalgam restorations (H0). The alternative hypotheses (H1) were that there were changes—in any direction—from baseline to follow-up. In addition, the correlation between number of amalgam surfaces and concentration of I-Hg in serum and concentration of Ag in serum was tested. The null hypothesis (H0) was that there was no association, while the alternative hypothesis was that there was an association in any direction. Associations between intensity of health complaints and concentration of I-Hg and Ag in serum were also tested for statistical significance (H0: No association, H1 association in any direction).
Subjects and methods
The participants in this analysis took part in a prospective cohort study on changes of health complaints after removal of amalgam restorations [Citation21]. The main target group was patients with MUPS attributed to dental amalgam fillings (Amalgam cohort). Patients in the Amalgam cohort had to send an application to the study office to participate in the project. All participants in the Amalgam cohort were examined by a physician (mainly the patient’s general practitioner; GP) and a dentist according to official guidelines before inclusion in the project [Citation25]. The study had two comparison groups: Patients with MUPS without attribution to dental amalgam fillings (MUPS cohort) and healthy individuals without chronic diseases or permanent medication (Healthy cohort). A detailed description of the recruitment procedures, examination and dental treatment is given elsewhere [Citation21].
Inclusion and exclusion criteria
Inclusion criteria for all groups were (i) age between 20 and 70 years, (ii) permanent residency in Norway and (iii) ability to comply with the protocol.
Additional inclusion criteria for the Amalgam cohort were (i) health complaints ≥3 months duration attributed by the patient to dental amalgam restorations, (ii) patient’s GP and dentist assessed that the general and dental health of the patient most likely would not deteriorate due to participation in the project and (iii) patient’s dentist assessed that there were no major risks for complications following amalgam removal (e.g. need for endodontic treatment or extractions).
In addition, subjective symptoms without corresponding objective findings after medical examination(s), including symptoms not explained by patient’s diagnoses and moderate or severe functional impairment (physician-assessed) were inclusion criteria for both the Amalgam cohort and the MUPS cohort. Diagnosed diseases should be adequately treated in both groups. Patients in the MUPS cohort should have at least 3 months duration of unspecific health complaints.
Exclusion criteria for all groups were pregnancy, planned pregnancy and lactation. For the Amalgam cohort and the MUPS cohort life-threatening disease, patients with ongoing cancers, severe cardiopulmonary, neurological or psychiatric diseases (assessed by the GP) and organic cause of all complaints were exclusion criteria [Citation21].
Clinical procedures
Amalgam cohort
After initial examinations by the patient’s GP and dentist and approval of the application to participate in the study, patients in the Amalgam cohort were sent the baseline questionnaire (Q1). After returning the baseline questionnaire to the study office, patients were assessed by their GP for fulfilment of inclusion and exclusion criteria, and a blood sample was collected.
The dental treatment (removal of all visible amalgam restorations and replacement with other dental restorative materials) was carried out by the patient’s ordinary dentist. The dentists were instructed to complete a short questionnaire after each treatment session regarding the use of rubber dam, water-cooling, high-volume evacuation and other protective measures during the amalgam removal. In addition, patient’s intake of dietary supplements and other preparations in conjunction with the treatment sessions was noted.
The patients completed another questionnaire about intake of dietary supplements and other preparations in conjunction with the actual treatment session and the experiences in conjunction with the treatment session (e.g. aggravation of symptoms within 1 week after the treatment session). In addition, the patients were instructed to contact their dentist in case of experiencing adverse reactions in conjunction with the treatment sessions.
One year after completed removal of all amalgam restorations, the follow-up questionnaire (Q2) was mailed to the patients. After returning the follow-up questionnaire patients were again assessed by their GP and had a blood sample collected.
MUPS cohort and healthy cohort
After recruitment and obtaining written informed consent, the participants were sent the baseline questionnaire (Q1). After returning the baseline questionnaire to the study office, patients in the MUPS cohort were assessed by their GP for fulfilment of inclusion and exclusion criteria. Both the MUPS cohort and the Healthy cohort had a blood sample collected at the GP’s office. Two years later, the first follow-up questionnaire (Q2) was mailed to the participants in the MUPS cohort and the Healthy cohort. After returning the follow-up questionnaire, a new blood sample was collected at the GP’s office.
Second follow-up (Q3)
Four years after completion of the first follow-up questionnaire (Q2), a second follow-up questionnaire (Q3) was mailed to the participants in all three cohorts.
Sample collection
Blood samples were collected using serum tubes (BD Vacutainer SST II Plus Advance), which were sent to the participant together with instructions for sample collection aimed at the laboratory personnel at the GP’s office. After venipuncture, the samples had to clot for 30 min and then centrifuged for 10 min at 1300 × g. Without being opened at the GP’s office, samples were sent to the laboratory at Haukeland University Hospital in Bergen for transfer to sterile polypropylene cryo-tubes (Cryo.s™ Freezing Tubes, item no: 124263, Greiner Bio-One) and stored at −20 °C in a temporary biobank. Within a week, samples were stored at −80 °C in the biobank at the Dental Biomaterials Adverse Reaction Unit in Bergen.
Determination of trace elements
Concentration of trace elements in serum (mercury, silver and selenium) was determined by inductively coupled plasma–sector field mass spectrometry (ICP-MS) at the laboratory of ALS Scandinavia AB (Luleå, Sweden) [Citation26,Citation27]. MeHg in serum was determined using a combination of extraction and isotope-dilution GC-ICP-MS [Citation28]. Detection limits (limit of reporting) were 0.2 µg Hg/L for total mercury, 0.03 µg Hg/L for MeHg, 0.05 µg Ag/L for Ag, and 5 µg Se/L for Se. Samples with concentrations below detection limit were set to half of the detection limit. Concentration of I-Hg was estimated by calculation of the difference between concentration of total mercury and concentration of MeHg. If the calculated difference was negative, the concentration of I-Hg was set to 0.
Outcomes
The primary outcome of the project was change in GHC index 1 year after removal of the amalgam fillings, which is reported elsewhere [Citation21]. The GHC index is the sum score calculated from numeric rating scales of 12 items (musculoskeletal complaints, gastrointestinal complaints, cardiovascular complaints, skin problems, complaints related to eyes/sight, complaints related to ears/hearing/nose/throat, tiredness, dizziness, headaches, memory problems, difficulty concentrating and anxiety/depression) [Citation22,Citation29]. The GHC index is shown to be a valid and responsive instrument for assessing symptom intensity in patients attributing their health complaints to amalgam fillings and undergoing amalgam removal [Citation30]. Concentration of mercury in serum was a predefined secondary outcome. Additional outcomes were concentration of Ag in serum and concentration of Se in serum.
Statistical methods
Since the distribution of trace element data generally was skewed, nonparametric tests (Wilcoxon Signed Rank Test) were used for calculation of the statistical significance of changes of concentrations of trace elements in serum from baseline to follow up. Between group differences were tested with Mann Whitney U-test or Kruskal Wallis Test. For calculations of the statistical significance of correlations between variables Kendall’s tau b was used. Logistic regression was used to calculate odds ratios for improvement of general health complaints (above or below the median change score) related to biomarkers of exposure and the exposure indicator. Paired sample T-test was used for calculation of within group changes of GHC from baseline to first follow-up. Linear mixed models were used to analyse changes over time from baseline (Q1) to the first (Q2) and second follow-up (Q3) in relation to concentration of I-Hg in serum [Citation31]. Within-group and between-group effect sizes (Cohen’s d) were calculated by dividing the mean difference by the standard deviation of the mean difference. Within group effect sizes (and 95% CI) for GHC changes from Q1 to Q3 were estimated by using the regression coefficients from analysis by linear mixed models of z-transformed data. The z-transformation allows interpretation of data on a dimensionless scale (e.g. effect size).
IBM-SPSS (IBM Corp. IBM SPSS Statistics for Windows, version 27, Armonk, NY, USA) and STATA (StataCorp LCC. Stata Statistical Software: 17.0 College Station, TX, USA) were used for the statistical analyses. The p-values below .05 were considered statistically significant, but effect sizes were also taken into consideration [Citation32].
Sample size calculation
The sample size calculation was based on assumptions regarding the primary outcome of the project (i.e. changes of intensity of general health complaints; GHC index) [Citation21]. Based on a 1:1 ratio of the Amalgam and MUPS cohorts, power analysis indicated 81.5% power for a total of 60 patients (with 30 in each group) given a mean difference of 2.5 in the MUPS cohort and 10 in the Amalgam cohort (a between-group difference of 7.5 in GHC change scores and an effect size of 0.75) and a common within-group standard deviation of 10.0 and alpha set to 0.05.
Ethics
The project was approved by the Norwegian Research Ethics Committee South East (2012/331/REK sør-øst) and registered at Clinicaltrials.gov (NCT01682278). All participants signed an informed consent form.
Funding and project organisation
The project was funded by the Norwegian Ministry of Health and Care Services and the Dental Biomaterials Adverse Reaction Unit in Bergen was appointed by the Norwegian Directorate of Health to organize the project.
Results
Subjects
Questionnaire data at both baseline and the first follow up was available for 32, 28, and 19 participants in the three cohorts (Amalgam, MUPS, and the Healthy cohort). For 30, 25, and 11 participants in the cohorts the collection of serum was successful at both baseline and first follow up and thus, were available for analyses. For two participants in the Amalgam cohort, serum samples were only available at baseline. Demographic characteristics for the three cohorts are given in . At follow up the symptom load in the Amalgam cohort as measured by the GHC index was significantly lower compared to baseline (p < .001, paired T-test, ). The effect size (Cohen’s d) was 0.853 (95% confidence interval 0.428 to 1.267). A detailed analysis of changes in symptom load (GHC index and SF-36) in the cohorts is published elsewhere [Citation21].
Table 1. Demographic characteristics and GHC index at baseline, first follow-up (Q2) and change score for participants in the three cohorts with available serum samples at both baseline and follow-up.
Dental treatment
The 32 patients in the Amalgam cohort were given dental treatment at 212 sessions within the project. The mean number of treatment sessions was 6.6 (median 6.5, range from 2 to 13). Dental amalgam restorations were removed in a total of 179 treatment sessions (dentist documentation) or 178 sessions (patient documentations). Rubber dam was used in about three-quarter of the removal sessions, water-cooling and high-volume evacuation was according to dentist and patient documentation used in 94% and 92%, respectively. Rubber dam, water-cooling and high-volume evacuation were not used in all amalgam removal sessions for 17 patients using the documentation by the dentists. According to patient documentation, dietary supplements (vitamins and minerals) were used in conjunction with 57% of the amalgam removal sessions, other preparations like alcohol or charcoal were used by 19%; corresponding numbers as reported by dentists were lower ().
Table 2. Dental treatment sessions with amalgam removal in the amalgam cohort.
Twenty-one patients reported intake of dietary supplements (vitamins and minerals) and 10 patients reported intake of other preparations like alcohol or charcoal in conjunction with at least one amalgam removal session. Use of additional extraoral dental suction or external air delivered to the patient via nasal mask was reported by six patients.
Supplementary details about the dental treatment are given in Table S1 (Supplementary material).
Trace elements in serum
Inorganic mercury
At baseline, the mean concentration of I-Hg in the Amalgam cohort was 0.23 (SD 0.21) µg Hg/L () and there was no significant difference between the cohorts (p = .495; Kruskal Wallis test). At follow-up one year after amalgam removal, the mean value for I-Hg was below detection limit indicating a significant decrease (p < .001; Wilcoxon Signed Rank Test; ). There were no significant changes of concentration of I-Hg in the other two cohorts (p = .847 and p = .313, respectively; and ). At follow-up concentration of I-Hg was significantly lower in the Amalgam cohort compared to the other two cohorts (p < .001 and p = .002, respectively).
Figure 1. Concentration of inorganic Hg in serum (µg Hg/L) in the Amalgam cohort (n = 30), MUPS cohort (n = 25) and in the Healthy cohort (n = 11) at baseline and first follow up. In the box plots upper and lower quartiles and median value are indicated. The highest and lowest values are indicated by the whiskers, while outliers are marked with a circle or an asterisk.
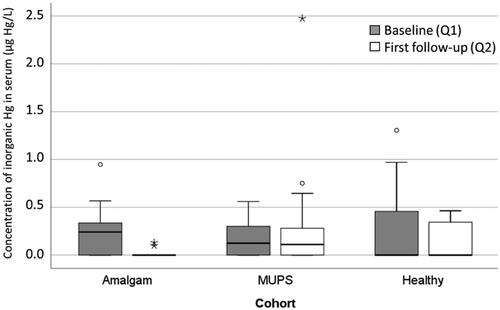
Table 3. Concentration of inorganic Hg (I-Hg), MeHg, Ag and Se in serum (µg/L) at baseline and follow-up.
Methylmercury
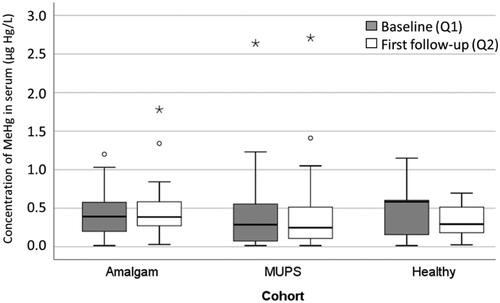
At baseline, the mean concentration of MeHg in the Amalgam cohort was estimated at 0.43 (SD 0.30) µg Hg/L, () and the concentration was not significantly changed (mean concentration 0.47 (SD 0.36) µg Hg/L; p = .560) at follow-up (). There were no significant differences between the cohorts regarding concentration of MeHg in serum neither at baseline nor at follow-up (Kruskal-Wallis test; ).
Figure 2. Concentration of MeHg in serum (µg Hg/L) in the Amalgam cohort (n = 30), MUPS cohort (n = 25) and in the Healthy cohort (n = 11) at baseline and first follow up. For explanation of the box plots, see legend to .
Silver
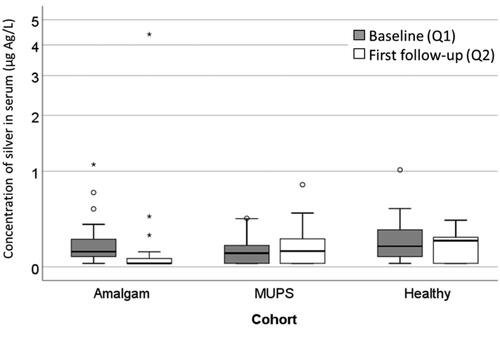
A similar pattern as for I-Hg was found for concentration of Ag in serum. In the Amalgam cohort there was a significant decrease (p < .001; Wilcoxon Signed Rank Test; ), but in the MUPS cohort and in the Healthy cohort, there was no significant change ( and ). There were no significant differences between the cohorts regarding concentration of Ag in serum at baseline, but at the first follow-up (Kruskal-Wallis test; p = .005).
Figure 3. Concentration of Ag in serum (µg Ag/L) in the Amalgam cohort (n = 30), MUPS-cohort (n = 25) and in the Healthy cohort (n = 11) at baseline and first follow-up. For explanation of the box plots, see legend to .
Selenium
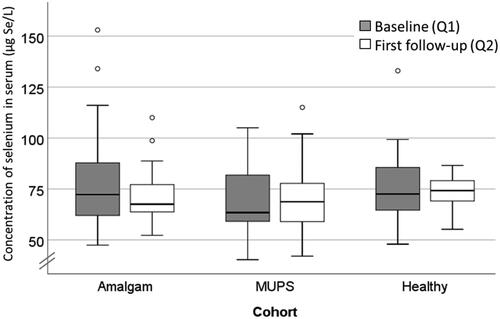
Concentration of Se in serum was not significantly changed in any cohort ( and ). There were no significant differences between the cohorts regarding concentration of Se in serum neither at baseline nor at follow-up (Kruskal-Wallis test).
Figure 4. Concentration of Se in serum (µg Se/L) in the Amalgam cohort (n = 30), MUPS-cohort (n = 25) and in the Healthy cohort (n = 11) at baseline and follow-up. For explanation of the box plots, see legend to .
Correlation between number of tooth surfaces filled with dental amalgam and markers of exposure
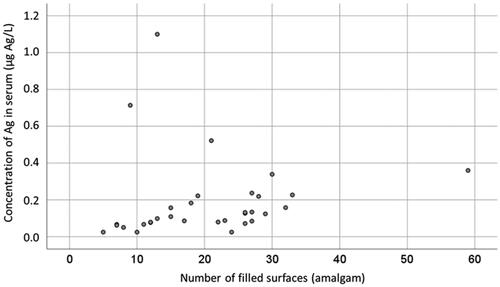
At baseline, there was a significant correlation between concentration of I-Hg in serum and number of tooth surfaces filled with amalgam in the Amalgam cohort (Kendall’s tau b 0.317, p = .014, n = 32; ). In addition, there was a significant correlation between concentration of Ag in serum and number of tooth surfaces filled with amalgam (Kendall’s tau b = 0.415, p < .001, n = 32; ).
Figure 5. Concentration of I-Hg in serum (µg Hg/L) at baseline related to number of tooth surfaces filled with amalgam in the Amalgam cohort (n = 32).
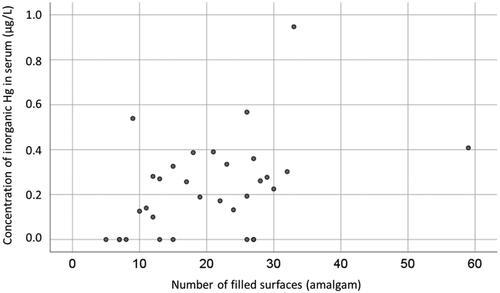
Figure 6. Concentration of Ag in serum (µg Ag/L) at baseline related to number of tooth surfaces filled with amalgam in the Amalgam cohort (n = 32).
Correlation between concentration of trace elements in serum at baseline and follow-up
Inorganic Hg–Ag
At baseline, but not at follow-up, there was a significant correlation between concentration of I-Hg and Ag in the Amalgam cohort (Kendall’s tau b = 0.359, p = .005, n = 32). In the combined MUPS and Healthy cohorts there were significant correlations between concentration of I-Hg and Ag both at baseline and at follow-up ().
Table 4. Correlations between concentration of trace elements in serum (µg/L) at baseline and first follow-up for the Amalgam cohort (n = 30; upper part of table) and for the MUPS and Healthy cohorts (n = 36; lower part of the table).
Inorganic Hg–MeHg
In contrast to the Amalgam cohort, there was a significant correlation between concentration of I-Hg and MeHg in the MUPS and Healthy cohorts at baseline (). At follow-up, there were no significant correlations between I-Hg and MeHg in any of the cohorts.
Selenium
In the MUPS and Healthy cohorts, there were significant correlations between concentration of Se and concentration of I-Hg, MeHg and Ag at baseline and between concentration of Se and concentration of I-Hg and MeHg at follow-up (). In the Amalgam cohort, there were significant correlations between concentration of Se and concentration of MeHg both at baseline (p = .020, n = 32) and at follow-up (p = .001, n = 30; ).
Within element correlation between baseline and follow-up
In the Amalgam cohort, the within element correlations (correlation between baseline value and follow-up value) were significant for MeHg and Se (p-value <.001 for both). In the MUPS and Healthy cohorts, the within element correlations were significant for all elements (p < .001 for all; ).
Correlation between markers of exposure and GHCs
At baseline, there were no significant correlations between concentration of I-Hg and intensity of general complaints as measured by the GHC questionnaire in any cohort. Neither was there any significant correlations between change scores (difference between baseline and follow-up) for concentration of I-Hg and change scores for GHC index. The Kendall’s tau b coefficient for the Amalgam cohort was 0.173 (p = .188). Similar analyses for concentration of Ag in serum revealed no statistically significant results (zero correlation).
Since the Amalgam and the MUPS cohorts had similar symptom load at baseline they were combined. An explorative analysis showed a significant correlation between change scores for concentration of I-Hg and change scores for GHC (Kendall’s tau b coefficient 0.196, n = 55, p = .042).
In the Amalgam cohort, patients with higher concentration of I-Hg in serum at baseline had higher odds ratio for having a change score of the GHC index above the median value of 10.95. By an increase of the concentration of I-Hg in serum at baseline of 0.2 µg/L the likelihood for a GHC change score above the median value increases approximately two times (OR 2.16; 95% CI 0.90 to 5.17; n = 32). This increase was, however, not statistically significant (p = .084). Similarly, patients with higher concentration of Ag in serum at baseline had higher odds ratio for having a GHC change score above the median value. An increase of 0.2 µg Ag/L increased the likelihood approximately three times (OR 3.1; 95% CI 0.76 to 12.6; n = 32). As in the case of I-Hg, this increase was not statistically significant (p = .114).
The number of amalgam surfaces at baseline showed only a small and non-significant correlation with GHC change score: an increase by 10 amalgam surfaces increased odds ratio by 1.2 (95% CI 0.6 to 2.4; p = .524, n = 32).
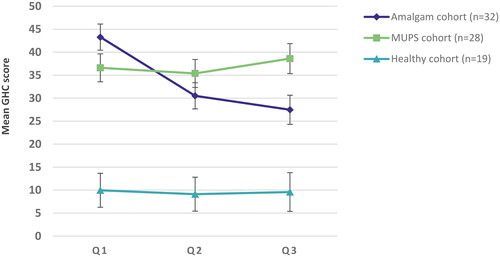
Analyses of mean GHC over time from Q1 to Q3 in the three cohorts using linear mixed models showed consistent results as with the analyses of change from Q1 to Q2 (). At Q3 the mean GHC score was significantly lower compared with Q1 (p < .001). There was no significant change over time for the other two cohorts. The decrease of the GHC score in the Amalgam cohort was not significantly associated with change in concentration of I-Hg in serum from Q1 to Q2 (p = .605). After analyses of z-transformed data by linear mixed models the effect size in the Amalgam cohort was estimated to 0.70 for change from Q1 to Q2 (95% CI 0.41 to 0.99) and 0.87 for change from Q1 to Q3 (95% CI from 0.53 to 1.20).
Figure 7. Mean GHC index (and standard error) at baseline (Q1), and at first (Q2) and second follow-up (Q3). Mean index score at the second follow-up was estimated by use of linear mixed models.
Dental treatment procedures and patient actions related to outcomes
For 17 patients in the Amalgam cohort rubber dam, water-cooling and high-volume evacuation were to some degree not used during one or several amalgam removal sessions. The GHC mean change score for these patients was lower, but not significantly, compared to the 15 patients in the Amalgam cohort for whom rubber dam, water-cooling, and high-volume evacuation was used during all amalgam removal sessions (effect size 0.515; ).
Table 5. Dental treatment procedures related to mean GHC change scores in the Amalgam cohort.
Patients who reported use of additional extraoral dental suction or external air delivered to the patient via nasal mask in conjunction with the amalgam removal sessions had slightly higher mean GHC change score than patients who not reported this (effect size 0.303; ).
Twenty-one patients reported intake of vitamins and minerals in conjunction with the amalgam removal sessions. These patients had higher, but not significantly, mean GHC change score than patients who not reported this. The effect size was medium (0.512, ).
Intake of alcohol, charcoal etc. in conjunction with the amalgam removal sessions was reported by 10 patients. These patients had higher mean GHC change score (17.1; SD 19.6) than patients who not reported intake of alcohol, charcoal, etc. in conjunction with the removal sessions (10.8; SD 14.0, n = 22). As for vitamins and minerals the difference was not statistically significant (p = .306). The effect size was 0.398 ().
Including all four variables mentioned above as independent variables in a stepwise (backward) linear regression model using GHC change score as dependent variable, no variables were statistically significant.
Explorative analyses indicated that patients who reported intake of vitamins and minerals in conjunction with the amalgam removal sessions had slightly higher concentration of Se in serum at follow up (mean concentration 74 µg/L [SD 15]; n = 20) compared to patients who not reported intake of vitamins and minerals (mean 66 µg/L [SD 10], n = 10; p = .099). There were no significant correlations between Se in serum and GHC change score neither at baseline nor at first follow-up (Kendall’s tau b coefficients were 0.095 [n = 32] and 0.168 [n = 30], respectively).
Adverse events
In the Amalgam cohort (n = 32), nine patients (28.1%; three women and six men; mean age 49.9 years, SD 5.5) reported aggravation of symptoms within 1 week after a treatment session. The reported symptoms were urticaria, headache, fatigue, facial pain/jaw pain/sinusitis, exhaustion, sensitivity to sound, dizziness, flu-like symptoms and facial eczema.
There was no Serious Adverse Event registered in the study, but three patients had to terminate participation in the project before finished treatment due to health reasons [Citation21].
Experienced aggravation of symptoms within one week after a treatment session was not a predictor for having a change score of the GHC index above the median value of 10.95 (odds ratio 0.7, 95% CI 0.2 to 3.4, p = .695).
Discussion
Main findings
As expected, there was a significant correlation between number of amalgam surfaces and concentration of I-Hg in serum (). This verifies the well-known causal relationship between mercury in body fluids and exposure to amalgam fillings [Citation24,Citation33–37]. In addition, there was a significant correlation between number of amalgam surfaces and concentration of Ag in serum (), which further supports the hypothesis that exposure to amalgam fillings causes increased uptake of Ag.
In the Amalgam cohort concentration of both I-Hg and Ag in serum decreased significantly after removal of dental amalgam restorations in the Amalgam cohort. There were no significant changes over time in the two other cohorts. At baseline, the concentration of both I-Hg and Ag in the Amalgam cohort was similar to the other two cohorts and within the expected range for individuals with exposure to dental amalgam fillings [Citation6,Citation24,Citation38,Citation39]. Even though both the GHC index and biomarkers of exposure decreased considerably after amalgam removal, there were no significant associations between markers of exposure and health outcomes. Thus, there was no evidence of a direct dose-response relationship between exposure and health complaints, but it cannot be excluded that genetic polymorphisms [Citation4,Citation40–42] and mercury induced inflammatory response [Citation43,Citation44] could be of importance as potential effect modifiers. However, an alternative interpretation is that the improvement of health is unrelated to mercury and Ag.
Se in serum was similar in the cohorts at both baseline and follow-up, and in the lower end of the reference range of 63–126 µg/L [Citation18]. Even though Se potentially could be an effect modifier, there was no evidence of an association between concentration of Se in serum and GHC change score.
In both the combined MUPS and Healthy cohort and in the Amalgam cohort, there were significant correlations between concentration of MeHg and Se both at baseline and at the follow-up (). Since both MeHg and Se are present in seafood [Citation45], it is likely that this is explained by the dietary intake.
Strengths and limitations
Strengths of this study include the three-arm longitudinal design including comparison groups with and without MUPS, the discrimination between I-Hg and MeHg; the inclusion of analyses of Ag in addition to mercury; and the availability of two successive follow-up samples (Q2 and Q3). Limitations include the lack of randomisation of MUPS patients and a modest sample size which limits the statistical power of the study. It cannot be excluded that small effects with potential importance could have been overlooked.
Further results, comparison to other studies
A decrease of the concentration of I-Hg in serum is consistent with an earlier report [Citation46]. In addition, there are several reports showing decrease of total mercury in biological indicator media (e.g. urine, blood and plasma) after removal of dental amalgam [Citation29,Citation35,Citation39,Citation46]. A decrease of Ag in serum after removal of the amalgam restorations has also been previously reported [Citation39].
As expected, there was no change of the concentration of MeHg in serum after removal of amalgam restorations. This supports previous findings from an autopsy study [Citation7], and more recent multivariate analyses of data from the US NHANES study [Citation24], that amalgam restorations do not contribute to the MeHg concentration in blood and supports rejection of the hypothesis that I-Hg released from dental amalgam is methylated, of quantitative significance, to MeHg in the body.
The combined exposure to I-Hg released from amalgam restorations and I-Hg in food might exceed the tolerable weekly intake of I-Hg [Citation47]. Since mercury is a highly toxic element and the commonly used safety margins are exceeded [Citation48], it is not unlikely that some individuals in the population could experience side effects due to mercury released from amalgam restorations [Citation4]. Notably, the updated safety communication from the US Food and Drug Administration lists several symptoms that could be due to high levels of mercury exposure [Citation49], which are also common in patients with symptoms attributed to dental amalgam (e.g. mood disorders, fatigue, memory disturbances, pain in joints and muscles) [Citation50,Citation51]. In the present study individuals with the highest baseline concentrations of I-Hg had greater chance for having more improvement as reflected by higher GHC change scores (odds ratio 2.16 with a 95% CI from 0.90 to 5.17 for an increase of 0.2 µg Hg/L). This was, however, not statistically significant, but is in accordance with findings reported by Weidenhammer et al. [Citation46] and by Stenman and Grans [Citation52]. A similar pattern was found for Ag in serum. Individuals with the highest baseline concentrations of Ag had greater chance to have more improvement. Since there was a strong and significant correlation between concentration of I-Hg in serum and concentration Ag in serum (), the role of Ag is far from clear. Even though these results were non-significant it cannot be excluded that a larger study with a higher number of participants could be more informative. In addition, there is probably several factors of importance for the MUPS-condition, but the findings regarding correlations between biomarkers of exposure and symptom score reported by Weidenhammer et al. [Citation46] cannot be disregarded.
Since mercury is considered as one of the top ten chemicals of major public health concern [Citation53], a phase down strategy has been implemented for mercury in products including dental amalgam [Citation54]. The phase down strategy for dental amalgam includes disease prevention and use of mercury-free alternatives [Citation55–57]. In Europe, the goal is to phase out the use of dental amalgam by 2030 [Citation58]. However, since well-made amalgam fillings are durable and last for many years, people will have amalgam fillings for decades to come [Citation59].
This study suggests that concentration of both I-Hg and Ag in serum are useful biomarkers of exposure to dental amalgam. Both biomarkers decreased considerably after removal of all amalgam restorations and there were significant correlations between concentration in serum and number of amalgam surfaces. Concentration of MeHg in serum was not influenced by exposure to dental amalgam.
Even though intensity of GHCs was reduced after amalgam removal, data from this study do not support a direct relationship between intensity of GHCs and biomarkers of exposure to dental amalgam. However, a correlation between changes in concentration of I-Hg in serum and change in intensity of GHCs after removal of amalgam restorations in patients attributing health complaints to dental amalgam cannot be excluded. Additional studies with higher sample size could provide additional important information.
Conclusion
Removal of all amalgam restorations is followed by a decrease of concentration of I-Hg and Ag in serum. Exposure to amalgam fillings causes increase of the daily dose of both I-Hg and Ag, which is reflected by concentration of these elements in serum. Even though intensity of GHCs decreased after removal of all amalgam restorations there was no clear evidence of a direct relationship between exposure and health complaints.
Author contributions
HH, FM, TA, ELW and LB were all involved in the study conception and design. LB and ELW were involved in acquisition of data. LB, FM, TA, ELW and HH were involved in the analysis and interpretation of data. LB was involved in drafting of the manuscript. LB, FM, TA, ELW and HH were all involved in the critical revision of the manuscript. All authors approved the final manuscript.
Supplementary_material_Table_S1.docx
Download MS Word (14.2 KB)Acknowledgements
Merete Allertsen is gratefully acknowledged for excellent help with the project administration and Randi Sundfjord is gratefully acknowledged for excellent technical assistance. We are grateful for statistical advice from prof. Stein Atle Lie regarding use of linear mixed models.
Disclosure statement
No potential conflict of interest was reported by the author(s).LB is employed by the Norwegian Dental Biomaterials Adverse Reaction Unit, which is funded by the Norwegian Ministry of Health and Care Services; no financial relationships with any organisations that might have an interest in the submitted work in the previous three years, no other relationships or activities that could appear to have influenced the submitted work.
Additional information
Funding
References
- Anusavice KJ, Phillips RW, Shen C, et al. Phillips’ science of dental materials. 12th ed. St. Louis (MO): Elsevier/Saunders; 2013.
- Björkman L, Gjerdet NR, Samuelsen JT, et al. Dentale restaureringsmaterialer: biologiske egenskaber og deres kliniske konsekvenser [dental restorative materials: biological properties and their clinical implications] [vitenskapelig oversiktsartikkel/review]. Nor Tannlegeforen Tid. 2016;126:872–880.
- Brownawell AM, Berent S, Brent RL, et al. The potential adverse health effects of dental amalgam. Toxicol Rev. 2005;24(1):1–10.
- Berlin M. Mercury in dental amalgam: a risk analysis. Neurotoxicology. 2020;81:382–386.
- Berlin M, Zalups RK, Fowler BA. Mercury. In: Nordberg GF, Fowler BA, Nordberg M, editors. Handbook on the toxicology of metals. Amsterdam (Netherlands): Elsevier; 2014. p. 1013–1075.
- Berglund M, Lind B, Björnberg KA, et al. Inter-individual variations of human mercury exposure biomarkers: a cross-sectional assessment. Environ Health. 2005;4:20.
- Björkman L, Lundekvam BF, Laegreid T, et al. Mercury in human brain, blood, muscle and toenails in relation to exposure: an autopsy study. Environ Health. 2007;6:30.
- Cherian MG, Hursh JB, Clarkson TW, et al. Radioactive mercury distribution in biological fluids and excretion in human subjects after inhalation of mercury vapor. Arch Environ Health. 1978;33(3):109–114.
- Sandborgh-Englund G, Elinder CG, Johanson G, et al. The absorption, blood levels, and excretion of mercury after a single dose of mercury vapor in humans. Toxicol Appl Pharmacol. 1998;150(1):146–153.
- Arijs K, Nys C, Van Sprang P, et al. Setting a protective threshold value for silver toward freshwater organisms. Environ Toxicol Chem. 2021;40(6):1678–1693.
- Magesky A, Pelletier É. Cytotoxicity and physiological effects of silver nanoparticles on marine invertebrates. In: Saquib Q, Faisal M, Al-Khedhairy AA editors. Cellular and molecular toxicology of nanoparticles. Cham: Springer International Publishing; 2018. p. 285–309.
- Doudoroff P, Katz M. Critical review of literature on the toxicity of industrial wastes and their components to fish. Sewage Ind Wastes. 1953;25(7):802–839.
- Drake PL, Hazelwood KJ. Exposure-related health effects of silver and silver compounds: a review. Ann Occup Hyg. 2005;49(7):575–585.
- Park EJ, Bae E, Yi J, et al. Repeated-dose toxicity and inflammatory responses in mice by oral administration of silver nanoparticles. Environ Toxicol Pharmacol. 2010;30(2):162–168. Sep
- Rayman MP. Selenium and human health. Lancet. 2012;379(9822):1256–1268.
- Barros-Neto JA, Souza-Machado A, Kraychete DC, et al. Selenium and zinc status in chronic myofascial pain: serum and erythrocyte concentrations and food intake. PLoS One. 2016;11(10):e0164302.
- Alexander J. Selenium. In: Nordberg GF, Fowler BA, Nordberg M, editors. Handbook on the toxicology of metals. Amsterdam (Netherlands): Elsevier; 2014. p. 1175–1208.
- Alexander J, Alehagen U, Aaseth JO. Selenium - a trace element of clinical significance. Tidsskr nor Laegeforen. 2020;140(17).
- Richardson RD, Engel CC Jr. Evaluation and management of medically unexplained physical symptoms. Neurologist. 2004;10(1):18–30.
- Burton C. Beyond somatisation: a review of the understanding and treatment of medically unexplained physical symptoms (MUPS). Br J Gen Pract. 2003;53(488):231–239.
- Björkman L, Musial F, Alraek T, et al. Removal of dental amalgam restorations in patients with health complaints attributed to amalgam: a prospective cohort study. J Oral Rehabil. 2020;47(11):1422–1434.
- Lygre GB, Gjerdet NR, Björkman L. A follow-up study of patients with subjective symptoms related to dental materials. Community Dent Oral Epidemiol. 2005;33(3):227–234.
- Lamu AN, Björkman L, Hamre HJ, et al. Is amalgam removal in patients with medically unexplained physical symptoms cost-effective? A prospective cohort and decision modelling study in Norway. PLoS ONE. 2022;17(4):e0267236.
- Yin L, Lin S, Summers AO, et al. Children with amalgam dental restorations have significantly elevated blood and urine mercury levels. Toxicol Sci. 2021;184(1):104–126.
- Norwegian Directorate of Health. Retningslinjer for utredning og behandling ved mistanke om bivirkninger fra odontologiske biomaterialer. [Guidelines for examination and treatment of side effects from dental biomaterials]. Oslo: Helsedirektoratet; 2008. (Nasjonale faglige retningslinjer).
- Rodushkin I, Ödman F, Olofsson R, et al. Determination of 60 elements in whole blood by sector field inductively coupled plasma mass spectrometry. J Anal Atom Spectrom. 2000;15(8):937–944.
- Rodushkin I, Engström E, Stenberg A, et al. Determination of low-abundance elements at ultra-trace levels in urine and serum by inductively coupled plasma–sector field mass spectrometry. Anal Bioanal Chem. 2004;380(2):247–257.
- Baxter DC, Rodushkin I, Engström E, et al. Methylmercury measurement in whole blood by isotope-dilution GC-ICPMS with 2 sample preparation methods. Clin Chem. 2007;53(1):111–116.
- Sjursen TT, Lygre GB, Dalen K, et al. Changes in health complaints after removal of amalgam fillings. J Oral Rehabil. 2011;38(11):835–848.
- Lamu AN, Robberstad B, Hamre HJ, et al. Validity and responsiveness of GHC-index in patients with amalgam-attributed health complaints. Acta Odontol Scand. 2021;15:1–8.
- Garcia TP, Marder K. Statistical approaches to longitudinal data analysis in neurodegenerative diseases: Huntington’s disease as a model. Curr Neurol Neurosci Rep. 2017;17(2):14.
- Greenland S, Senn SJ, Rothman KJ, et al. Statistical tests, P values, confidence intervals, and power: a guide to misinterpretations. Eur J Epidemiol. 2016;31(4):337–350.
- Olstad ML, Holland RI, Wandel N, et al. Correlation between amalgam restorations and mercury concentrations in urine. J Dent Res. 1987;66(6):1179–1182.
- Abraham JE, Svare CW, Frank CW. The effect of dental amalgam restorations on blood mercury levels. J Dent Res. 1984;63(1):71–73.
- Molin M, Bergman B, Marklund SL, et al. Mercury, selenium, and glutathione peroxidase before and after amalgam removal in man. Acta Odontol Scand. 1990;48(3):189–202.
- Ekstrand J, Björkman L, Edlund C, et al. Toxicological aspects on the release and systemic uptake of mercury from dental amalgam. Eur J Oral Sci. 1998;106(2 Pt 2):678–686.
- Kingman A, Albertini T, Brown LJ. Mercury concentrations in urine and whole blood associated with amalgam exposure in a US military population. J Dent Res. 1998;77(3):461–471.
- Halbach S, Vogt S, Kohler W, et al. Blood and urine mercury levels in adult amalgam patients of a randomized controlled trial: interaction of Hg species in erythrocytes. Environ Res. 2008;107(1):69–78.
- Frisk P, Lindvall A, Hudecek R, et al. Decrease of trace elements in erythrocytes and plasma after removal of dental amalgam and other metal alloys. Biol Trace Elem Res. 2006;113(3):247–259.
- Wang Y, Goodrich JM, Werner R, et al. An investigation of modifying effects of single nucleotide polymorphisms in metabolism-related genes on the relationship between peripheral nerve function and mercury levels in urine and hair. Sci Total Environ. 2012;417-418:32–38. 15
- Austin DW, Spolding B, Gondalia S, et al. Genetic variation associated with hypersensitivity to mercury. Toxicol Int. 2014;21(3):236–241.
- Kazantzis G. Mercury exposure and early effects: an overview. Med Lav. 2002;93(3):139–147.
- Pollard KM, Cauvi DM, Toomey CB, et al. Mercury-induced inflammation and autoimmunity. Biochim Biophys Acta Gen Subj. 2019;1863(12):129299. Dec
- Björkman L, Brokstad KA, Moen K, et al. Minor changes in serum levels of cytokines after removal of amalgam restorations. Toxicol Lett. 2012;211(2):120–125.
- Svensson BG, Schütz A, Nilsson A, et al. Fish as a source of exposure to mercury and selenium. Sci Total Environ. 1992;126(1-2):61–74.
- Weidenhammer W, Bornschein S, Zilker T, et al. Predictors of treatment outcomes after removal of amalgam fillings: associations between subjective symptoms, psychometric variables and mercury levels. Community Dent Oral Epidemiol. 2010;38(2):180–189.
- EFSA Panel on Contaminants in the Food Chain (CONTAM). Scientific opinion on the risk for public health related to the presence of mercury and methylmercury in food. EFSA J. 2012;10(12):2985.
- Richardson GM, Wilson R, Allard D, et al. Mercury exposure and risks from dental amalgam in the US population, post-2000. Sci Total Environ. 2011;409(20):4257–4268.
- Food and Drug Administration. Recommendations about the use of dental amalgam in certain high-risk populations: FDA safety communication: US Food and Drug Administration; 2020. [updated September 24, 2020; cited January 25, 2022]. Available from: https://www.fda.gov/medical-devices/safety-communications/recommendations-about-use-dental-amalgam-certain-high-risk-populations-fda-safety-communication.
- Lygre GB, Sjursen TT, Svahn J, et al. Characterization of health complaints before and after removal of amalgam fillings–3-year follow-up. Acta Odontol Scand. 2013;71(3-4):560–569.
- Barregård L, Sällsten G, Järvholm B. People with high mercury uptake from their own dental amalgam fillings. Occup Environ Med. 1995;52(2):124–128.
- Stenman S, Grans L. Symptoms and differential diagnosis of patients fearing mercury toxicity from amalgam fillings. Scand J Work Environ Health. 1997;23 Suppl 3(Suppl 3):59–63.
- World Health Organization. Mercury and health: WHO; 2017 [cited 2022 September 28]. Available from: https://www.who.int/news-room/fact-sheets/detail/mercury-and-health.
- United Nations Environment Programme (UNEP). The Minamata Convention on Mercury, 2021 [cited 2022 October 14]. Available from: https://www.mercuryconvention.org/en.
- World Health Organization. Prevention and treatment of dental caries with mercury-free products and minimal intervention: WHO oral health briefing note. Geneva: World Health Organization; 2022.
- Kielbassa AM, Glockner G, Wolgin M, et al. Systematic review on highly viscous glass-ionomer cement/resin coating restorations (part I): do they merge minamata convention and minimum intervention dentistry? Quintessence Int. 2016;47(10):813–823.
- Kielbassa AM, Glockner G, Wolgin M, et al. Systematic review on highly viscous glass-ionomer cement/resin coating restorations (part II): do they merge minamata convention and minimum intervention dentistry? Quintessence Int. 2017;48(1):9–18.
- MEPs back mercury pollution curbs, in line with UN Minamata convention (Press release 14-03-2017). [Internet]. The European Parliament 2017. Available from: http://www.europarl.europa.eu/news/en/press-room/20170308IPR65692/meps-back-mercury-pollution-curbs-in-line-with-un-minamata-convention.
- Opdam NJ, Bronkhorst EM, Loomans BA, et al. 12-year survival of composite vs. amalgam restorations. J Dent Res. 2010;89(10):1063–1067.