
Do BH, Koizumi H, Ohbuchi T, et al. (2017). Expressions of TRPVs in the cholesteatoma epithelium. Acta Otolaryngol. 137:1039–1045. https://doi.org/10.1080/00016489.2017.1336796.
When the above article was first published, colour in print had not been implemented.
Figure 1. Photomicrographs of fluorescence immunohistochemical staining for TRPV1. The panels show positive staining/negative control pairs of the postauricular skin (a/b) and cholesteatoma tissue (c/d). Green and blue colors express the fluorescence of Alexa Flour 488 and DAPI, respectively. Weak fluorescence is seen in the granular and spinous layers in the skin, but there is no significant fluorescence in cholesteatoma. Scale bar = 50 μm.
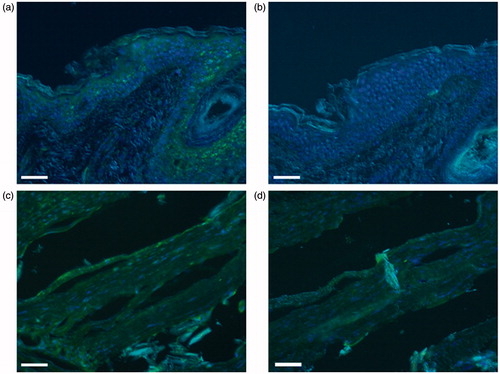
Figure 2. Photomicrographs of fluorescence immunohistochemical staining for TRPV3. The panels show positive staining/negative control pairs of the postauricular skin (a/b) and cholesteatoma tissue (c/d). Green and blue colors express the fluorescence of Alexa Flour 488 and DAPI, respectively. Strong fluorescence in the granular layer and moderate fluorescence in the spinous later are observed in the skin, while fluorescence is moderate in the horny layer and weak in the granular and spinous layers of the cholesteatoma tissue. Scale bar = 50 μm.
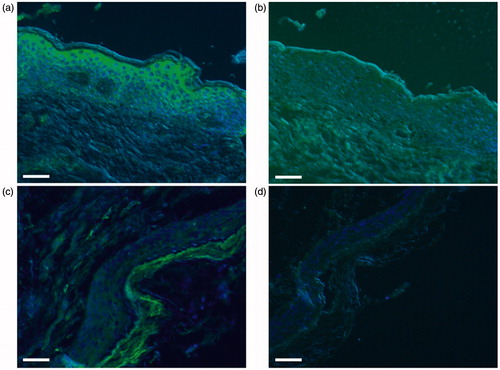
Figure 3. Photomicrographs of fluorescence immunohistochemical staining for TRPV4. The panels show positive staining/negative control pairs of the postauricular skin (a/b) and cholesteatoma tissue (c/d). Green and blue colors express the fluorescence of Alexa Flour 488 and DAPI, respectively. There is weak fluorescence in the horny layer of both skin and cholesteatoma, whereas the underlying viable cell layers show no fluorescence in either tissue. Scale bar = 50 μm.
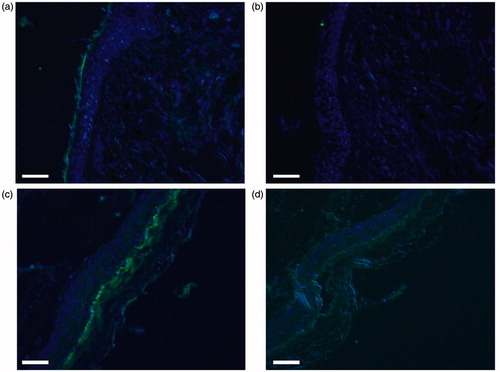
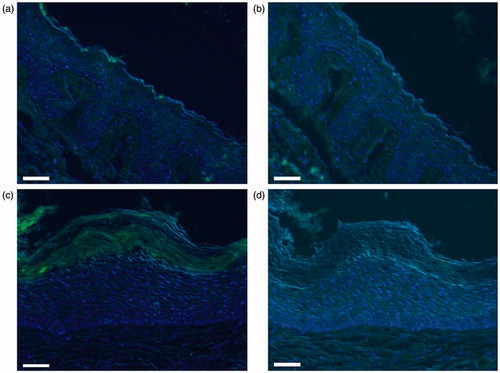
Figure 4. Photomicrographs of fluorescence immunohistochemical staining for TRPV6. The panels show positive staining/negative control pairs of the postauricular skin (a/b) and cholesteatoma tissue (c/d). Green and blue colors express the fluorescence of Alexa Flour 488 and DAPI, respectively. No fluorescence is observed in the skin, and the cholesteatoma tissue exhibits weak fluorescence only in the horny layer. Scale bar = 50 μm.
Taylor & Francis apologises for this error.