
 ?Mathematical formulae have been encoded as MathML and are displayed in this HTML version using MathJax in order to improve their display. Uncheck the box to turn MathJax off. This feature requires Javascript. Click on a formula to zoom.
Abstract
Imputation of missing data in high-dimensional datasets with more variables P than samples N, , is hampered by the data dimensionality. For multivariate imputation, the covariance matrix is ill conditioned and cannot be properly estimated. For fully conditional imputation, the regression models for imputation cannot include all the variables. Thus, the high dimension requires special imputation approaches. In this article, we provide an overview and realistic comparisons of imputation approaches for high-dimensional data when applied to a linear mixed modeling (LMM) framework. We examine approaches from three different classes using simulation studies: multiple imputation with penalized regression, multiple imputation with recursive partitioning and predictive mean matching; and multiple imputation with Principal Component Analysis (PCA). We illustrate the methods on a real case study where a multivariate outcome (i.e., an extracted set of correlated biomarkers from human urine samples) was collected and monitored over time and we discuss the proposed methods with more standard imputation techniques that could be applied by ignoring either the multivariate or the longitudinal dimension. Our simulations demonstrate the superiority of the recursive partitioning and predictive mean matching algorithm over the other methods in terms of bias, mean squared error and coverage of the LMM parameter estimates when compared to those obtained from a data analysis without missingness, although it comes at the expense of high computational costs. It is worthwhile reconsidering much faster methodologies like the one relying on PCA.
1 Introduction
Many different research fields are increasingly dealing with high-dimensional data where the number of covariates (P) is much larger than the number of units (N), in what is known in literature as the “curse of dimensionality.” Such data can arise for different reasons. The high dimension can come from a large number of variables obtained at one time point (i.e., cross-sectional data) or by a single or a few variables measured over many time points (i.e., longitudinal data). For instance, in cross-sectional studies hundreds to thousands of genes or proteomes are being collected on all included units (Bras and Menezes Citation2006). In longitudinal studies, wearables are able to collect millions of heart rates on each individual (Soroushmehr and Najarian Citation2016). The high dimensions create challenges for scaling up statistical methods developed for low-dimensional data, in terms of plausibility of the underlying assumptions (i.e., it’s hard to characterize the observed data distribution from a parameterized family of distributions whose dimension
grows with the dimension P of the data), in terms of practicalities such as computing time, or in terms of technicalities where models are ill-posed (i.e., calculation of the empirical covariance).
One area of statistics where the high dimension is a serious issue is the area of missing data. Missing data occur in almost all studies, particularly in observational (cross-sectional and longitudinal) studies, where nonresponse is common, and modern collection methods can be hampered by measurement failures (insufficient resolution, image corruption, fabrication errors, sensor failures, internet transmission problems etc.). The current state-of-the-art for addressing missingness is to use multiple imputation (MI) methods (Schafer Citation1997; Schafer and Graham Citation2002). These methods can be roughly classified as multivariate (normal) approaches and chained-equations or fully conditional approaches (van Buuren Citation2018). Methods in both classes would fail in high-dimensional data. The reason is that the high dimensionality prohibits the estimation of the multivariate missing data distributions and the chained-equations. Indeed, covariance matrices for imputation with multivariate normal distributions are ill-posed when P > N (Ledoit and Wolf Citation2004; Engel, Buydens, and Blanchet Citation2017). Furthermore, regression equations cannot include all variables when P > N. Even if these methods are still appropriate, standard software packages are in general not efficiently designed to handle high-dimensional datasets either.
The goal of this article is to find generic and efficient solutions for missing data imputation in (incomplete) high-dimensional studies. We perform a systematic and comparative study on state of the art available MI methods for large-scale high-dimensional data, through simulations and their application in the context of linear mixed-effect modeling with a longitudinal case study from health monitoring. To the best of our knowledge, this is the first comprehensive evaluation of the available MI methods for high-dimensional data.
The case study described in Section 2 considers 50 (adults) participants where 29 biomarkers were extracted from their urine samples repeatedly over 8 time points. The curse of dimensionality arises when the entire biomarkers’ profile of each participant is considered (i.e., a 29 × 8 dimensonal vector) to study for instance the potential effects of exercise altered metabolism in urine.
In the next subsection, we will give a general background on MI and introduce the existing methods for MI for high-dimensional data in the literature. Section 2 will present our motivating example, whereas Section 3 will give a detailed description of the available MI algorithms for high-dimensional data. In Section 4 we will describe the design of the simulation study and in Section 5 we will present our results. Finally, in Section 6 we will present a discussion of our results and we will provide some recommendations for further research.
1.1 Background
Missing data usually appear as non-registered or empty cells in multivariate datasets, with columns indicating variables and rows indicating units. The mechanism for missingness is called missing not at random (MNAR) when the mechanism relies on the unobserved values (of the response variable). If it relies on the observed values alone, the mechanism is called missing at random (MAR). A special case of MAR occurs when the missingness mechanism does not depend on the observed values either (whereas in longitudinal data it may still depend on the baseline covariates), resulting in a missing completely at random mechanism (MCAR). More detailed information of the three mechanisms can be found in (Schafer and Graham Citation2002).
There are two general classes of methods to conduct MI: (a) the joint modeling approach (Schafer and Graham Citation2002), which uses Markov chain Monte Carlo simulations and (b) the chained equation method (MICE), sometimes called “fully conditional specification” (FCS) or “sequential regression multiple imputation” (van Buuren Citation2018). While joint modeling has strong theoretical justifications, its performance deteriorates as the data dimension increases (Deng et al. Citation2016) and it is impossible to extend it to high-dimensional data. MICE consists of a series of regression models where each variable with missing data is modelled conditional upon (a subset of) the remaining variables in the data (van Buuren and Groothuis-Oudshoorn Citation2011; van Buuren Citation2018). It is often easier to implement than joint modeling, but it has no theoretical foundation even though it has shown satisfactory performances in extensive simulation studies. However, MICE cannot handle high-dimensional data either, since regression equations including all variables cannot be determined.
To deal with missing data in high dimensions, researchers made use of dimension reduction techniques. Among them we mention Regularized Regression (Tibshirani Citation1996; Zou Citation2006; Zou and Hastie Citation2012) and Principal Component Analysis (PCA) (Wold, Esbensen, and Geladi Citation1987). The first one consists of the minimization of the loss function of a regression model, subject to some penalties which limit the number of relevant covariates in the imputation model. Different penalty specifications give rise to various regularized regression methods (Tibshirani Citation1996; Zou Citation2006; Zou and Hastie Citation2012). The majority of the software packages with imputation purposes have included a ridge regularization option to “shrink” the big predictor matrix. We mention for example the option in the “AMELIA II” R package (Honaker, King, and Blackwell Citation2015), the
option in the “mice” R package (van Buuren and Groothuis-Oudshoorn Citation2011) or the
option in the procedure MI of the SAS software. These solutions work reasonably well when the number of units equals or is slightly smaller than the number of measured variables (Lang Citation2015). Nevertheless, in chemometrics and in health monitoring many experiments involve data tables with
. In these settings, MI based on ridge regression has poor performance and smarter solutions are required (Zahid and Heumann Citation2019).
Zhao and Long (Citation2016) incorporated regularization techniques (LASSO, adaptive LASSO and elastic net) within a Bayesian framework. However, their study was limited to settings where only one variable showed missing values. Deng et al. (Citation2016) slightly improved their work using a regularized regression scheme together with the MICE concept for three different types of data, that is, Gaussian, Bernoulli and Poisson distributed data. Because of the high computational costs of the algorithm, they considered just three variables with missing data. Lang (Citation2015) extended this work with a more general imputation scheme, exploiting the Bayesian elastic net presented in (Li and Lin Citation2010). In a simulation study Lang showed that his new method obtained comparable performances to the algorithm of Deng et al. (Citation2016), but it outperformed the adaptations contained in the R package “mice” to select more proper subsets of predictors in the chained equations. His work resulted in the new R package “MIBRR” (Lang Citation2019), including both his newly developed procedure and the algorithm of Deng et al. (Citation2016).
Recently, similar work has been published by Zahid and Heumann (Citation2019) and Zahid, Faisal, and Heumann (Citation2021), which is summarized in the R package “mispr” (Zahid Citation2018), where the authors implemented an alternative MI algorithm based on sequential penalized regressions. Yet, the authors limited the comparison of their new methodology to standard procedures, that is, the expectation-maximization algorithm (Molenberghs and Verbeke Citation2005) and the standard MICE (which clearly failed in the high-dimensional settings explored in their simulations). Also, they did not investigate their newly proposed algorithm in a high-dimensional case study dataset.
Alternatively, PCA constructs a linear mapping of the original data matrix to a lower-dimensional space so that the variance of the data in the low-dimensional representation is maximized. This is achieved through the eigenvalue decomposition of the covariance matrix or by a singular value decomposition (SVD). It is well known that PCA cannot be conducted in the presence of missing data (Josse, Pags, and Husson Citation2011). This is because PCA is based on the eigenvalue decomposition of a cross-product matrix (e.g., covariance matrix) and thus requires complete data. Therefore, the PCA algorithm has been adapted in the literature to deal explicitly with the missing data. The mostly used techniques, such as Non-linear Iterative PArtial Least Squares (NIPALS) (Wold Citation1966) and Expectation-Maximization algorithm for Principal Component Analysis (EM-PCA) (Josse and Husson Citation2012) rely only on single imputation. Recent advances for MI have been proposed by Josse, Pags, and Husson (Citation2011) that first extended the single imputation schemes derived from a PCA model into MI and later proposed also a Bayesian framework for the PCA-based imputation model (Verbanck, Josse, and Husson Citation2015; Audigier, Husson, and Josse Citation2016). Their work resulted in the R package “missMDA” (Josse and Husson Citation2016; Kucheryavskiy Citation2020). Even though the comparative studies shown in (Josse, Pags, and Husson Citation2011) and (Audigier, Husson, and Josse Citation2016) were mostly based on small datasets with P < N (and on an intrinsic MCAR missingness mechanism), the authors claimed the potential of their methods also for higher dimensional designs, which were confirmed elsewhere (Dray and Josse Citation2015; Voillet et al. Citation2016).
Lastly, Doove, Buuren, and Dusseldorp (Citation2014) considered recursive partitioning with predictive mean matching (Little Citation1988) (PMM). For recursive partitioning, they used two main techniques: Classification And Regression Trees (CART) and a random forest algorithm. This resulted in an extension of the R package “mice” with the introduction of two new functions “mice.impute.cart” and “mice.impute.rf”. The purpose of the authors was originally to study the performance of recursive partitioning in the estimation of nonlinear effects in presence of missing data. However, it is well known that these algorithms have very good predictive performances also in high-dimensional incomplete data (Degenhardt, Seifert, and Szymczak Citation2017; Matrov et al. Citation2020; Hamid et al. Citation2021), which is the reason why they have been considered in this manuscript.
2 Vier Daagse Dataset
The Vier Daagse is a very popular yearly event in Nijmegen (the Netherlands) in July, where people all over the world come to experience 4 walking days of 30 to 50 kilometers around the city. A study was conducted on a group of participants to evaluate potential changes in urine composition due to strenuous walking. A total of 51 subjects (23 females), from 25 to 85 years old, who took part at the event in 2012, were monitored during the activity. Eleven of them were diagnosed with diabetes of type 1 (7 females) and 17 of type 2 (6 females). One of the aims of the original study was to investigate potential biomarkers which are associated to exercise altering metabolism and whether any found relationship has different extents according to the patient health status (and possibly other characteristics like sex, age, and BMI). For this purpose, urine samples were collected twice a day for 4 consecutive days for each individual. A first measurement was taken in the morning before the activity and the second one after walking. Baseline patient information, such as age, sex, BMI, diabetes, were collected before the monitoring phase, whereas the distance covered was registered in each walking day.
A total of 29 biomarkers/ions (in the range m/z 33 to m/z 107) were extracted from the urine samples and observed for each participant twice a day, which create a relatively high-dimensional data structure with 236 () variables for each unit (including three baseline variables, sex, BMI and diabetes, the longitudinal biomarkers’ profile and the variable time). The details about the protocol, the individuals and the analysis of the volatile organic compounds in the urine samples are discussed elsewhere (Samudrala et al. Citation2015). Unfortunately, 35 subjects missed at least one follow-up, that is, none of the biomarkers were assessed. These missing data, together with the relatively high amount of information collected at each follow-up and the complex longitudinal structure of the study represents a big challenge. In Section 5.2 we will illustrate the impact of different MI techniques on the significance of the relevant patient-specific features.
3 Overview of the Selected Imputation Algorithms
In this section, we will examine the selected algorithms dedicated to MI for high-dimensional data in more detail. For the description of the different methods we start introducing a bit of notation. Bold symbols refer to vector notation, capital letters are used for matrices and lower case notation is used for vectors. refers to the transpose of the vector x. We then suppose that a dataset
contains P variables, consisting of both time dependent measured outcomes and of baseline variables, and N units with N < P. Note that the P variables might comprise also (non-) linear interactions among the measured variables (Howard, Rhemtulla, and Little Citation2015). The imputation algorithms discussed in this article require that all information on each unit is put next to each other, in a wide format, that is, they do not make distinctions between response and auxiliary variables. We also assume that
variables contain missing values. We will suppose that the continuous variables have been standardized (per time point and variable) prior to any statistical analysis. This is a crucial step for the methods in Section 3.3. To be consistent, this procedure has been applied before any other imputation algorithm. In the presence of longitudinal data, we will consider a wide format, with all observations for each unit appearing in one unique row after each other.
To the best of our knowledge, we could find in the literature 8 MI algorithms, from three different classes, for missing data imputation in high dimensions, namely the MI procedures of (Deng et al. Citation2016), (Lang Citation2015), and (Zahid and Heumann Citation2019) that proposed MI with regularized regression; those from (Howard, Rhemtulla, and Little Citation2015), (Josse, Pags, and Husson Citation2011); and that of (Audigier, Husson, and Josse Citation2016) that studied MI using PCA, and (Doove, Buuren, and Dusseldorp Citation2014) who proposed two MI procedures with recursive partitioning and PMM. These algorithms were first tested on our case study, to see if we could get them operationalized. In this section, we will restrict our investigations to those procedures which could be successfully implemented in our case study, without any computation issue or execution error. This left us with five algorithms from three different classes, that is, the work of (Zahid and Heumann Citation2019), that of (Josse, Pags, and Husson Citation2011), and (Audigier, Husson, and Josse Citation2016); and two algorithms presented in (Doove, Buuren, and Dusseldorp Citation2014). These five algorithms will be compared in the simulations described in Section 4 and in the case study analysis of Section 5.2 to a more canonical implementation of MICE that uses PMM (a.k.a. “MICEPMM”) in the imputation process (see supplementary materials for the technical details).
3.1 MI with Regularized Regression
Regularized regression models aim to reduce the complexity of the large pool of explanatory variables such that the sequential regressions in the imputation process become tractable. Penalized regression is a generalization of the ordinary least square regression (OLS) with the addition of penalty terms. The solution to the OLS problem is given by the minimization of the residual sum of squares (RSS):
(1)
(1) where
is the jth variable vector to be predicted,
is the predictor matrix for variable
, with
potentially including all variables in the matrix
but j,
is a
-dimensional vector of the estimated regression coefficients (where many of the coefficients will be 0) for
, λ1 and λ2 are the tuning parameters for the L1 and a L2 regularization terms for
. EquationEquation (1)
(1)
(1) is known as the elastic net regularization. It includes the ridge regression case when
and the LASSO when
(Tibshirani Citation1996). The quadratic penalty term makes the RSS function strongly convex (which therefore ensures a unique minimum) and controls for the multicollinearity in the data, whereas the LASSO penalty shrinks the low-valued regression coefficients to 0.
3.1.1 MI with Sequential Penalized Regression (MISPR)
Zahid and Heumann (Citation2019) devised a MI imputation algorithm using a ridge penalty in (1) (i.e., . The procedure can be used for any type of data, that is, continuous, binary and categorical. In short, the sequential regression imputation works as follow: the missing values in each
) are first filled in with some initial values, that is, mean imputation, nearest neighbors or random sampling from the observed values of
,
. For each variable
with missing values,
is regressed on
, and
are imputed using the draws from the corresponding posterior predictive distribution and subsequently updated in the original data matrix
. The procedure continues until all the variables are imputed. M replications of this procedure yields M imputed datasets. Algorithm 1 in the supplementary materials describes the imputation steps in case of continuous data (see the R package “mispr”, version 1.0.0) which will be denoted as “MISPR” in the following sections.
3.2 MI with Recursive Partitioning and Predictive Mean Matching
3.2.1 MICart
Classification And Regression Trees (CART) (Doove, Buuren, and Dusseldorp Citation2014) are machine learning algorithms that search for cut points among the predictors’ values that are subsequently used to split the data. The cut points are meant to construct homogeneous subsamples that can be used for prediction. The splitting process is repeated iteratively on each subsample, so that a series of splits defines a binary tree. The target variable can be discrete (classification tree) or continuous (regression tree) (van Buuren Citation2018). An automated procedure is often implemented to make this iterative step quite handy. CART methods are also quite robust against outliers, they can tackle multicollinearity and skewness in the data and they are also able to fit interactions and nonlinear relationships (Doove, Buuren, and Dusseldorp Citation2014), which makes them an attractive tool for imputation. Multiple imputation using CART methods has already been considered in the literature (Burgette and Reiter Citation2010; Doove, Buuren, and Dusseldorp Citation2014). In short, the missing values are initially imputed by random draws from the observed values on each related variable. For each variable with missing values a tree is fitted (on the observed elements
), using all the remaining variables as predictors. This results in a tree with several leaves, each containing a subset of the data. A member with a missing value on
(
) is put down this tree and ends up in one of the leaves. One value from the chosen leaf is randomly selected and used for imputation. A complete cycle along all incomplete variables is repeated several times, yielding one imputed dataset. Ultimately, this process is repeated M times, yielding M imputed datasets. In Algorithm 2 of the supplementary materials we summarized the implementation discussed by (Doove, Buuren, and Dusseldorp Citation2014) where the imputation is done by using PMM (see R package “mice”, version 3.14.0). For the upcoming discussions, this algorithm will be denoted as “MICart”.
3.2.2 MIForest
The CART algorithm may suffer from some downsides. For instance, the local optimization of the splits may not ensure the best possible tree with homogeneous sets. Further, the hierarchical dependence of the splits might create unstable trees which can lead to unreliable estimates. A solution is to adopt a random forest perspective, by creating multiple trees simultaneously, for example employing bootstrap methods that repeatedly create new datasets, by sampling from the observed data with replacement. By combining the results from the different trees, the chance of unstable results is minimized, guaranteeing a more reliable solution. The procedure is provided in Algorithm 3 of the supplementary materials (see R package “mice“) and will be denoted as “MIForest” in the remainder of this article.
3.3 MI with PCA
PCA is a well known method able to reduce the dimensionality of a N × P matrix . It provides a low rank
approximation of
in the least square sense by finding two matrices
and
, with
an N × K matrix and
a P × K matrix, that minimize the weighted residual error
(2)
(2) where
is an N × P indicator matrix that accounts for missing values in the dataset (Rij = 0 if Yij is missing and Rij = 1 otherwise, with
and
),
is a N × P matrix whose rows contain the P column means and “⊗” corresponds to the Hadamard (element-wise matrix) product. With the additional constraint of orthonormality for the columns of
and
, the solution of (2) is given by the score matrix
and the loading matrix
. The columns of
represent the row PCs of
and can be interpreted as a linear combination of the columns of
using the elements of
as weighting coefficients. The matrices
and
can be easily computed, in the complete case, through a SVD of the (mean) centered data for instance. The introduction of the matrix
in (2) is purposely due to tackle the main limitation of the PCA structure, that does not handle missing cells. In contrast to the complete case, there is no explicit solution to minimize (2) and therefore it is necessary to make use of iterative procedures like the iterative PCA algorithm (iPCA), which is summarized in Algorithm 4 of the supplementary materials.
3.3.1 MIPCABoot
Josse, Pags, and Husson (Citation2011) and Audigier, Husson, and Josse (Citation2016) relied on Algorithm 5 of the supplementary materials and extended the procedure to a MI scheme through a bootstrap resampling of the residuals in (2). The algorithm to generate multiply imputed datasets with a PCA model is composed of two parts. First, the missing values are imputed with an interactive single imputation algorithm using PCA (see the iPCA Algorithm 4 in the supplementary materials). Next PCA is performed on the complete data. The residuals of the PCA model are bootstrapped M times to generate new M complete data. A single PCA-based imputation algorithm is performed on each bootstrapped data. Algorithm 5 outlines the main steps of their procedure (see R package “missMDA“, version 1.14) which will be denoted as “MIPCABoot” in the following sections. A core and crucial feature of this MI procedure is the choice of the number of PCs to be retained in the PC model. If a small number of PCs is considered, relevant information might be neglected, whereas if more dimensions are retained, the risk of fitting the noise into the model increases, leading to potentially biased results and conclusions. For instance, the authors in (Josse and Husson Citation2012) proposed a generalized cross-validation (GAV) procedure that calculates (for each PCA model) the quantity
(3)
(3) where
is the total number of missing values in
. The value K that minimizes the function in (3) corresponds to the number of PCs to be retained before the imputation step.
3.3.2 MIPCABayes
Audigier, Husson, and Josse (Citation2016) worked on an adaptation of MIPCABoot using a Bayesian approach. The Bayesian treatment of the PCA model extended a previous proposal by (Verbanck, Josse, and Husson Citation2015) that exploited a ridge version of a PCA model that showed improved mean squared errors (MSEs) in the reconstruction of the original data. Three main steps are performed: first, missing values are imputed by a draw from the predictive distribution of the data. Next, a regularized PCA is performed on the full data matrix. The posterior distribution of the data given the reconstructed data
has an explicit form and depends on the regularized PCA. Finally, the missing data in
are updated by random draws from their posterior distribution. Algorithm 6 in the supplementary materials describes the procedure (see R package “missMDA“) which will be denoted as “MIPCABayes” in the remainder of this article.
4 Simulation Design
A simulation study was conducted in order to evaluate the performance of the MI approaches presented in Section 3. The simulation design aims at recreating the longitudinal study presented in Section 2 for a subset (i.e., 14) of the 29 original biomarkers, to ease the calculations and the Monte Carlo replications. To do so, the case study was analyzed per biomarker with a Linear Mixed Model (LMM) with random intercept and AR(1) correlated residuals for the repeated time assessments. Sex, type of diabetes and BMI were included in the model as baseline covariates. Time was included in the model as a continuous covariate, also in interaction with sex, diabetes and BMI. The correlation matrix between the Empirical Best Linear Unbiased Predictors (i.e., EBLUPs) of the random intercepts was computed to get an approximation of the baseline associations among the different biomarkers. The data generation model is
(4)
(4) where
is the average for biomarker
is the effect size of the baseline covariate xp for biomarker u,
is the effect size of time t for biomarker u,
is an interaction effect of variable xpi and time t on the response,
is a biomarker-specific random intercept, whereas
is the residual vector for biomarker u, with the matrix
being first order autoregressive with parameter
. The 14 random intercepts
are assumed to be correlated with correlation matrix
(see supplementary materials).
For the simulation of the baseline covariates, a Bernoulli (parameter ), a Gaussian (mean = 27, standard deviation = 4) and a uniform discrete distribution (with
) were used independently from each other to generate sex, BMI and type of diabetes (1, 2, and 3), respectively, whereas the variable time was included as nine consequent time units. A MAR missing mechanism was introduced through the following inverse logit model: we assumed that the biomarker data was complete at the first time point j = 1; for
, we considered
, with
(5)
(5) as the probability for unit i to miss the next follow-up j, with
denoting the level of biomarker “14” in our dataset for subject i at the previous time assessment j – 1. From univariate analyses conducted in (Samudrala et al. Citation2015), biomarker 14 was considered particularly sensitive to physical activity. We therefore based our missing mechanism on potentially (previously) abnormal levels of such biomarker. Next, a dropout pattern was included in this scheme, that is, when Rij = 1 all the biomarkers levels from time point j on will be considered as missing, ensuring a MAR missing mechanism. This way, about 40% average missingness in the biomarker levels was introduced in each simulated dataset, which constitutes quite a substantial missing rate. One-hundred and thirtyeight variables (
were generated for each of the 50 subjects, which create a relatively high-dimensional dataset. Five hundred datasets were simulated with this procedure in a Monte Carlo framework. In the supplementary materials the R code to generate the data is given. For MI with regularized regression and recursive partitioning, the imputation models for the variables with missing values included all the remaining variables, and thus also the other biomarker levels. In fact standard practice suggests that a proper imputation model should consider all variables that will be included in the analysis model, as well as all variables thought to be predictive of each imputed variable so as to make the MAR assumption more plausible (Schafer Citation1997). The tuning parameters of the algorithms (see supplementary materials) were fixed to the default settings specified in the R packages (van Buuren and Groothuis-Oudshoorn Citation2011; Zahid Citation2018). For MI with PCA, PCA was performed on the entire data matrix
. The number of PCs were selected according to (3). For MICEPMM the biomarkers were considered independent, that is, the set of predictors for the imputation of a missing biomarker level did not include any information on the other biomarkers (i.e., resolving the high-dimensionality issues for the standard MICE). Twenty imputations were performed for each MI method. The parameter estimates from the multiply imputed datasets were pooled by means of Rubin’s rule (Rubin Citation2004), as standard practice of all the three groups of imputation techniques (Shah et al. Citation2014; Audigier, Husson, and Josse Citation2016; Zahid, Faisal, and Heumann Citation2021): denoting with Q the quantity of interest and
, with
the set of parameter estimates
and standard errors Um from each of the imputed datasets, the overall combined parameter estimate is given by the sample average
and associated total variance
, where
is the within-imputation variance and the between-imputation variance (generated by the missing data) is calculated as
. The bias, the mean squared error (MSE), the Monte Carlo standard error (SE) of the point estimate and the coverage (i.e., the probability that the pooled parameter estimate after LMM analysis with imputation falls within the 95% confidence interval of the parameter estimate obtained from the LMM analysis with the complete simulated data) were used to express the degree of accuracy of the MI methods. The Bias and the MSE were calculated by comparing the pooled parameter estimates to those obtained by fitting (4) to the complete simulated data.
All the data generation and imputations were performed in the R 64bit software, version 3.4.2, and the statistical analyses were completed using the procedure MIXED of the statistical software SAS, version 9.4. The softwares were installed in an Intel Core-i7 6700HQ @2.60GHz machine with 24GB of RAM.
5 Results
5.1 Simulation Study
In we collected the CPU time for the completion of a pilot round of simulations (100 replications) to generate 10 imputed datasets. The two PCA-based approaches, MIPCABoot and MIPCABayes, outperformed by far the chained equation procedures in terms of processing time and remained relatively closed to MICEPMM which involved a simpler imputation strategy.
Table 1 Average processing time (hr) required by the MI algorithms to generate 10 imputations for 100 datasets.
We fitted (4) for each biomarker independently. We will denote the average for each biomarker as , representing the average of men with diabetes of type 2, the effect size for BMI as
, the effect size of females as
, the effect size of non-diabetes participants as
and that of people with type 1 diabetes with
, the linear time effect as
, the interactions with time as
for females, as
for non-diabetes participants, as
for type 1 diabetes.
Figures 1 to 9 in the supplementary materials display the bias, the MSE and the coverage of the nine fixed effect parameters. The parameter estimates of the imputed data for MIPCABayes are clearly showing the largest bias and MSE and the worst coverages. Based on these performances, results on the fixed effects from the imputed datasets with MIPCABayes will not be discussed further. The fixed effects parameter estimates of the LMM on the imputed datasets with the other MI methods show a relatively good absolute accuracy with very comparable biases among the MI methods. However, we did detect substantial differences in the MSEs and coverages of the parameter estimates on the imputed datasets of the four remaining MI methods. With respect to the MSE, we see that the parameter estimates of the LMM model on the imputed datasets with the MISPR method have a higher MSE for the coefficients of sex, BMI and time and also for the interaction terms with time, compared to the other three MI methods. The three methods (MIPCABoot, MICart and MIForest) show comparable MSEs for the same parameters. Parameter estimates on the MIForest imputed datasets show a higher MSE for the coefficients of diabetes compared to the other MI methods. When we study the coverages, we see that there are many parameters (for the different biomarkers) with coverages away from the nominal value of 0.95. MICEPMM showed very low coverages for the overall intercept . Generally, we see that the coverages appear to be more conservative for the main coefficients, whereas for the interaction effects the coverages are typically more liberal. For the interaction coefficient of diabetes type 1 and time,
, we see very liberal coverages for the imputed datasets with all four methods in almost all biomarkers. Furthermore, we note that the parameter estimates for the imputed dataset with MISPR have a lower coverage for the intercept and the coefficients BMI, time, and the two interactions with time compared to the other MI methods, which show very comparable coverages. For the coefficient of sex, only the parameter estimates on the imputed datasets with MISPR (and in few cases MICEPMM) show coverages close to 0.95, while the parameter estimates on the imputed datasets for the other three MI methods are highly conservative. However, the parameter estimates for the MISPR imputed datasets typically gives liberal coverages, except for the two coefficients of diabetes, where we see conservative coverages for all biomarkers. The coverages for the parameter estimates of the MICart and MIForest imputed datasets are very close to each others on all parameters, except for the two coefficients for diabetes, where the coverages of the parameter estimates are close to nominal only for the MIForest datasets. Parameter estimates on the MIPCA imputed datasets shows very similar coverages as the parameter estimates on the MICart imputed datasets, but with slightly better results on the coefficient for the interaction of sex and time. When looking at the empirical SE of the LMM point estimates after imputation we notice some systematic trends (not illustrated): MIForest and MICart always provide the lowest SE (they typically differ in the third decimal between each other) over MIPCABoot, MICEPMM, MIPCABayes and MISPR for the main effects whereas for the interaction terms MIPCABoot outperformed the imputation methods based on recursive partitioning and PMM, with the others maintaining the same hierarchy.
Fig. 1 Bias (a), mean squared error (b) and coverage (c) of the 6 MI algorithms for the random intercept variance component (simulated value range [0.09;0.30]) from (4). The black dashed line in panel (c) indicates the nominal coverage level, fixed at 0.95.
![Fig. 1 Bias (a), mean squared error (b) and coverage (c) of the 6 MI algorithms for the random intercept variance component σ12(u) (simulated value range [0.09;0.30]) from (4). The black dashed line in panel (c) indicates the nominal coverage level, fixed at 0.95.](/cms/asset/796a5133-ea0b-46d0-b0b4-e8ffe7ce8a31/utas_a_2259962_f0001_c.jpg)
display the bias, the MSE and the coverage of the estimates for the three variance-covariance parameters of the 14 biomarkers profiles from the simulated model (4), that is, the subject-specific random intercept (), the residual variance (
) and the AR(1) parameter (
) of the residual covariance matrix (
). When we investigate the parameter estimates for the variance component of the random intercept, we see a large positive bias of the estimates on the MIPCABayes imputed datasets and a somewhat negative bias on the MIPCABoot and MICEPMM imputed datasets. This has a direct negative influence on the size of the MSE and the low coverage probabilities. The coverages for the parameter estimates on the datasets of the other three MI methods are mostly liberal, with somewhat worse coverages in general on the datasets imputed with the MISPR method. For the residual variance, we see large positive biases on the imputed datasets of both the MIPCABayes and the MISPR methods. Interestingly, here the best coverages are attained on the datasets of the MIPCABoot method. For the autoregressive parameter we see that the biases on the imputed datasets with MICart, MIForest, and MIPCABayes are very comparable and are also the smallest among all MI methods. When we investigate the coverages of the LMM autoregressive parameters, we see that the best results are obtained in the imputed datasets with MICart and MIForest, but for several biomarkers we still have very liberal coverages. As for the empirical SE (not shown), LMM analyses on the MIForest and MICart imputed datasets provide the lowest SE of the point estimates for the random intercept and the residual variance over MIPCABoot, MICEPMM; whereas for the AR(1) parameter they are outperformed by MIPCABoot whose SEs are the lowest over the other methods. As for MISPR and MIPCABayes, they systematically present the largest SEs of the point estimates after imputation, with MIPCABayes showing the largest values for the random intercept and the AR(1) parameters, whereas for the residual variance MISPR presents much larger SEs than those obtained with MIPCABayes and the other imputation approaches.
Fig. 2 Bias (a), mean squared error (b) and coverage (c) of the 6 MI algorithms for the residual variance component (simulated value range [0.58;2.07]) from (4) per biomarker. The black dashed line in panel (c) indicates the nominal coverage level, fixed at 0.95.
![Fig. 2 Bias (a), mean squared error (b) and coverage (c) of the 6 MI algorithms for the residual variance component σe2(u) (simulated value range [0.58;2.07]) from (4) per biomarker. The black dashed line in panel (c) indicates the nominal coverage level, fixed at 0.95.](/cms/asset/b88c770e-b74a-4772-8660-0dd11876cca6/utas_a_2259962_f0002_c.jpg)
Fig. 3 Bias (a), mean squared error (b) and coverage (c) of the 6 MI algorithms for the residual correlation (simulated value range [–0.35;0.52]) from (4) per biomarker. The black dashed line in panel (c) indicates the nominal coverage level, fixed at 0.95.
![Fig. 3 Bias (a), mean squared error (b) and coverage (c) of the 6 MI algorithms for the residual correlation ρ(u) (simulated value range [–0.35;0.52]) from (4) per biomarker. The black dashed line in panel (c) indicates the nominal coverage level, fixed at 0.95.](/cms/asset/62da023b-cb96-4a4f-a223-ea9341f75bf2/utas_a_2259962_f0003_c.jpg)
5.2 Analysis of the Vier Daage dataset
In order to do inference on the biomarker trajectories for the different subjects, we first need to carry out MI properly. In this section, we consider for illustrative purposes, two imputation algorithms from two different classes, MIForest and MIPCABoot (here simply denoted as “MIPCA”), (see Section 3). From the simulations, these methods showed comparable to better performances than the other methods in high-dimensional settings. We also considered as benchmarks (a) MICE with PMM, denoted as “MICEPMM” (Little Citation1988), performing MI on each biomarker separately, (i.e., for each missing biomarker level at one time point PMM creates a set of subjects that have the information of that specific biomarker available; because we had “unit missing” in this dataset, we could not borrow information from other biomarkers at one time point because all biomarker information was missing), and (b) full information maximum likelihood (denoted as “FIML”), allowing to get parameter estimates without imputing the missing data. Note that the comparison with FIML could not be performed in the simulation study as the high missing response rate (i.e., low percentage of subjects with fully observed data) caused convergence issues for the majority of the LMM univariate analyses, that is, it was not possible to estimate the variance components.
We performed M = 10 imputations for each method. A relative efficiency (calculated as , with λ the fraction of missing information in the original data) (Rubin Citation2004) higher than 0.96 for all the imputed variables indicated that the number of imputations was big enough to ensure good statistical inference (Newgard and Haukoos Citation2007). For each of the 10 imputed datasets, a LMM with sex, age, diabetes (0 = healthy, 1 = type1, 2 = type2), BMI and distance covered as fixed covariates, a random intercept and AR(1) correlated residuals as variance components was fitted for each biomarker separately.
In we reported the point and standard error estimates as well as the t-test p-values (p-vals) for two fixed effect parameters of the LMM, that is, the intercept and the BMI effect size
. The BMI point estimates obtained by FIML were systematically lower than the ones obtained from the other approaches. The FIML standard errors are consistently higher than the estimates obtained from the other approaches for both fixed effects. The intercept was found to be significant for all biomarkers in the LMM after the three imputation methods, except for the PMM imputation in biomarker 10, but in few (10/29) biomarkers (i.e., 1, 2, 5, 6, 10, 12, 16, 17, 20, 22) substantial differences in the p-vals were observed among the four imputation strategies. In 14 biomarkers, the LMM after the three imputation methods showed mismatches in the significance of the BMI effect size (with the most significant ones observed in biomarkers 7, 11, and 18). For the other covariates, we could observe very minor and subtle differences, thus the p-vals were not displayed. Overall, LMM analyses of the fixed effects parameters after MIPCABoot imputation resulted more frequently in more liberal (higher) p-vals than the LMM results after PMM and MIForest imputation. Exceptionally, in biomarkers 2, 4, 8, 18, 26, and 27 for the intercept
and in biomarkers 2, 8, 12, and 22 for the BMI parameter
, the LMM results after PMM and MIForest showed higher p-vals compared to MIPCABoot.
Fig. 4 Average point (a) and standard error (b) estimates and t-test p-val’s (c) (over 10 imputations) of the intercept fixed effect for FIML and the imputation algorithms MICEPMM, MIPCA, and MIForest applied to the case study. The black dashed line in panel (c) indicates the significance level, fixed at 0.05.
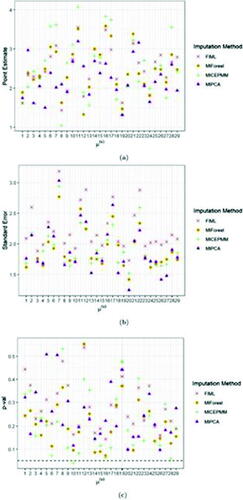
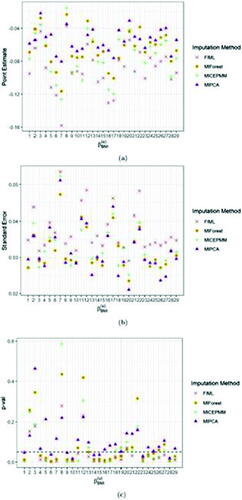
Fig. 5 Average point (a) and standard error (b) estimates and t-test p-val’s (c) (over 10 imputations) of the fixed effect for BMI for FIML and the imputation algorithms MICEPMM, MIPCA, and MIForest applied to the case study. The black dashed line in panel (c) indicates the significance level, fixed at 0.05.
display the pooled estimates and the standard errors of the two variance components for the different biomarkers, that is, the random intercept and the AR(1) residual correlation parameter
. For the residual variance
we could not find relevant differences in the LMM results after the three MI methods (see supplementary materials), but overall the LMM analyses after PMM imputation resulted most often in higher p-vals. For the random intercept
and the AR(1) residual correlation parameter
substantial differences were observed. FIML provided parameter estimates of larger size. The LMM after univariate PMM imputation could not estimate the random intercept for biomarkers 2 and 4, whereas for MIPCABoot the LMM could not estimate the random intercept for biomarkers 2 and 21, and MIForest could not estimate the random intercept for biomarker 21. They were set to 0 in , as well as the standard errors. MIPCA produced higher estimates of the random intercept
compared to the other methods, except for biomarkers 2, 8, 12, 18, 22, and 27. The standard errors of FIML are systematically larger than the parameters estimates obtained after imputations for the random intercept
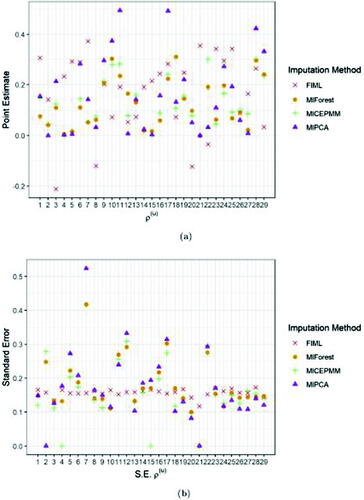
whereas for the correlation parameter
they remain of moderate size compared to the other imputation approaches. MIForest showed more frequently estimates the correlation parameter
closer to 0, whereas MIPCABoot tends to produce larger values of this parameter in (absolute value), except for biomarkers 4, 8, 10, 11, 24, 25, 27, and 28.
Fig. 6 Average point (a) and standard error (b) estimates (over 10 imputations) of the random intercept for FIML and the imputation algorithms MICEPMM, MIPCA, and MIForest applied to the case study.
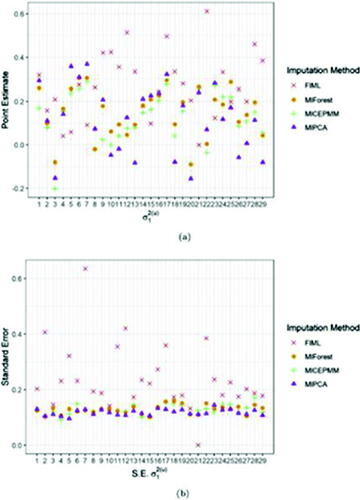
Fig. 7 Average point (a) and standard error (b) estimates (over 10 imputations) of the residual correlation for FIML and the imputation algorithms MICEPMM, MIPCA, and MIForest applied to the case study.
Overall, the analyses showed how the different imputation approaches could bring different conclusions in terms of significance of the fixed effects or in terms of size and standard errors of the variance components. The heterogeneity of the results became even larger when considering the FIML approach, which has been included as a benchmark technique in this section only for illustrative purposes, but its overall performances should be considered out of scope from the investigations conducted in this article. Looking at the three imputation approaches considered in this section and based on the results of the simulation study we consider MIForest and MIPCABoot most trustworthy, whereas the univariate PMM may be less reliable. In this latter case, each biomarker level is imputed independently from the others (i.e., all the other biomarker levels were not considered as auxiliary variables in the imputation model), but this approach could lead to a MNAR setting, if the missingness of one biomarker depended on other biomarkers’ levels, as they were left out of the analysis model.
6 Discussion and Conclusions
In this article, we have addressed the controversial problem of MI in high-dimensional settings. Despite the rich discussions in literature on the superiority of specific MI algorithms through, often not realistic, comparative simulation studies, no special attention has been given to MI methods for high-dimensional data with a detailed investigation of their performances. The work presented in this article aims to fill this gap through an evaluation of the current MI approaches available in literature that are suited and/or have already been applied in high-dimensional data, with an extensive simulation study which mimicked the longitudinal and high-dimensional structure of our case study. In this article, we focused our attention on handling missing data with MI in the context of linear mixed-effects modeling, applied both to real and synthetic longitudinal settings, and thus our conclusions apply to this particular framework. For further evaluations of missing value imputation in other high-dimensional research fields, see Liao et al. (Citation2014) and Chandrasekher, Alaoui, and Montanari (Citation2020).
Our literature review identified five algorithms, which were employed in previous high-dimensional studies. Other methods have recently been proposed, and they seemingly showed great potential also in high-dimensional data. Purely by way of example we mention the proposal of (Howard, Rhemtulla, and Little Citation2015), where principal component (PC) scores are used as predictor variables in a MICE scheme, or the SuperMICE algorithm of (Laqueur, Shev, and Kagawa Citation2022), where a combination of learner algorithms are used as predictive models in MICE. It would be interesting to evaluate in the near future these new proposals in a high-dimensional context.
The majority of the available MI algorithms in literature failed when applied to high-dimensional data, because of the incapability of dealing with the large predictor matrix. This is the case for example of the R packages “GAMLSS”, “Midatouch”, “sbart”, “Amelia”, “Hmisch”, and “Raoul”. Surprisingly, also some of the MI algorithms that were developed for high-dimensional data showed computational issues, such as the algorithm of (Deng et al. Citation2016) and (Lang Citation2015) (from the R package “MIBRR”, version 0.3.0.9000). These approaches appeared to be computationally burdensome and became practically infeasible with increasing number of variables with missing data. Moreover, any of the MICE adaptations considered in the R package “mice” to control multicollinearity and high dimensionality couldn’t cope with the singularity of the predictor matrix of the MICE regression equations. Overall, the computational burden constituted a big limitation of the study presented in this article, which limited the investigations from moderate to fairly high-dimensional settings. Thus, we cannot say whether our results generalize also to ultra high-dimensional settings (i.e., large large N), because we could not verify systematically the performances of the methods due to the limited computing power.
Our simulations demonstrated that MI is possible in high-dimensional data for the considered methods, that is, MISPR, MIPCABoot MIPCABayes, MICart and MIForest, but the MI imputation methods need to be improved further in the near future. Although the more traditional MICEPMM technique appeared to be computationally less expensive, it was in most cases outperformed by the other imputation methods in the simulations. Our simulation study also showed that MIPCABayes is not recommended, since the fixed effects parameter estimates of the LMM were estimated with a substantial bias, despite the number of principal components retained in the analysis. Noticeably, initial investigations showed that the performances of this imputation method largely improved in more traditional settings (see supplementary materials for a selection of parameter estimates in two explorative
and P = 130 simulation settings). The parameter estimates on the imputed datasets of the other 4 imputation methods showed biases that appeared small in absolute sense. However, the variance components were seemingly more difficult to estimate in the imputed datasets and this also affected the coverages of all the estimates. Based on the simulation study, we also do not recommend MISPR of (Zahid and Heumann Citation2019; Zahid, Faisal, and Heumann Citation2021), because it is computationally intensive and less efficient than the recursive partitioning algorithms with PMM (i.e., MICart and MIForest) which demonstrated better performances than MISPR (generally smaller bias and MSE and higher coverages). The results of the fixed effects on the imputed datasets with the two recursive partitioning algorithms with PMM were very similar to the results on the imputed datasets with MIPCABoot, but the recursive partitioning algorithms with PMM provided better estimation results for the variance components. This might be to their ability to easily handle interactions, non-linearities (Doove, Buuren, and Dusseldorp Citation2014) in big data settings, and to avoid overfitting. However, this often comes at the expenses of a much higher computational cost. In fact, we have seen that for the high-dimensional settings explored in our research, the computational speed of such algorithms is very slow and might therefore play a decisive role when massive data analyses must be performed or, even worse, replicated multiple times. Thus, practically speaking, the researchers might not be able to use such methods because of the unfeasible computational times. The actual state of art suggests to consider much faster methodologies like the one relying on PCA, that is, MIPCABoot.
Interestingly, additional investigations (not shown) suggest that increasing the sample size (up to a size P, in setting) slightly improves the precision of the LMM estimates, although it comes at the expenses of a much higher computational burden. This applies in general to all imputation algorithms considered in this study. For this last evaluation however, we were forced to exclude MISPR due to the much higher computational cost when we increased the sample size to N = 130.
Finally, we considered different strategies for MI in our case study. We could identify some differences among the adopted MI approaches, but others might still remain uncovered. An explanation can be found in the missing data structure of our case study: missing data arose when the patient missed a particular assessment, which consequently meant that all the biomarkers levels could not be measured at that time point. This missing data structure undermines the power of missing data algorithms which consider also high-dimensional and possibly multivariate structures in the data. Anyhow, our motivating example shows that different imputation strategies could be adopted in this particular case, as it happens also in many longitudinal studies, where ad-hoc MI strategies can circumvent the curse of dimensionality. On the one hand, the missing information in a biomarker at a specific time point can be borrowed within each person using other records of the biomarker or exploiting the information available that other persons share for the same biomarker at that time point. On the other hand, we could exploit all the information shared by different biomarkers at one time point, within or between subjects. The first two strategies consist merely in a univariate approach which would practically resolve the high-dimensional issue and allow standard MI univariate procedures (i.e., standard MICE), but probably at the cost of some loss of information and underestimation of significant effects (as demonstrated in Section 5.2). On the contrary, the second approach would emphasize the multivariate structure of the data, at the expenses of a significant data augmentation in the imputation phase which restricts the range of the possible MI approaches to the ones illustrated in Section 3. The full understanding and the exploration of the impact that different MI techniques might have in these longitudinal settings definitely deserves more focus in future research.
Supplementary Material.zip
Download Zip (5.2 MB)Acknowledgments
The authors would like to thank the two reviewers, the editor and associate editors for their insightful comments and suggestions for the improvement of the paper.
Supplementary Materials
In the supplement, further details for the MI algorithms of Section 3 as well as codes for their operationalization in the R software are provided. The simulation parameter settings and codes are also given. Finally, additional plots for the simulation and case study analysis are shown.
Disclosure Statement
No potential conflict of interest was reported by the author(s).
Data availability statement
Data for the case study is available upon request to Edwin R. van den Heuvel ([email protected]).
References
- Audigier, V., Husson, F., and Josse, J. (2016), “Multiple Imputation for Continuous Variables Using a Bayesian Principal Component Analysis,” Journal of Statistical Computation and Simulation, 86, 2140–2156. DOI: 10.1080/00949655.2015.1104683.
- Bras, L. P., and Menezes, J. C. (2006), “Dealing with Gene Expression Missing Data,” IEE Proceedings-Systems Biology, 153, 105–119. DOI: 10.1049/ip-syb:20050056.
- Burgette, L. F., and Reiter, J. P. (2010), “Multiple Imputation for Missing Data via Sequential Regression Trees,” American Journal of Epidemiology, 172, 1070–1076. DOI: 10.1093/aje/kwq260.
- Chandrasekher, K. A., Alaoui, A. E., and Montanari, A. (2020), “Imputation for High-Dimensional Linear Regression,” https://arxiv.org/abs/2001.09180.
- Degenhardt, F., Seifert, S., and Szymczak, S. (2017), “Evaluation of Variable Selection Methods for Random Forests and Omics Data Sets,” Briefings in Bioinformatics, 20, 492–503. DOI: 10.1093/bib/bbx124.
- Deng, Y., Chang, C., Seyoum Ido, M., and Long, Q. (2016), “Multiple Imputation for General Missing Data Patterns in the Presence of High-Dimensional Data,” Scientific Reports, 6, 21689. DOI: 10.1038/srep21689.
- Doove, L. L., Van Buuren, S., and Dusseldorp, E. (2014), “Recursive Partitioning for Missing Data Imputation in the Presence of Interaction Effects,” Computational Statistics & Data Analysis, 72, 92–104. DOI: 10.1016/j.csda.2013.10.025.
- Dray, S., and Josse, J. (2015), “Principal Component Analysis with Missing Values: A Comparative Survey of Methods,” Plant Ecology, 216, 657–667. DOI: 10.1007/s11258-014-0406-z.
- Engel, J., Buydens, L., and Blanchet, L. (2017), “An Overview of Large-Dimensional Covariance and Precision Matrix Estimators with Applications in Chemometrics,” Journal of Chemometrics, 31, e2880. DOI: 10.1002/cem.2880.
- Hamid, Z., Zimmerman, K. D., Guillen-Ahlers, H., Li, C., Nathanielsz, P., Cox, L. A., and Olivier, M. (2021), “Assessment of Label-Free Quantification and Missing Value Imputation for Proteomics in Non-human Primates,” bioRxiv. http://biorxiv.org/content/early/2021/07/31/2021.07.30.454221.abstract.
- Honaker, J., King, G., and Blackwell, M. (2015), “Package “amelia ii”,” Journal of Statistical Software, 45, 1–54. DOI: 10.18637/jss.v045.i07.
- Howard, W. J., Rhemtulla, M., and Little, T. D. (2015), “Using Principal Components as Auxiliary Variables in Missing Data Estimation,” Multivariate Behavioural Research, 3, 285–299. DOI: 10.1080/00273171.2014.999267.
- Josse, J., and Husson, F. (2012), “Selecting the Number of Components in Pincipal Component Analysis Using Cross-Validation Approximations,” Computational Statistics & Data Analysis, 56, 1869–1879. http://www.sciencedirect.com/science/article/pii/S0167947311004099. DOI: 10.1016/j.csda.2011.11.012.
- Josse, J., and Husson, F. (2016), “missmda: A Package for Handling Missing Values in Multivariate Data Analysis,” Journal of Statistical Software, 70, 1–31. DOI: 10.18637/jss.v070.i01.
- Josse, J., Pags, J., and Husson, F. (2011), “Multiple Imputation in Principal Component Analysis,” Advances in Data Analysis and Classification, 5, 231–246. DOI: 10.1007/s11634-011-0086-7.
- Kucheryavskiy, S. (2020), “mdatools - r Package for Chemometrics,” Chemometrics and Intelligent Laboratory Systems, 198, 103937. https://www.sciencedirect.com/science/article/pii/S0169743919305672. DOI: 10.1016/j.chemolab.2020.103937.
- Lang, K. M. (2015), “Miben: Robust Multiple Imputation with the Bayesian Elastic-Net.”
- Lang, K. M. (2019), Mibrr: Multiple Imputation with Bayesian Regularized Regression. R package version 0.3.0.9000. Available at http://github.com/kylelang/MIBRR
- Laqueur, H. S., Shev, A. B., and Kagawa, R. M. C. (2022), “Supermice: An Ensemble Machine Learning Approach to Multiple Imputation by Chained Equations,” American Journal of Epidemiology, 191, 516–525. DOI: 10.1093/aje/kwab271.
- Ledoit, O., and Wolf, M. (2004), “A Well-Conditioned Estimator for Large-Dimensional Covariance Matrices,” Journal of Multivariate Analysis, 88, 365–411. DOI: 10.1016/S0047-259X(03)00096-4.
- Li, Q., and Lin, N. (2010), “The Bayesian Elastic Net,” Bayesian Analysis, 5, 151–170. DOI: 10.1214/10-BA506.
- Liao, S. G., Lin, Y., Kang, D. D., Chandra, D., Bon, J., Kaminski, N., Sciurba, F. C., and Tseng, G. C. (2014), “Missing Value Imputation in High-Dimensional Phenomic Data: Imputable or Not, and How?” BMC Bioinformatics, 15, 346. DOI: 10.1186/s12859-014-0346-6.
- Little, R. J. A. (1988), “Missing Data Adjustments in Large Surveys,” Journal of Business & Economic Statistics, 6, 287–296. DOI: 10.2307/1391878.
- Matrov, D., Imbeault, S., Kanarik, M., Shkolnaya, M., Schikorra, P., Miljan, R., Shimmo, E., and Harro, J. (2020), “Comprehensive Mapping of Cytochrome c Oxidase Activity in the Rat Brain After Sub-Chronic Ketamine Administration,” Acta Histochemica, 122, 151531. DOI: 10.1016/j.acthis.2020.151531.
- Molenberghs, G., and Verbeke, G. (2005), “Models for Discrete Longitudinal Data,” in Springer Series in Statistics, Diepenbeek and Leuven: Springer.
- Newgard, C. D., and Haukoos, J. S. (2007), “Advanced Statistics: Missing Data in Clinical Research - Part 2: Multiple Imputation,” Academic Emergency Medicine, 14, 669–678. DOI: 10.1197/j.aem.2006.11.038.
- Rubin, D. B. (2004), Multiple Imputation for Nonresponse in Surveys (Vol. 81), Hoboken, NJ: Wiley.
- Samudrala, D., Geurts, B., Brown, P. A., Szymaska, E., Mandon, J., Jansen, J., Buydens, L., Harren, F. J. M., and Cristescu, S. M. (2015), “Changes in Urine Headspace Composition as an Effect of Strenuous Walking,” Metabolomics, 11, 1656–1666. DOI: 10.1007/s11306-015-0813-8.
- Schafer, J. L. (1997), Analysis of Incomplete Multivariate Data, London: Chapman and Hall.
- Schafer, J. L., and Graham, J. (2002), “Missing Data: Our View of the State of the Art,” Psychological Methods 2, 147–177. DOI: 10.1037/1082-989X.7.2.147.
- Shah, A. D., Bartlett, J. W., Carpenter, J., Nicholas, O., and Hemingway, H. (2014), “Comparison of Random Forest and Parametric Imputation Models for Imputing Missing Data Using MICE: A Caliber Study,” American Journal of Epidemiology, 179, 764–774. DOI: 10.1093/aje/kwt312.
- Soroushmehr, R. S. M., and Najarian, K. (2016), “Transforming Big Data into Computational Models for Personalized Medicine and Health Care,” Dialogues in Clinical Neuroscience, 18, 339–343. https://europepmc.org/articles/PMC5067150. DOI: 10.31887/DCNS.2016.18.3/ssoroushmehr.
- Tibshirani, R. (1996), “Regression Shrinkage and Selection via the Lasso,” Journal of the Royal Statistical Society, Series B, 58, 267–288. http://www.jstor.org/stable/2346178. DOI: 10.1111/j.2517-6161.1996.tb02080.x.
- van Buuren, S. (2018), Flexible Imputation of Missing Sata (2nd ed.), Boca Raton, FL: CRC Press.
- van Buuren, S., and Groothuis-Oudshoorn, K. (2011), “mice: Multivariate Imputation by Chained Equations in R,” Journal of Statistical Software, 45, 1–67. DOI: 10.18637/jss.v045.i03.
- Verbanck, M., Josse, J., and Husson, F. (2015), “Regularised PCA to Denoise and Visualise Data,” Statistics and Computing, 25, 471–486. DOI: 10.1007/s11222-013-9444-y.
- Voillet, V., Besse, P., Liaubet, L., San Cristobal, M., and González, I. (2016), “Handling Missing Rows in Multi-Omics Data Integration: Multiple Imputation in Multiple Factor Analysis Framework,” BMC Bioinformatics, 17, 402. DOI: 10.1186/s12859-016-1273-5.
- Wold, H. (1966), “Estimation of Principal Components and Related Models by Iterative Least Squares,” in Multivariate Analysis, ed. P. R. Krishnajah, pp. 391–420, New York: Academic Press.
- Wold, S., Esbensen, K., and Geladi, P. (1987), “Principal Component Analysis,” Chemometrics and Intelligent Laboratory Systems, 2, 37–52. ISSN 0169-7439. http://www.sciencedirect.com/science/article/pii/0169743987800849. Proceedings of the Multivariate Statistical Workshop for Geologists and Geochemists. DOI: 10.1016/0169-7439(87)80084-9.
- Zahid, F. M. (2018), mispr: Multiple Imputation with Sequential Penalized Regression. R package version 1.0.0. vailable at https://cran.r-project.org/package=mispr
- Zahid, F. M., and Heumann, C. (2019), “Multiple Imputation with Sequential Penalized Regression,” Statistical Methods in Medical Research, 28, 1311–1327. DOI: 10.1177/0962280218755574.
- Zahid, F. M., Faisal, S., and Heumann, C. (2021), “Multiple Imputation with Compatibility for High-Dimensional Data,” PloS One, 16, e0254112. DOI: 10.1371/journal.pone.0254112.
- Zhao, Y., and Long, Q. (2016), “Multiple Imputation in the Presence of High-Dimensional Data,” Statistical Methods in Medical Research, 25, 2021–2035. DOI: 10.1177/0962280213511027.
- Zou, H. (2006), “The Adaptive Lasso and its Oracle Properties,” Journal of the American Statistical Association, 101, 1418–1429. DOI: 10.1198/016214506000000735.
- Zou, H., and Hastie, T. (2012), elasticnet: Elastic-Net for Sparse Estimation and Sparse PCA, R package version 1.1. Available at https://cran.r-project.org/package=elasticnet