
Abstract
The post-Covid-19 global economic landscape has yielded complex challenges. Given bleaker global growth prospects, moderating commodity prices and a higher cost of borrowing, the Indonesian government took a conservative approach to fiscal policy by narrowing the budget deficit to ease the financing pressures. Meanwhile, the central bank, Bank Indonesia, implemented contractionary monetary policy by raising the reserve requirement and policy rates. Weaker global demand, along with limited policy support, contributed to a decrease in economic growth, from 5.3% in 2022 to 5.0% in 2023. The government’s conservative approach in 2023 helped produce a surplus in the primary balance, a narrower budget deficit and a lower government–debt ratio. Nonetheless, much is to be done, as more development is needed to encourage long-term growth while revenue collection has been relatively low. Improvement in tax policy and administration will be crucial to allow the government to collect more revenue, including a comprehensive review of tax incentives and exemptions. The efficacy of spending also needs to be further improved by consistently reforming energy subsidisation, reallocating spending to growth areas, better aligning local development policies with the national position, and better targeting poverty-alleviation programs.
INTRODUCTION
The Covid-19 pandemic hurt the global economy, leaving a landscape of complex challenges. Supply chain disruptions worsened by the War in Ukraine have led to persistently high inflation followed by aggressive and longer-than-expected tightening of monetary policy worldwide. Fiscal policy pressures have increased as governments increase their debt in response to the pandemic, and global geopolitical tension has escalated as the global economy becomes more fragmented. As a result, global economic growth slowed following weaker trade and investment activities.
As an open economy, Indonesia has not been immune to the economic shock dealt by the pandemic. After growing at a rate of 5.3% in 2022, the country’s economic growth decreased to 5.0% in 2023 amid lower global growth (Anas et al. Citation2022; Lewis Citation2023; Patunru Citation2023). Exports contracted in the second half of 2023 following weaker global demand and a downward trend in commodity prices. Domestic demand continued to support growth owing to a modest inflation rate and job creation, while weaker global demand has contributed to a deficit in the current account balance of 0.1% of GDP.
Fiscally, the government attributes improvement in the state budget to its cautious policy approach. Instead of contracting, as was initially projected, total revenue grew by 5.3% in 2023 compared to 2022 (12.6% above the target). Tax collection was about 6.6% above the initial target. Although the outturn of government spending was 2.0% more than the initial target, the budget deficit stood at 1.65% of GDP in 2023, compared to 2.35% in 2022. The primary balance produced a surplus of 0.4% of GDP (the first surplus since 2012).
Nevertheless, much is yet to be done as pressing fiscal challenges remain while development needs increase, especially as the nation strives to become a highincome country by 2045. On the revenue side, the relatively low tax ratio has constrained the government’s pursuit of a more expansionary fiscal policy to grow the economy at a rate of above 5.0% annually (Resosudarmo and Abdurohman 2018). This low tax ratio has been a major factor in the government’s low expenditure. According to the IMF Fiscal Monitor October 2023, general government expenditure in Indonesia hovered at around 17% of GDP, far below its emerging peers in the G20, such as India (28%), Brazil (48%), Turkey (28%) and South Africa (33%) (IMF 2023a).
Given the relatively limited fiscal space, regulatory constraints on fiscal policy changes and the minimum budget allocation set for education, the government has pursued infrastructure development through ‘below-the-line spending’.Footnote1 Imprudent management and the financial infeasibility of some projects have put significant pressure on some state-owned enterprises (SOEs). This has created contingent budget liabilities for the government, which has to bail out the SOEs. Another critical challenge facing Indonesia’s fiscal policy is the country’s longpoliticised energy subsidisation. While energy subsidies are widely acknowledged as ineffective and distortive, transforming an energy subsidy such as Indonesia’s into a well-targeted social assistance program is difficult, politically and practically.
This article delves into Indonesia’s fiscal policy and economic dynamics in the aftermath of the pandemic, highlighting some of the government’s key fiscal responses during 2022–23. The article begins by describing the post-pandemic global economy, including the dynamics of change in the global economic landscape. Shifting the lens to domestic affairs, the Survey then analyses Indonesia’s economic performance, in terms of growth, inflation, the external sector and the banking and financial sector, as well as the progress of welfare indicators. Several macroeconomic policy mix responses are also discussed to unravel Indonesia’s non-conventional approach to navigating the post-pandemic economic challenges. The final section will focus on examining the impact of social expenditure on citizens’ well-being and poverty alleviation, along with an analysis of Indonesia’s fiscal policy trajectory for 2024 and the impending fiscal challenges.
RECENT ECONOMIC DEVELOPMENTS
Post-Covid-19 Pandemic Global Economic Turbulence
In the aftermath of the Covid-19 pandemic, high interest rates and geopolitical tension have typified the global economic landscape. Supply chain disruptions during the pandemic ignited high inflationary pressures in many countries, prompting aggressive policy rate hikes, especially in advanced economies such as the United States and Europe (IMF 2022). Since the beginning of 2022, the US Federal Reserve has raised its benchmark interest rate by 525 basis points, while the European Central Bank has increased its rate by 450 basis points. The aggressive monetary tightening has affected emerging markets, triggering a financial market rout, capital flow reversals and rising costs of funds (World Bank Citation2023).
Although global inflation began to ease in 2023, policy rates in advanced economies such as the United States and Europe are expected to remain high for longer (IMF 2023d). Financial markets, particularly in emerging economies, were turbulent throughout 2023. Capital outflows increased, putting considerable pressure on local currencies, which added significant fiscal pressure as the cost of borrowing increased and debt grew in many countries (IMF 2024).
Tighter global liquidity conditions were accompanied by elevated geopolitical tension, increasing the downside risks to the global economy. The War in Ukraine, followed by conflicts in the Middle East, has further strained international relations and the global supply chain. In addition, since mid-December 2023, trade in the Red Sea has been disrupted by Houthi attacks on commercial vessels, triggering increased tensions between proxy groups. As a result, Red Sea trade routes were diverted via the Cape of Good Hope, South Africa, increasing the cost of shipping (Economist 2024). Heightened geopolitical tension has also increased protectionism and cross-border restrictions in several countries. In response to the geopolitical tension, many countries have been reconfiguring their supply chains towards onshoring (the relocation of production facilities to domestic shores) and ‘friendshoring’ (building closer economic ties with trusted allies). Data from Global Trade Alert show a nearly threefold increase in trade restrictions between 2019 and 2022 (Bolhuis, Chen and Kett Citation2023). As a result, global goods and capital flows are levelling off, continuing the trend observable after the global financial crisis (World Bank Citation2024).
The intertwining of technology, the economy and national security, commonly referred to as techno-nationalism, has also increased and has become a defining force shaping the global economy. Nations have been vying for supremacy in critical sectors, leading to the bifurcation of technological ecosystems and standards. For example, the rivalry in technology between major powers, notably the United States and China, commonly referred to as the ‘Tech Cold War’, has led to policies emphasising domestic innovation, export controls and restrictions on technology transfer. Countries have been striving for self-sufficiency in semiconductor production and engaging in a race for semiconductor supremacy, often referred to as the ‘chip war’, which has been reshaping the global technology industry (Miller Citation2022). Resource nationalism has also been gaining traction as countries seek to secure control over critical minerals, essential for advanced technologies, green energy and various industrial policies.
The combination of tighter monetary policy in many countries and rising geopolitical tension has adversely affected global economic activity. The global economy in 2023 was expected to slow to 3.0% from 3.5% in 2022 (IMF 2023d) and remain uneven across regions. The US economy has shown resilience, growing relatively well throughout 2023, supported by strong domestic consumption fuelled by excess savings accumulated during the pandemic, as well as industrial policies such as the US Inflation Reduction Act and US CHIPS and Science Act (IMF 2023c).
The Eurozone, in contrast, stagnated in 2023 owing to persistently high inflation despite high policy rates (Weber Citation2024). China, Indonesia’s largest trading partner, also experienced a weaker-than-expected economic recovery (Tan, Kawase and Li 2023). In addition to weakening global demand, China’s economy has been beset by protracted problems in the property sector, marked by the collapse of Evergrande Group and Country Garden, two of the largest property developers in China (Financial Times 2023a). In addition, China has been facing structural constraints, such as high local government debt, an ageing population, and slower productivity growth (CRS 2023).
Overall, commodity prices moderated in 2023 amid reduced global economic activity, a warmer-than-expected winter and a global reallocation of commodity trade flows. The risk of soaring commodity prices remains high, given the likelihood of further disruptions to the global supply chain (in part due to trade restrictions), intensifying geopolitical tensions and adverse weather events due to climate change. For example, rice prices reached their highest level in over a decade, with an FAO All Rice Price Index value of 141.1 points in December 2023, owing to lower productivity caused by the El Niño weather pattern (FAO 2023). As a result, some major rice exporting countries focused on their domestic markets—notably India, responsible for more than 40% of the global rice trade, banned exports of rice to maintain stable food prices in its domestic market (Financial Times 2023b).
Indonesia’s 2023 Economic Performance
Economic Growth
Amid external headwinds, Indonesia’s economy grew at a rate of 5.05% in 2023, marginally down from 5.30% in 2022. summarises Indonesia’s GDP developments, both by expenditure (demand side) and by sector (supply side). On the demand side in 2023, domestic consumption remained the main driver of growth, expanding by 4.7% from 3.7% in 2022, while gross fixed capital formation (GFCF) continued its upward trend, accelerating by 4.4% from 3.9% in 2022. Export growth remained positive, at 1.3% (down from 16.2% in 2022), while imports contracted by 1.6% (following growth of 15% in 2022).
Table 1. GDP Growth 2022–23 (%, year on year)
Private consumption growth, which contributed around 54% of total GDP, slowed from 5.0% in 2022 to 4.9% in 2023. Contributing to private consumption, household consumption grew at a rate of 4.8% in 2023 compared to 4.9% in 2022. Meanwhile, consumption in the non-profit sector (LNPRT)Footnote2 surged to 9.8%, buoyed by campaign-related spending in the lead-up to the 2024 general election. Growth in government consumption was positive, at 2.9%, after contracting by 4.5% in 2022. While the contraction in government consumption in 2022 was mainly due to the winding down of pandemic-related spending, the positive growth in 2023 was largely due to a low-base effect from 2022 and the upward revision of the 2023 state budget.Footnote3 The government made this revision to support growth as the economy showed signs of weakening in the second half of 2023.
Public investment appears to be the main driver of strengthening domestic investment as the government has increased efforts to accelerate the country’s National Strategic Projects (PSN).Footnote4 As of October 2023, PSN consisted of 211 ongoing projects and 13 programs, with an estimated value of $383.1 billion. Of these, 170 projects have been completed since 2016, with a total investment value of $82.7 billion.
The primary question about Indonesia’s growth is whether momentum can be sustained amid global disinflationary trends. As shows, a trend of decreasing consumption is discernible, perhaps precipitated by a fall in savings following the post-pandemic spending binge. This has likely been worsened by declining revenue, particularly in regions with a strong reliance on commodity exports. Election-related expenditure, meanwhile, can be expected to fuel growth only in the lead-up to an election, therefore a post-election consumption slowdown appears imminent.
On the production side, economic growth was driven mainly by manufacturing, construction and the continued recovery of the services sector, notably tourismrelated sectors, especially transportation and accommodation. Manufacturing, which contributes around 19% of economic growth, grew by 4.6% in 2023, down from 4.9% in 2022. Weaker global demand, combined with moderating commodity prices reflected in contracting merchandise exports, was the main factor behind the sluggish manufacturing growth in 2023. The textile and footwear subsectors contracted by 2.0% and 0.3%, respectively, in 2023 owing to weaker global demand for related products. Meanwhile, slower private consumption was reflected in the trade sector, which grew by only 4.8% in 2023, down from 5.5% in 2022. The mining sector, however, grew by 6.1% in 2023, up from 4.4% in 2022, amid moderating commodity prices. In line with the upward trend of the GFCF, the construction sector grew by 4.9% in 2023, up from 2.0% in 2022. Strong domestic demand continued and international tourist arrivals rebounded, boosting the performance of the transport and storage sector, as well as the accommodation, food and beverages sector. Respectively, these two sectors grew, by 10% (down from 11.9%) and 14% (down from 19.9%).
Improving Indonesia’s economic growth remains challenging, given the global landscape. The IMF’s World Economic Outlook Update in January 2024 projected that global economic growth will stagnate at 3.1% in 2024 and will improve only slightly to 3.2% in 2025. China, the main destination for Indonesian exports, is unlikely to return its economic growth rate to above 5% (IMF 2024). The IMF projects that economic growth in China will slow to 4.6% in 2024 and then 4.2% in 2025 (IMF 2024). The robust economic growth in the United States that was seen in 2023 is predicted to weaken from 2.5% in 2023 to 1.7% in 2024 and 1.2% in 2025 (IMF 2024). Domestic demand will play a critical role in sustaining economic growth, given the poor global outlook. Expediting economic transformation is also critical for strengthening productivity and broadening the growth basis. On the supply side, a set of policies to revitalise the stagnated manufacturing sector in Indonesia, strengthen the agriculture and services sectors, as well as attract investors to scale up Indonesia’s high-tech sector and the digital economy, will be crucial. At the same time, investment in future talent and regulatory reforms is needed.
Inflation
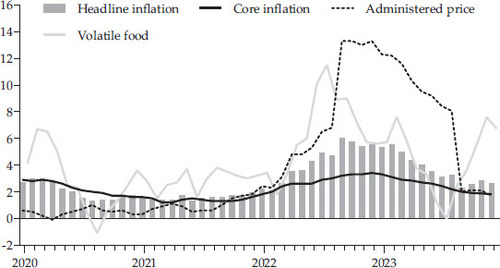
Indonesia’s headline inflation moderated and remained within the government’s target range. As shows, headline inflation was 2.6% in December 2023 (year on year ), down from its recent peak of 6.0% (year on year ) in September 2022 (BPS 2024). The December figure is the lowest headline inflation figure recorded in Indonesia in the past 20 years, excluding during the pandemic period of 2020 and 2021. Low core inflation and a declining trend in administered prices in the second half of 2023 are the main factors behind the low figure. The core inflation—representing price changes in 711 commodities, or around 66% of the consumption basket—has continued to decline, somewhat in line with slower domestic consumption. Since peaking in September 2022, administered prices, representing price changes in 23 commodities (18% of the consumption basket), have continued to decline, as the effects of a fuel price hike in September 2022 waned. A major driver of inflation in 2023 was an increase in food prices due to El Niño, which delayed the rice production cycle and disrupted rice supply (Widi and Primantoro 2023). The volatile food component of the basket began to rise after July 2023 as rice prices continued to rise. From January to December 2023, the retail price of rice surged from Rp 15,252 per kilogram to Rp 17,367 per kilogram, with a sharp increase occurring after July 2023. The government supported price stabilisation measures by the National Logistics Agency involving an increase in its rice stock for a market operation.Footnote5 In addition, Indonesia’s Inflation Control Team (TPI) has helped curb inflation at the national and subnational levels. Inflation has been one of the key performance indicators for regions and has been regularly discussed with the central government. The government uses the Regional Incentive Fund in the state budget to reward regions controlling inflation. Through the TPI, Bank Indonesia encourages local communities to grow crops that are considered major sources of price volatility, such as chillies, scallops and onions.
FIGURE 1 Rates of Inflation, Administered Prices and Volatile Food (% year on year)
Source: BPS (Statistics Indonesia).
External Sector
Indonesia’s external sector has continued to strengthen in the aftermath of the Covid-19 pandemic, driven by not only the commodity boom but also policy on natural resource ‘downstreaming’—for example, to stimulate the domestic nickel processing and refining industry. As a shows, Indonesia has gradually improved its current account balance, from a deficit of 3.09% of GDP in 2014 to a surplus of 0.98% of GDP in 2022.
FIGURE 2 Current Account and Key Exports
Source: Trade Map (https://m.trademap.org/#/main) and BPS.
Note: * The 2023 value in a is for Q1–Q3.
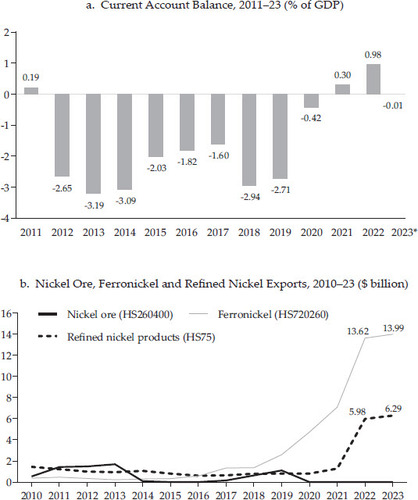
As b shows, a significant increase in exports of ferronickel and other nickel products occurred after 2019 following the completion of a phased government ban on nickel ore exports. The policy was initiated in 2012, when a flat tariff of 20% was imposed on the export of low-grade nickel ore.Footnote6 Subsequently, in 2014, only processed and refined minerals could be exported.Footnote7 In 2017, a flat tariff of 10% was imposed on the export of low-grade nickel ore,Footnote8 before nickel ore exports were completely banned in 2019.Footnote9 After 2019, Indonesia’s exports of ferronickel and other refined nickel products surged significantly (ITC 2023).
The nickel downstreaming policy seems to have been effective in increasing Indonesia’s exports to China, Indonesia’s major trading partner.Footnote10 As a shows, Indonesia had a trade deficit with China of around $14.4 billion in 2015. The deficit widened to $18.4 billion in 2018 amid heightening trade tension between the United States and China. The trade deficit has improved dramatically since then, following a surge of iron and steel exports amid Indonesia’s downstreaming policy (b). Nevertheless, the downstreaming policy has faced substantial scrutiny and criticism, particularly for its inefficiencies (Patunru Citation2023) and environmental impact (Fauziyah and Afifa 2024).
FIGURE 3 Indonesia’s Trade with China
Source: Trade Map (https://m.trademap.org/#/main) and BPS.
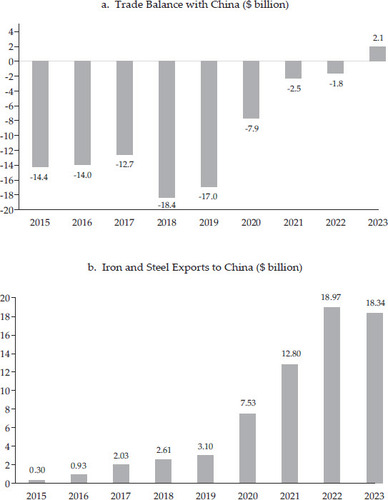
Sustained trade surpluses and the net inflow of foreign direct investment have strengthened Indonesia’s external position during periods of capital flow volatility. Cumulatively, from January to December 2023, Indonesia’s trade balance was in surplus by $36.93 billion while the country’s current account balance was in deficit by only $0.11 billion, –0.01% of GDP. As b shows, Indonesia’s growing exports to China were able to compensate for a contraction in exports to other regions as global demand weakened. Between 2020 and 2022, ferronickel exports became the major export commodity, representing 15.8% of Indonesia’s total exports to China. Stainless steel exports, which also use nickel as a raw material, grew and entered the top-five most exported Indonesian commodities to China, with a 4.3% share of Indonesia’s total exports. This differs from what we have seen in the past 10 years (2008–19), where Indonesia’s main exports to China were dominated by raw products, such as palm oil, coal and natural gas.
Indonesia’s overall balance of payments in 2023 was healthy, with enough current international reserves to cover imports and short-term external debt (). The mining- and metal-processing sectors have continued to attract foreign direct investment as the government provides incentives for the development of a green industry ecosystem (that is, the development of electric vehicle and solar panel industries). Meanwhile, the domestic capital market briefly experienced a reversal of inflows of non-resident portfolios from August to October 2023 owing to riskaversion from investors following increases in the Federal Reserve funds rate, the US Treasury yield and geopolitical tension (OJK 2023). These capital outflows have contributed to a depreciating rupiah, prompting Bank Indonesia to intervene in the foreign exchange market to prevent excessive volatility, causing international reserves to decrease. For a developing country such as Indonesia, exchange rate stability is crucial to price and economic stability, maintaining international trade competitiveness, attracting foreign investment and managing external debt.
Table 2. Balance of Payments 2021–23 ($ billion)
Banking and Finance
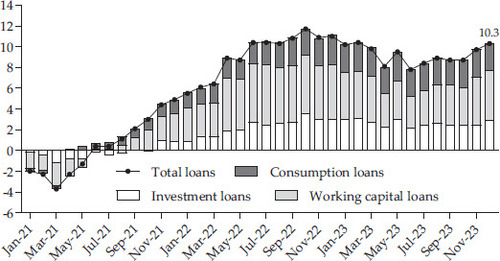
Overall, the banking sector has remained robust and well-buffered, with limited credit risk. Growth in bank loans increased in the second half of 2023 as economic activity remained robust (). Bank loans to the private sector increased by 9.0% in September 2023 and continued to accelerate towards the end of 2023. In particular, credit to micro, small and medium enterprises (MSMEs) accelerated from 18% during the pandemic to 21% in August 2023. This partly reflects the People’s Business Credit scheme’s provision of loans to MSMEs. The asset quality of banks has also been relatively sound, with low credit risk. As of September 2023, the system-wide non-performing loan ratio was 2.4%. The loan-at-risk ratio, which reflects bank asset quality, has been consistently decreasing since the onset of the pandemic, standing at 12.1% as of September 2023. The banking industry had sufficient buffers to endure adverse shocks, with a capital adequacy ratio of 27.4%, as of December 2023, significantly above the Basel III minimum requirement of 10.5%. Funding and market liquidity remained ample, with a liquidity coverage ratio and a net stable funding ratio of 230% and 136%, respectively, in June 2023, well above the 100% regulatory minimum.
FIGURE 4 Credit Growth by Loan Purpose (%, year on year)
Source: CEIC (https://www.ceicdata.com/en).
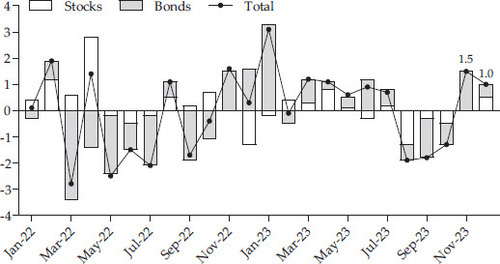
Domestic financial markets have been relatively resilient amid global financial market turmoil. Movement in the rupiah exchange rate throughout 2023 was affected by escalating uncertainty in global financial markets. Compared to other emerging market currencies, the rupiah exchange rate was stable. In the year to 29 December 2023, the rupiah appreciated 2%, while the currencies of peer countries such as Vietnam, Malaysia and Japan depreciated by 2.69%, 4.31% and 7.57%, respectively. The government bond market improved accordingly. After recording net outflows from August to October 2023, particularly due to a surge in the US Treasury bond yield (OJK 2023), the domestic financial market recorded inflows of $1.5 billion and $1 billion in November and December 2023, respectively (). While the US government bond yield remained high throughout 2023, Indonesia’s government bond yield decreased to 6.68% (year to date), demonstrating Indonesia’s efforts to maintain stable macroeconomic conditions and investor confidence.
FIGURE 5 Financial Market Development ($ billion)
Source: CEIC (https://www.ceicdata.com/en).
Indonesia’s Macroeconomic Policy Mix Responses
Monetary Side
Indonesia’s modest inflation leaves adequate policy room for Bank Indonesia to counter external pressures while supporting economic recovery. At a time when many countries are aggressively tightening monetary policy, Indonesia’s interest rates have risen cumulatively by a total of 250 basis points since the beginning of 2022. Although inflation had fallen within the central bank’s target range by the end of 2023, renewed pressure on the local currency and volatility in capital flows since mid-2023 have prompted Bank Indonesia to adjust its policy mix. In October 2023, Bank Indonesia raised its policy rates by 25 basis points to ease the rupiah exchange rate and mitigate the risk of imported inflation.
Bank Indonesia also implemented non-interest-rate-based policies, through foreign exchange intervention and financial deepening. To ensure stability in the rupiah exchange rate, Bank Indonesia has intervened in the spot market and the domestic non-deliverable forward market and it has indirectly intervened in bond markets. In September 2023, Bank Indonesia’s intervention approach changed, from using operation twist (selling short-tenor government bonds and buying long-tenor government bonds to flatten the yield curve and attract inflows) to using a short-term liquidity instrument—Bank Indonesia Rupiah Securities (SRBI). SRBI are a rupiah-denominated short-term (1 week to 1 year ) money market instrument that uses Surat Berharga Negara (government securities) as the underlying assets. Unlike reverse repos, SRBI are tradable by both domestic and foreign holders through a discount system. Bank Indonesia also launched Foreign Currency Securities (SVBI) and Foreign Currency Sukuk (SUVBI), which use Bank Indonesia’s foreign exchange assets as underlying assets and can be traded on the secondary market. This new instrument is intended to support Government Regulation 36/2003 on Foreign Exchange Export Proceeds from the Business, Management and/ or Processing of Natural Resources. The regulation was launched by the government in July 2023 and requires exporters in the mining, plantation, forestry and fisheries sectors, with exports of at least $250,000 in value, to keep 30% or more of their export proceeds onshore for at least three months.
The launch of these two instruments put pressure on government bonds, reflected by a significant decline in incoming bids and an increase in the government bond yield. The incoming bids for both conventional and Syariah government bonds in October 2023 were lower than expected. The higher yield offered by SRBI when first issued led to an increase in the government bond yield. As a result, the issuance of both conventional and Syariah government bonds was under the target. In early 2024, however, as global pressures had eased and the Federal Reserve appeared more accommodative, the government bond market continued to improve.
Fiscal Side
As pandemic pressures eased in 2022, the Indonesian government took a cautious approach to the 2023 budget despite a significant revenue windfall in 2022 amid skyrocketing commodity prices. This was due to the dim global prospects for 2023, including predictions of moderating commodity prices and more aggressive tightening of monetary policy in advanced countries (IMF 2022). Domestically, bank loan growth had also been strengthening, increasing the challenge of deficit financing amid tighter liquidity conditions. The government aimed for a deficit of 2.84% of GDP in 2023 as revenue was projected to contract by 6.5% compared with the previous year while expenditure was budgeted to be 1.1% lower than the outturn in 2022. In addition, excess cash resulting from the 2022 budget outturn also provided fiscal buffers against adverse circumstances in 2023.
Ominous signs appeared in early 2023, such as increasing food prices and contracting cement sales, the latter of which is a key leading indicator of construction sector health and investment. GDP data for the first quarter of 2023 confirmed the situation: construction activity had slowed to 0.3% from 1.6% in the last quarter of 2022. In the same period, the rate of investment growth fell to 2.1% as the value of buildings and structures, the main contributor to investment, grew by only 0.1% (see ). Overall, economic growth stagnated at 5.0% at the start of 2023 compared to the end of 2022.
With exports starting to contract in the second quarter of 2023, the government paid the Tunjangan Hari Raya salary bonus and the 13th salary bonus to civil servants in the second quarter of 2023.Footnote11 This helped boost private consumption to 5.3% in the second quarter of 2023, resulting in stronger GDP growth of 5.2%. The government intervened further through the El Niño Direct Cash Assistance initiative and by giving them 10 kilograms each of rice for four months (September to November ). In October 2024, the government implemented a policy to provide additional food assistance (10 kilograms of rice) for one month (December) for 20.3 million poor households, cash transfers of Rp 200,000 to 18.8 million households for two months (November–December ), and fiscal incentives for property sectors. The fiscal incentives included sales tax relief for buyers of non-subsidised houses valued below Rp 2 billion. Buyers of subsidised houses were given an administrative fee discount amounting to around Rp 4 million per house. Last, the government distributed about Rp 20 million in cash for poor families to renovate or build new houses. This policy is thought to have helped prevent the economy from slipping further in 2023.Footnote12
Indonesia’s fiscal policy appears to have been effective in cushioning shortterm shocks as the monetary authority focused on economic stability. Nonetheless, mediumto long-term challenges need ongoing attention. Although the government has significantly developed infrastructure in recent years, the infrastructure gap between Indonesia and its peers remains large (World Bank Citation2022). Human capital is another area that needs better development to foster productivity. Most important is the improvement of the regulatory and bureaucratic system, which will be crucial for attracting foreign investors who can create jobs and share advanced technology.
Fiscal policy plays a crucial role in easing efforts to address those issues. As such, the government-initiated tax reforms through Law 7/2021 on Tax Harmonization, which aims to modernise tax administration and broaden the tax base. Other major changes include the hike in the value-added tax rate from 10% to 11% in 2022 and to 12% by 2025, the modernisation of tax administration by adopting digital technology and integrating national identity numbers and taxpayer numbers. The hike in the value-added tax rate, effective from April 2022, resulted in a revenue gain of around Rp 60 trillion (0.3% of GDP) during April–December 2022. The integration of identification numbers and taxpayer numbers is intended to bring more people into the tax system, broadening the tax base and improving tax compliance, as financial transactions should be easier to track and check.
On the spending side, the enactment of Law 1/2022 on Intergovernmental Fiscal Transfers is designed to make government spending more effective in achieving development targets. The central government seeks more coordination and oversight of local government budgets so that allocation, disbursement and outcomes are better monitored and evaluated. The law also requires the Ministry of Finance to prepare a regional macroeconomic and fiscal policy framework for local governments to reference when formulating the General Budget Policy-Provisional Budget Ceiling Priorities (KUA-PPAS).
DOES SOCIAL SPENDING HELP TO IMPROVE WELL-BEING AND REDUCE POVERTY?
Indonesia’s fiscal policy has been designed to maintain economic growth and safeguard the well-being of its citizens, particularly amid challenges such as the global Covid-19 pandemic. The government’s responses included a diverse set of fiscal measures, including stimulus packages and social assistance programs. These initiatives aimed to stabilise the economy, prevent a profound recession and establish a safety net for vulnerable populations. This section further explores the government’s efforts, with a focus on developments in 2023, to provide protection for those in need and reduce poverty. Furthermore, it discusses challenges such as those surrounding the quality of spending and problems with targeting data as well as the heavy burden of energy subsidies. Addressing these challenges effectively would allow greater opportunities to improve welfare.
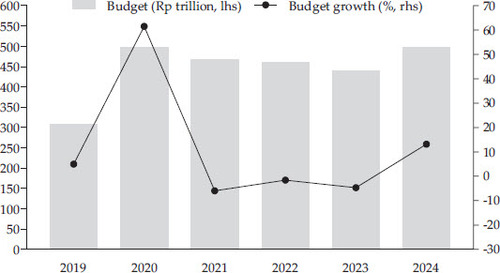
shows annual trends and fluctuations in the social protection budget from 2020 to 2024. In response to the pandemic, the overall budget allocation in 2020 increased by 61.50% compared to the 2019 allocation. Government expenditure on social protection has consistently remained above Rp 400 trillion since 2020, peaking in 2024 at Rp 496.8 trillion, representing a 13.10% increase compared to expenditure in 2023. It’s important to note that a considerable portion of the social protection budget is allocated to subsidies, particularly energy subsidies such as for liquid petroleum gas, electricity and fuel. In 2024, from a total allocation of Rp 496.80 trillion, about Rp 269.24 trillion, or around 54%, was earmarked for these subsidies. These energy subsidies not only strain the fiscal budget, particularly when international energy prices are high but also exhibit regressive tendencies towards the non-poor and produce inefficiencies from a social equity standpoint (Abimanyu and Imansyah Citation2023).
FIGURE 6 Social Protection Budget
Source: Ministry of Finance (2023).
Despite an increasing trend towards social protection spending, Indonesia’s financial expenditure on welfare support remained modest in 2022, at just 2.35% of GDP. The Ministry of Finance (2023) reported that the total budget for comprehensive social protection, including subsidies, amounted to just Rp 460.60 trillion. This figure stands in contrast to Indonesia’s 2020 GDP, which reached Rp 19,588.4 trillion (BPS 2023). After excluding subsidies (Rp 264.46 trillion) from the budget, Indonesia’s allocation for social protection was just Rp 200.14 trillion, or 1.02% of GDP, in 2022. By this measure, among ASEAN countries, Indonesia spends more than Laos (1.7%) but lags behind Vietnam (7.6%), Thailand (6.4%), Singapore (6.2%), Malaysia (5.5%) and the Philippines (3.8%) (OECD 2022). This highlights the constrained fiscal space for social protection in Indonesia and the pressing need for strategic and efficient use of available resources.
In terms of social outcomes, Indonesia is moving towards meeting the United Nations–led Sustainable Development Goals, as evidenced by the increasing trend in Indonesia’s index score, which reached 70.16 in 2022. However, challenges persist in health and well-being improvement, affordable and clean energy provision, and climate action and inequality reduction (Sachs et al. Citation2023). The most notable social outcome improvement is perhaps in poverty reduction. Overall, Indonesia’s poverty rate fell from the mid-1970s to 2023 despite some setbacks (BPS 2018, 2023). The Asian financial crisis of 1997–98 increased poverty in the short term, but the declining trend had returned by the early 2000s (). The Covid-19 pandemic also increased the poverty rate, which hit 10.14% in 2021, setting back poverty reduction by about three years, although the poverty increase fell short of predictions by the World Bank (Citation2020) and the Asian Development Bank (ADB 2020). In 2021, poverty started decreasing again and, by 2023, the poverty rate had fallen to 9.36%.
FIGURE 7 Poverty Figures and Targets, 2004–23
Source: BPS various years.
Note: The poverty numbers for 2011–13 were reproduced in 2013 using a new weight from the population census of 2010. The target rate was set under the National Long-Term Development Plan (RPJMN).
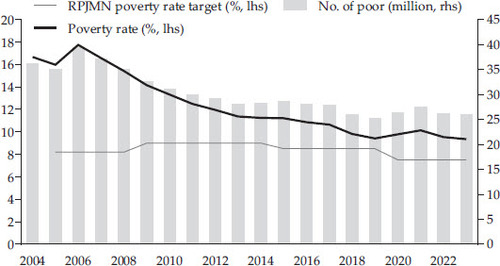
The declining trend in poverty should be considered against two important observations. First, the 2023 poverty rate was 9.36%—at least 1.85 percentage points short of the 2024 target range of 6.5%–7.5%, as set under the National Long-Term Development Plan (RPJMN). Second, the overall reduction in poverty has been decelerating, particularly in the past 10 years. While this may seem natural given the complexity, severity and depth of poverty, it may also signify decreased performance in poverty reduction programs, lower economic growth and less elasticity between growth and poverty (Hill Citation2021). Meeting the poverty rate target remains improbable without a concerted and extraordinary effort to accelerate poverty reduction by rooting out program ineffectiveness and improving the quality of economic growth. This has remained a challenge across various presidential terms.
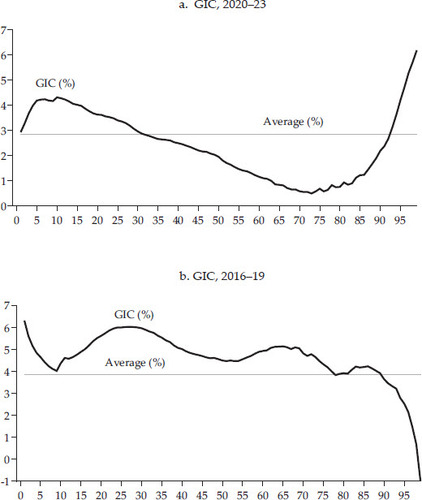
During the pandemic in 2020, fiscal policy appears to have helped curb an increase in poverty. As 2.4 million people became poor (representing a poverty increase of 0.73 percentage points), the government expanded the coverage of social assistance programs, increased the benefits of programs and introduced new programs. These policies helped to maintain the welfare of the poorest 40% of Indonesians, as well as some ‘middle-income’ earners negatively affected by the pandemic. This was evidenced by positive growth in consumption for the majority of the poorest 40%, as shown in the growth incidence curve in a for 2020–23. Comparatively, b reveals that, between 2016 and 2019, the consumption growth of the poorest 40% tended to be higher than that of middle-income earners—those between the 40th and 80th percentiles in the consumption distribution.Footnote13
FIGURE 8 Growth Incidence Curve (GIC) (real)
Source: Susenas 2016, 2019, 2020 and 2023.
Note: Average growth in a and 8b is geometric growth. The GIC shows the annualised growth rate of per capita expenditure for every percentile of expenditure between two points in time.
To improve social protection and reduce poverty, the government must develop more inclusive programs with a wider range of beneficiaries, including the elderly, people with disabilities and other vulnerable groups. Making social protection programs more inclusive is also crucial for boosting productivity, especially when a primary challenge of Indonesia’s workforce is to improve the labour productivity of workers from impoverished and vulnerable families.Footnote14 As noted, excluding the energy subsidies, Indonesia’s total spending on social protection remains relatively low compared to international standards (OECD 2022). Improving the country’s relative performance does not necessarily require an increase in government revenue. While expanding revenue by increasing the tax ratio is a necessary step, this process may take time given the current level of economic growth and tax buoyancy. In the shorter term, the government can prioritise the reform of regressive energy subsidies, such as those for fuel, electricity and liquid petroleum gas, by transitioning towards better-targeted programs for households and individuals in need.
Research has highlighted significant issues of both exclusion and inclusion errors in various social transfer programs (Bah et al. Citation2019; Kusumawati and Kudo Citation2019; Satriawan and Shrestha Citation2019; Sim, Negara and Suryahadi Citation2015; Tohari, Parson and Rammohan 2019). With the increasing availability of detailed microdata on individual socio-economic characteristics, Indonesia must develop a data and targeting system that fosters interoperability and exchange across different line ministries and government agencies. Additionally, addressing poverty requires a comprehensive approach that integrates interventions to tackle multiple root causes. This necessitates government efforts to harmonise existing anti-poverty programs across different line ministries, thereby enhancing coordination and use of consistent targeting data. Last, the effectiveness of programs depends on their design and implementation. Evaluation of some Indonesia social protection programs has demonstrated the positive impact of programs on improving human capital and reducing poverty, while also identifying areas for program improvement (Cahyadi et al. Citation2020; Lenel et al. Citation2022; Banerjee et al. Citation2023).
2023 BUDGET PERFORMANCE AND 2024 FISCAL POLICY DIRECTION
2023 Budget Outturn
Amid global economic turbulence, Indonesia’s 2023 state budget aimed to absorb some of the economic shock of the pandemic to allow economic stability and recovery, protecting purchasing power and supporting development. The performance of the state budget is hoped to create adequate buffers against problems in the global economy, which is expected to weaken further in 2024 (World Bank Citation2024). State revenue reached Rp 2,774.3 trillion in 2023, or 12.6% more than its initial target (). Meanwhile, Rp 3,121.9 trillion of the government budget was disbursed— about 2.0% more than was initially budgeted (Rp 3,061.2 trillion).Footnote15 The realisation of transfers to regions and village funds reached Rp 881.3 trillion.
Table 3. Budget Performance, 2021–23 (Rp trillion)
Amid decreasing commodity prices and global economic uncertainties, Indonesia’s tax revenue grew positively in the three years since 2021. The tax-toGDP ratio has also increased marginally compared to pre-pandemic levels, from 9.77% in 2019 to 10.21% in 2023. Based on provisional realisation data, tax revenue (including taxes, customs levies and excises) grew 5.9%, with tax revenue realisation in 2023 reaching 106.6% of the target set in Presidential Regulation 75/2023, supported by sustained domestic economic performance and tax supervisory activities by Indonesia’s Directorate General of Taxes. In 2023, tax revenue from the land and building tax, and the value-added and luxury goods sales tax, grew by 39.2% and 11.2% year on year, respectively (MoF 2023). Meanwhile, revenue from non-oil and gas tax grew by 7.9%, while revenue from oil and gas tax decreased by 11.6% due to lower oil and gas commodity prices. Revenue growth slowed significantly in 2023 compared to 2022, following growth of 34.3% in 2022 (MoF 2023), driven by the commodity boom and the Voluntary Disclosure Program (Tax Amnesty Volume 2), which will not be repeated in 2023.
In contrast with tax, revenue from customs contracted, in line with declining imports amid plummeting commodity prices. Similarly, excise revenue decreased following a government hike in the cigarette tariff to reduce smoking. Non-tax state revenue in 2023 increased slightly compared to 2022 following increases in coal royalties and state-owned enterprise dividend payments, and an increase in non-tax revenue from the services of ministries and government agencies.
On the other side, state expenditure reached Rp 3,121.9 trillion in 2023, or 102% of the budgeted target of 3,061.2 trillion rupiah, representing 0.8% in growth compared to 2022. This spending aimed to support economic activity, protect purchasing power and support agendas such as stunting reduction, extreme poverty reduction, El Niño mitigation, election preparation and priority infrastructure development, including the construction of Indonesia’s new capital city. Central government spending in 2023 contracted by 1.7% compared to the realisation in 2022. This came after lower energy subsidy realisation, while regional transfers gained momentum following the implementation of policy to increase local government expenditure, including Law 1/2022 on Financial Relations between the Central and Regional Governments.
The primary balance recorded a surplus of 92.2 trillion rupiah, the first surplus since 2012, allowing the fiscal deficit to further narrow to Rp 347.6 trillion, or 1.65% of GDP. The figure is much lower than the state budget target of 2.84% of GDP and last year’s fiscal deficit of 2.35% of GDP. Amid weak global investment, state budget investment financing reached Rp 90.1 trillion, primarily to support the acceleration of infrastructure development, increase access to housing finance for low-income earners, provide support for National Strategic Projects and strengthen the quality of human resources.
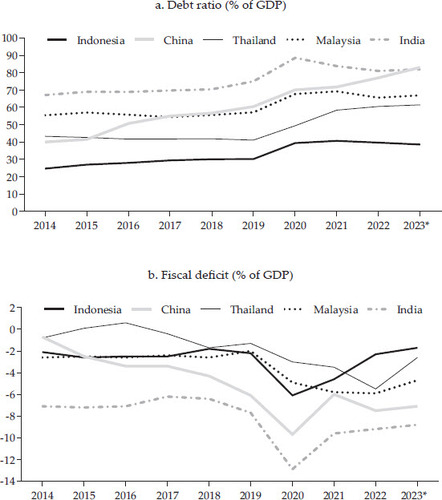
Indonesia’s countercyclical fiscal policy incorporated a clear exit timeline for certain interventions. Under the Government Regulation in lieu of Law (Perppu) 1/2020, Indonesia relaxed its budget deficit rule to allow the deficit to rise above 3% of GDP but only for three years (2020–22). The budget deficit fell back below 3% of GDP a year earlier than initially planned, in 2022. a and 9b show that Indonesia’s ratios of debt and deficit to GDP increased in 2020, to 39.4% and –6.1%, respectively, owing to the government’s responses to the pandemic and its economic recovery program. More recently, Indonesia’s fiscal deficit and debt ratios have appeared more sustainable than those of ASEAN peers such as Thailand and Malaysia or larger economies such as China and India (IMF 2023a).
FIGURE 9 Fiscal Deficit and Debt Ratio of Selected Countries
Source: Ministry of Finance of Indonesia and IMF.
Note: * 2023 values comprise realisation values for Indonesia and IMF forecasts for other countries.
Fiscal Policy Stance for 2024 and Challenges Ahead
The 2024 state budget was approved by the parliament in October 2023. As outlined in a 2024 macroeconomic and fiscal policy framework document (MoF 2023), Indonesia’s fiscal policy in 2024 aims to address both short-term and mediumto long-term challenges. In the short term, the government predicts weaker global economic prospects as uncertainty remains amid tighter global liquidity conditions and high geopolitical tensions. As moderating commodity prices and a tight deficit-financing environment will likely remain, the government has maintained a cautious and conservative approach while continuing its efforts to rebuild a fiscal buffer to strengthen fiscal sustainability. As for the mediumto long-term challenges, the 2024 budget is also geared towards addressing binding constraints on growth, coined as the ‘three gaps’: the human capital gap, infrastructure gap and institutional gap. The government seeks to reduce these gaps to allow the structural transformation of the economy, with improved productivity, value-added and inclusive and sustainable development.
The conservative approach in designing the 2024 budget is also reflected in the macroeconomic assumptions, and revenue and spending figures. GDP is projected to grow by 5.2%, considering upside factors such as surging domestic consumption. Oil prices, hovering at around $80 per barrel at the time of writing, are projected to reach $81.2 per barrel in 2024 (IMF 2023a). The government is optimistic about the effects of oil and gas sector investment, which rose dramatically in 2023. Based on these assumptions, total government revenue is predicted to reach Rp 2,802.3 trillion, representing an increase of 1.0% compared to the 2023 outturn. Taxes are projected to contribute about Rp 2,309.9 trillion in 2024, representing a 6.7% increase compared to 2023. Nonetheless, as the nominal growth in tax collection is projected to be lower than the nominal growth in GDP of around 8%, tax buoyancy is expected to be slightly below 1%, implying that the tax ratio will be stable at about 10.3%. The planned adoption of the Core Tax Administration System in the middle of this year is expected to gradually broaden the tax base and improve compliance. On the other hand, non-tax revenue—such as royalties from the mining sector, levies and user fees—is projected to fall given a continued reduction in commodity prices ().
Table 4. The 2024 Budget Posture (Rp trillion)
In the short term, government expenditure will aim to address problems such as extreme poverty and stunting. In the mediumto long-term, spending is intended to improve human capital, accelerate infrastructure development and improve institutions and regulatory systems. To reduce problems with subsidy targeting, expenditure will seek to improve data accuracy, delivery mechanisms, and the coordination of Indonesia’s social protection programs. The local macroeconomic and fiscal policy framework will also be brought into line with the national one and National Strategic Projects will continue. Total government spending in 2024 is projected to be around Rp 3,325.2 trillion in 2024, or 6.1% more than in 2023. The fiscal deficit target is around Rp 522.8 trillion, or 2.29% of GDP (based on Law 19/2023).
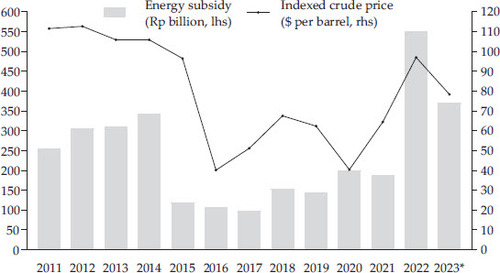
Despite being in a relatively strong fiscal position after the pandemic, Indonesia has many challenges to face. Energy subsidisation, in particular, has long been a concern owing to its ineffectiveness and distortive effects on the economy. Although changes to energy subsidies are politically contentious, the subsidies are widely seen as burdensome for the government budget and unproductive, as they disproportionately benefit wealthier individuals, divert limited resources from more essential public services and contribute to environmental degradation (ADB 2015). Historically, energy subsidies decreased from an average of 3.7% of GDP in 2006–14 to an average of 1.5% of GDP in 2015–21 (MoF 2023). As shown in , energy subsidy reform in 2015 cut two-thirds of the Rp 341.8 billion in subsidy expenditure in 2014. In 2022, soaring oil prices forced Indonesia to hike domestic fuel prices by an average of 30%, saving around Rp 150 trillion in possible energy subsidies. Without upward adjustments to domestic oil prices, the fuel subsidy could have reached around Rp 700 trillion. Nevertheless, the total realisation of the energy subsidy remained huge, at Rp 551.2 billion. Reforming energy subsidies is not an easy task. The key hurdle to energy subsidy reform is often not technical in nature but political (McCulloch Citation2023).
FIGURE 10 Indonesia Crude Price and Energy Subsidy
Source: Ministry of Finance of Indonesia.
Note: * 2023 values are unaudited.
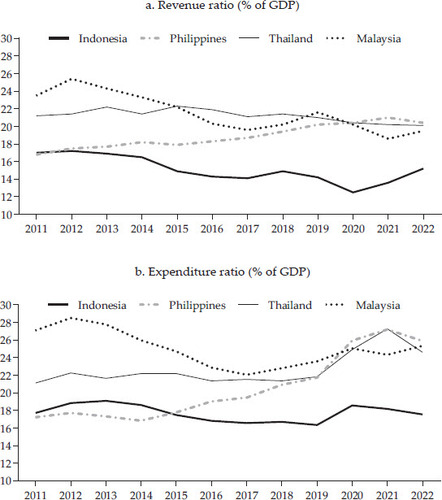
In addition to the subsidy burden, Indonesia’s state budget also suffers from a persistently low tax ratio. According to the OECD (2023), Indonesia’s tax ratio was 10.9% in 2021, below the Asia Pacific average of 19.8% and the OECD average of 34.1%. Despite substantial tax revenue, Indonesia’s tax ratio remains comparatively low, suggesting a mismatch between economic growth, tax collection and government spending. This discrepancy limits the expansionary measures available to accelerate growth and provide essential public services. As shown in a and 11b, Indonesia’s revenue ratio is low compared to the ratios of Southeast Asian peers, resulting in a lower expenditure ratio. The low tax ratio indicates an overreliance on a relatively narrow tax base and the urgent need for comprehensive tax reforms to increase revenue collection.
FIGURE 11 Revenue and Expenditure of Selected Southeast Asia Countries
Source: IMF (2023b).
To increase the tax ratio, the government developed an omnibus law (Law 11/2020 on Job Creation) that aims to reform Indonesia’s taxation system by streamlining tax regulation and procedures while enhancing competitiveness and attracting foreign investment. Its key provisions include the integration of the personal identification number into the tax identification number, the temporary Voluntary Disclosure Program, a taxable income threshold adjustment, and a value-added tax rate rise. The law also serves as a legal standard for the expansion of tax objects, such as excises on plastic products and sugary beverages, as well as carbon tax.
Indonesia’s tax administrator will also be involved in the implementation of the new Core Tax Administration System in 2024. This system is intended to improve tax enforcement and the public’s perception of changes to public services. It also aims to streamline processes, integrate with customers’ daily business, improve customer experience and take a risk-based compliance approach to resource allocation for services and enforcement—which is expected to increase tax revenue. These efforts are supported by the findings of Basri et al. (Citation2021), who suggested that tax administrative reform in developing countries such as Indonesia could increase tax revenue. The possibility of establishing a revenue collection body, separate from the Ministry of Finance, was among the topics discussed leading up to the recent 2019 presidential election. While this proposal may enhance the efficiency and efficacy of tax administration as it becomes more autonomous—in terms of budgeting, human resource management and governance—it could limit the effectiveness of fiscal policy responses to adverse shocks and may create a ‘super-entity’ (Kidd and Crandall Citation2006). While several countries have independent revenue authorities (ADB 2021), establishing a new institution necessitates extensive institutional adjustments that may reduce the tax ratio during initial establishment. In a context where Indonesia needs to improve its fiscal capacity immediately, a more effective approach to increasing the tax ratio may be digitalisation and administrative reform (Basri et al. Citation2021).
Last, effectively managing the debts of Indonesia’s SOEs is critical for ensuring fiscal sustainability and overall financial stability. The aggressive involvement of SOEs in high-leveraged infrastructure projects during the pandemic has led to challenges such as cash flow mismatches and debt defaults (Negara and Prasetyantoko Citation2023). Although the government has tried to address these issues, particularly by providing capital injections, guarantees for SOEs’ financial obligations and tax payment deferral facilities, these approaches aim only to alleviate short-term financial distress. In the longer term, a more balanced and strategic approach needs to be taken to prevent the overreliance of SOEs on government support and to ensure that SOEs can operate efficiently and help support Indonesia’s economic growth. More importantly, as noted by Negara and Prasetyantoko (Citation2023), the government must be cautious about the potential risks that SOEs’ debts pose to Indonesia’s credit rating and the confidence of investors.
SUMMARY AND CONCLUSIONS
Rapid changes in the global economic landscape following the Covid-19 pandemic have affected Indonesia’s economic performance and the government’s management of macroeconomic policy. Indonesia benefited considerably from soaring commodity prices in 2022 despite pressures arising from energy subsidy-related spending. The economy grew by 5.3% in 2022, driven mainly by exports and robust domestic demand. Exports of goods and services increased by 16.2% compared to an average of 2.2% during the first term of Jokowi’s administration. Although government consumption weakened owing to declining pandemic-related spending, private consumption provided strong support to domestic demand. Notably, unlike during the peak of the commodity boom in 2011, which was able to boost investment, the commodity windfall in 2022 has not increased investment, which expanded modestly in 2022.
A different external landscape emerged in 2023. Weakening global demand along with moderating commodity prices led to a contraction in export growth. Aggressive monetary policy tightening in advanced countries, particularly the United States, sparked financial market routs in emerging markets, including Indonesia (IMF 2023d). Capital outflows rose, putting pressure on local currencies. Nevertheless, the economy grew by 5.0%, slightly less than in the previous year. Concerning the 2023 budget, revenue remained well above the initial target, resulting in a lower fiscal deficit. In addition, the government sought to support domestic demand through an economic package introduced in the fourth quarter of 2023. Last, inflation was well under the government target of 3% (with a range of 2%–4%), a declining trend in the unemployment and poverty rates continued, and the banking sector was well-buffered, with a capital adequacy ratio of around 27%.
However, notable concerns remain for Indonesia’s mediumto long-term economic prospects. Economic growth has been stuck at around 5% (Resosudarmo and Abdurohman 2018), with limited support from the investment and manufacturing sectors. Excluding 2020, the annual average of investment growth during 2015–23 was only 4.9%. Similarly, growth in the manufacturing sector was around 4.9% on average. A lack of infrastructure, a human capital gap, and poor institutional and regulatory quality are thought to be major factors hindering the attraction of investment and the improvement of the manufacturing sector ecosystem, especially for high-tech manufacturing. If unaddressed, the problems could prevent Indonesia from growing at a rate above 5%. Failing to grow by more than 6%–7% will hinder Indonesia’s efforts to become a high-income country by 2045.
Fiscal policy support is crucial for the structural transformation needed to accelerate economic growth enough for Indonesia to escape the middle-income trap. Nonetheless, fiscal policy space is limited as revenue collection capacity is relatively weak. Simultaneously, ineffective energy subsidies continue to burden the budget. Several initiatives to increase revenue capacity are underway—notably, Law 7/2021 on Tax Harmonization, which aims to reduce tax exemptions, modernise tax administration using digital technology and improve Indonesia’s alignment with the international tax system. Alternative financing for infrastructure development is also needed to ease budget pressures arising from SOEs. On the spending side, a better budgeting system and improved efficacy, as well as better alignment between central and local governments, especially in financing prioritised programs for health, education and poverty alleviation, are crucial. Transitioning away from the energy subsidy will also be critical. The subsidy funding could be redirected towards more productive initiatives to accelerate economic growth while enhancing welfare, increasing human capital and mitigating poverty.
Correction Statement
This article has been co rrected w ith m inor chang es. These chang es do not im pact the academ ic content of the article.
Notes
1 This is a budget allocation not defined as regular expenditure. Instead, it is categorised as a financing component called ‘investment financing’, aiming to support SOEs, especially in the construction sector, to construct infrastructure projects that would otherwise be financially infeasible. The investment financing also allows the government to avoid allocating additional funding to education, which would be required if regular expenditure were to increase since governments are required to allocate 20% of total spending to education. The fiscal rule that limits the deficit to a maximum of 3% of GDP under Law 17/2003 on State Finance also limits room for expansionary policy.
2 LNPRT consist of non-profit entities; many are affiliated with or serve political parties.
3 Initially, the 2023 state budget allocated Rp 2,463 trillion in spending; the preliminary outturn for 2023 was Rp 2,774.3 trillion.
4 PSNs consist of infrastructure projects conceived under former president Joko Widodo, comprising physical infrastructure projects such as toll roads, dams, railways and power plants, as well as non-connectivity infrastructure projects such as industrial estates, tourism and education.
5 This agency, known as Badan Urusan Logistik (BULOG) in Indonesia, is a statutory organisation that aims to ensure a stable rice price in the domestic market using a bufferstock mechanism.
6 Ministry of Finance Regulation 75/2012.
7 Ministry of Finance Regulation 153/2014.
8 Ministry of Finance Regulation 13/2017.
9 Minister of Energy and Mineral Resources Regulation 11/2019.
10 China has become the largest market for Indonesia’s exports. The movement of Indonesia’s trade deficit with China is similar to the movement of Indonesia’s current account deficit. Improvement in Indonesia’s trade deficit with China has helped improve Indonesia’s current account balance.
11 The 13th salary bonus is usually given in July instead of June.
13 As these GICs were generated using data from the National Socio-Economic Survey (Susenas), some limitations should be noted. First, a significant disparity is evident between the private consumption levels recorded in national accounts, upon which GDP measures are based, and the levels recorded by household consumption surveys, which provide data for the distribution of personal consumption expenditure (PCE). Household surveys often exclude non-household private consumption, such as that of prisons and orphanages. Second, Susenas may not fully capture wealthier households, potentially leading to discrepancies in the classification of middle-income groups and the wealthiest 20% of households (World Bank Citation2019). This implies that those who appear to be in the middle of the PCE distribution or the top of the PCE distribution were, in fact, lower in the distributions. Recovery from the pandemic effects has also been heterogeneous across regions.
14 Social assistance programs such as the Family Hope Program (PKH) can affect the education and health of children, which can then affect their productivity once they have entered the labour market (Cahyadi et al. Citation2020). In addition, the government launched the Pre-employment Card (Kartu Prakerja) program to provide job training to Indonesians. For more information, see Purbasari, Satriawan and Sitorus (Citation2022)
15 The government increased its projected spending in mid-2023 given the higher-thanexpected revenue.
REFERENCES
- Abimanyu, Anggito and Muhammad Handry Imansyah. 2023. ‘The Impact of Fuel Subsidy to the Income Distribution: The Case of Indonesia. Indonesian Treasury Review: Journal of Treasury, State Finance and Public Policies 8 (3): 189–203.
- ADB (Asian Development Bank). 2015. Fossil Fuel Subsidies in Indonesia: Trends, Impacts, and Reforms. Manila, Philippines: ADB.
- ADB (Asian Development Bank). 2020. Proposed Countercyclical Support Facility Loans Republic of Indonesia: COVID-19 Active Response and Expenditure Support Program. Report and Recommendation of the President to the Board of Directors, April. https://www.adb.org/sites/default/files/project-documents/54139/54139-001-rrp-en.pdf
- ADB (Asian Development Bank). 2021. ‘Institutional Arrangements for Tax Administration in Asia and the Pacific’. ADB Governance Brief 19. https://www.adb.org/sites/default/files/publication/30072/governance-brief-tax-administration-asia.pdf
- Anas, Titik, Hal Hill, Dionisius Narjoko and Chandra Tri Putra. 2022. ‘The Indonesian Economy in Turbulent Times’. Bulletin of Indonesian Economic Studies 58 (3): 241–71. https://doi.org/10.1080/00074918.2022.2133344
- Bah, Adama, Samuel Bazzi, Sudarno Sumarto and Julia Tobias. 2019. ‘Finding the Poor vs. Measuring Their Poverty: Exploring the Drivers of Targeting Effectiveness in Indonesia’. World Bank Economic Review 33 (3): 573–97. https://doi.org/10.1093/wber/lhx020
- Banerjee, Abhijit, Rema Hanna, Benjamin A. Olken, Elan Satriawan and Sudarno Sumarto. 2023. ‘Electronic Food Vouchers: Evidence from an at-Scale Experiment in Indonesia’. American Economic Review 113 (2): 514–47. https://doi.org/10.1257/aer.20210461
- Basri, M. Chatib, Mayara Felix, Rema Hanna and Benjamin A. Olken. 2021. ‘Tax Administration versus Tax Rates: Evidence from Corporate Taxation in Indonesia’. American Economic Review 111 (12): 3827–71. https://doi.org/10.1257/aer.20201237
- Bolhuis, Marijn A, Jiaqian Chen, Benjamin Kett. 2023. ‘The Cost of Geoeconomic Fragmentation’. Finance and Development, June. https://www.imf.org/en/Publications/fandd/issues/2023/06/the-costs-of-geoeconomic-fragmentation-bolhuis-chen-kett
- BPS (Statistics Indonesia). 2018. ‘Jumlah Penduduk Miskin, Persentase Penduduk Miskin dan Garis Kemiskinan, 1970–2017’ [Number of Poor in the Population, Percentage of Poor in the Population and the Poverty Line, 1970–2017]. Last updated 5 January 2018. https://www.bps.go.id/id/statistics-table/1/MTQ5NCMx/jumlah-penduduk-miskin--persentase-penduduk-miskin-dan-garis-kemiskinan--1970-2017.html
- BPS (Statistics Indonesia). 2023. ‘Profil Kemiskinan di Indonesia Maret 2023’ [Poverty Profile in Indonesia March 2023]. Berita Resmi Statistik 47/07/Th. XXVI, 17 July, Jakarta. https://www.bps.go.id/id/pressrelease/2023/07/17/2016/profil-kemiskinan-di-indonesia-maret-2023.html
- BPS (Statistics Indonesia). 2024. ‘Perkembangan Indeks Harga Konsumen Desember 2023’ [Consumer Price Index Development December 2023]. Berita Resmi Statistik 01/01/Th. XXVII, 2 January, Jakarta. https://www.bps.go.id/id/pressrelease/2024/01/02/2299/%20inflasi-year-on-year--y-on-y--pada-desember-2023-sebesar-2-61-persen--inflasi-tertinggi-terjadi-di-sumenep-sebesar-5-08-persen-.html
- Cahyadi, Nur, Rema Hanna, Benjamin A. Olken, Rizal Adi Prima, Elan Satriawan and Ekki Syamsulhakim. 2020. ‘Cumulative Impacts of Conditional Cash Transfer Programs: Experimental Evidence from Indonesia’. American Economic Journal: Economic Policy 12 (4): 88–110. https://doi.org/10.1257/pol.20190245.
- CRS (Congressional Research Service). 2023. China’s Economy: Current Trend and Issues. In Focus, 27 September. https://crsreports.congress.gov/product/pdf/IF/IF11667
- Economist. 2024. ‘Will Spiking Shipping Costs Cause Inflation to Surge?’ Finance and Economics, 11 January. https://www.economist.com/finance-and-economics/2024/01/11/will-spiking-shipping-costs-cause-inflation-to-surge
- FAO (Food and Agricultural Organization). 2023. ‘FAO Rice Market Monitor’. Markets and Trade. Accessed 12 January 2024. https://www.fao.org/economic/est/publications/rice-publications/rice-market-monitor-rmm/en/
- Fauziyah Najla Nur and Laila Afifa. 2024. ‘Nickel Downstream Leads to Uncontrollable Deforestation in North Maluku, Environmental Groups Report’. Tempo, 29 January. https://en.tempo.co/read/1827220/nickel-downstream-leads-to-uncontrollable-defor-estation-in-north-maluku-environmental-groups-report
- Financial Times. 2023a. ‘How China’s Property Crisis Has Unfolded, from Evergrande to Country Garden’. 22 October. https://www.ft.com/content/a387a533-5995-43a9-b472-ce5691969657
- Financial Times. 2023b. ‘Indian Ban on Rice Exports Stokes Fears of Global Food Inflation’. 21 July. https://www.ft.com/content/93538b51-90b8-478d-9b5f-ab228f31f65c
- Hill, Hal. 2021. ‘What’s Happened to Poverty and Inequality in Indonesia over Half a Century?’ Asian Development Review 38 (1): 68–97. https://doi.org/10.1162/adev_a_00158
- IMF (International Monetary Fund). 2022. World Economic Outlook: Countering the Cost-of-Living Crisis. October 2022. Washington, DC: IMF.
- IMF (International Monetary Fund). 2023a. ‘Download WEO Data: October 2023 Edition’. World Economic Outlook Database. Accessed 12 January 2024. https://www.imf.org/en/Publications/WEO/weo-database/2023/October
- IMF (International Monetary Fund). 2023b. Fiscal Monitor: Climate Crossroads: Fiscal Policy in a Warming World. Washington, DC: IMF. https://www.imf.org/en/Publications/FM/Issues/2023/10/10/fiscal-monitor-october-2023
- IMF (International Monetary Fund). 2023c. ‘IMF Executive Board Concludes 2023 Article IV Consultation with the United States’. Press release, 15 June. https://www.imf.org/-/media/Files/Publications/CR/2023/English/1USAEA2023001.ashx
- IMF (International Monetary Fund). 2023d. World Economic Outlook: A Rocky Recovery: April 2023. Washington, DC: IMF.
- IMF (International Monetary Fund). 2024. World Economic Outlook Update: January 2024. Washington, DC: IMF. https://www.imf.org/en/Publications/WEO/Issues/2024/01/30/world-economic-outlook-update-january-2024
- ITC (International Trade Centre). 2023. ‘Trade Map: Trade Statistics for International Business Development’. Accessed 12 January 2024. https://www.trademap.org/Index.aspx
- Kidd, Maureen and William Crandall. 2006. ‘Revenue Authorities: Issues and Problems in Evaluating Their Success’. IMF Working Paper WP/06/240. https://www.imf.org/external/pubs/ft/wp/2006/wp06240.pdf
- Kusumawati, A. S. and Toshihiro Kudo. 2019. ‘The Effectiveness of Targeting Social Transfer Programs in Indonesia.’ Indonesian Journal of Development Planning 3 (3): 282–97. https://doi.org/10.36574/jpp.v3i3.90
- Lenel, Friederike, Jan Priebe, Elan Satriawan and Ekki Syamsulhakim. 2022. ‘Can mHealth Campaigns Improve CCT Outcomes? Experimental Evidence from Sms-Nudges in Indonesia’. Journal of Health Economics 86: 102687. https://doi.org/10.1016/j.jhealeco.2022.102687
- Lewis, Blane D. 2023. ‘Indonesia’s New Fiscal Decentralisation Law: A Critical Assessment’. Bulletin of Indonesian Economic Studies 59 (1): 1–28. https://doi.org/10.1080/00074918.2023.2180838
- McCulloch, N., 2023. Ending Fossil Fuel Subsidies: The Politics of Saving the Planet. Rugby, Warwickshire: Practical Action Publishing.
- Miller, Chris. 2022. Chip War: The Fight for the World’s Most Critical Technology. London: Simon and Schuster.
- MoF (Ministry of Finance). 2023. ‘Konferensi Pers Realisasi dan Kinerja APBN 2023’ [Press Conference on the Realisation and Performance of the 2023 APBN]. Presentation, Jakarta, posted to YouTube on 4 January 2024. https://www.youtube.com/watch?v=vM7xA_gUtoE
- Negara, Siwage Dharma and Agustinus Prasetyantoko. 2023. ‘Managing the Debts of State-Owned Enterprises: Case Studies of Indonesia’s BUMN Karya’. ISEAS Perspective 100 (2024): 1–13. https://www.iseas.edu.sg/articles-commentaries/iseas-perspective/2023-100-man-aging-the-debts-of-state-owned-enterprises-case-studies-of-indonesias-bumn-karya-by-siwage-dharma-negara-agustinus-prasetyantoko/
- OECD (Organisation for Economic Co-operation and Development). 2022. Society at a Glance: Asia/Pacific 2022. Paris: OECD Publishing. https://doi.org/10.1787/7ef894e5-en
- OECD (Organisation for Economic Co-operation and Development). 2023. Revenue Statistics in Asia and the Pacific 2023. https://doi.org/10.1787/7ef894e5-en
- OJK (Financial Services Authority). 2023. ‘The Financial Services Sector Remained Stable in Anticipating Higher for Longer Global Interest Rates’. Press release, 10 October. https://www.ojk.go.id/iru/policy/detailpolicy/11449/press-release-the-financial-services-sector-remained-stable-in-anticipating-higher-for-longer-global-interest-rates
- Patunru, Arianto A. 2023. ‘Trade Policy in Indonesia: Between Ambivalence, Pragmatism and Nationalism’. Bulletin of Indonesian Economic Studies 59 (3): 311–40. https://doi.org/10.1080/00074918.2023.2282821
- Purbasari, Denni Puspa, Elan Satriawan and Romora Edward Sitorus. 2022. ‘Kartu Prakerja: A Breakthrough for Boosting Labour Market Productivity and Social Assistance Inclusiveness’. In Keeping Indonesia Safe from the COVID-19 Pandemic: Lessons Learnt from the National Economic Recovery Programme. Edited by Sri Mulyani Indrawati, Suahasil Nazara, Titik Anas, Candra Fajri Ananda and Kiki Verico, 291–317. Singapore: ISEAS Publishing. https://doi.org/10.1355/9789815011623.
- Resosudarmo, Budy P. and Abdurohman. 2018. ‘Is Being Stuck with a Five Percent Growth Rate a New Normal for Indonesia?’ Bulletin of Indonesian Economic Studies 54 (2): 141–64. https://doi.org/10.1080/00074918.2018.1521776
- Sachs, Jeffrey D., Guillaume Lafortune, Grayson Fuller and Eamon Drumm. 2023. Sustainable Development Report 2023: Implementing the SDG Stimulus. Dublin: Dublin University Press. https://sdgtransformationcenter.org/reports/sustainable-development-report-2023
- Satriawan, Elan and Ranjan Shrestha. 2019. ‘Mistargeting and Regressive Take Up of the Indonesian Rice Subsidy Program: Regressive Indonesian Rice Subsidy’. Asian Economic Journal 32: 387–415. https://doi.org/10.1111/asej.12164
- Sim, Armand, Radi Negara and Asep Suryahadi. 2015. ‘Inequality, Elite Capture, and Targeting of Social Protection Programs: Evidence from Indonesia’. SMERU Working Paper, SMERU Research Institute, Jakarta.
- Tan, CK, Kenji Kawase and Grace Li. 2024. China in Charts: Missing Economic Boom Points to Slowing Post-COVID Growth. Nikkei Asia 30 August. https://asia.nikkei.com/Spotlight/The-Big-Story/China-in-charts-Missing-economic-boom-points-to-slowing-post-COVID-growth
- Tohari, Achmad, Christopher Parsons and Anu Rammohan. 2019. ‘Targeting Poverty under Complementarities: Evidence from Indonesia’s Unified Targeting System’. Journal of Development Economics 140: 127–44. https://doi.org/10.1016/j.jdeveco.2019.06.002
- Weber, Alexander. 2024. ‘Euro Zone Stagnates at Year-End as Industry Shows Improvement’. Bloomberg, 14 February. https://www.bloomberg.com/news/articles/2024-02-14/euro-zone-stagnates-at-year-end-as-industry-shows-improvement
- Widi, Hendriyo and Agustinus Yoga Primantoro. 2023. ‘El Nino Hampers the Rate of Decline in Food Inflation’. Kompas, 21 September. https://www.kompas.id/baca/english/2023/09/20/en-el-nino-hambat-laju-penurunan-inflasi-pangan
- World Bank. 2019. Aspiring Indonesia: Expanding the Middle Class. Washington, DC: World Bank. https://openknowledge.worldbank.org/bitstream/handle/10986/33237/Aspiring-Indonesia-Expanding-the-Middle-Class.pdf?sequence=1&isAllowed=y
- World Bank. 2020. Indonesia Economic Prospects: The Long Road to Recovery. Indonesia Economic Prospects. Jakarta: World Bank. https://documents1.worldbank.org/curated/en/804791594826869284/pdf/Indonesia-Economic-Prospects-The-Long-Road-to-Recov-ery.pdf
- World Bank. 2022. Financial Deepening for Stronger Growth and Sustainable Recovery. Indonesia Economic Prospects. Jakarta: World Bank. https://www.worldbank.org/en/country/indonesia/publication/indonesia-economic-prospects-iep-june-2022-financial-deep-ening-for-stronger-growth-and-sustainable-recovery#:~:text=The%20Indonesian%20economy%20is%20projected,and%20improved%20terms%20of%20trade
- World Bank. 2023. Global Economic Prospects: June 2024. Washington, DC: World Bank.
- World Bank. 2024. Global Economic Prospects: January 2024. Washington, DC: World Bank. https://www.worldbank.org/en/publication/global-economic-prospects