
 ?Mathematical formulae have been encoded as MathML and are displayed in this HTML version using MathJax in order to improve their display. Uncheck the box to turn MathJax off. This feature requires Javascript. Click on a formula to zoom.
Abstract
While in recent times many regions have flourished, many others are stuck—or are at risk of becoming stuck—in a development trap. Such regions experience decline in economic growth, employment, and productivity relative to their neighbors and to their own past trajectories. Prolonged periods in development traps are leading to political dissatisfaction and unrest. Such discontent is often translated into support for antisystem parties at the ballot box. In this article we study the link between the risk, intensity, and duration of regional development traps and the rise of discontent in the European Union (EU)—proxied by the support for Eurosceptic parties in national elections between 2013 and 2022—using an econometric analysis at a regional level. The results highlight the strong connection between being stuck in a development trap, often in middle- or high-income regions, and support for Eurosceptic parties. They also suggest that the longer the period of stagnation, the stronger the support for parties opposed to European integration. This relationship remains robust whether considering only the most extreme Eurosceptic parties or including parties with more moderate levels of Euroscepticism.
Popular discontent has been brewing in many parts of the world, including most of Europe (Greven Citation2016; Zakaria Citation2016; Hawkins et al. Citation2019; Hopkin Citation2020). The rising wave of dissatisfaction with a system that many feel no longer benefits them is manifested in different ways: from declining participation in elections to low citizen engagement in civil society. Growing discontent is also reflected in (1) an increasing tendency to support more extreme, often populist options at the ballot box; and (2) mounting signs of distress and outright revolt by those disaffected from the system (Kitschelt Citation2002; Rodríguez-Pose Citation2018). In the EU, this disaffection is connected to a rise of Euroscepticism (Torreblanca and Leonard Citation2013; Dijkstra, Poelman, and Rodríguez-Pose Citation2020). Since the 2008 financial crisis, the share of votes in national legislative elections for hard EuroscepticFootnote1 parties has more than trebled from 4 percent in 2002 to 14 percent of the electorate in 2022. If we include soft Eurosceptic parties, their combined vote share has almost quadrupled from around 7 percent to 27 percent.
The rise of Euroscepticism is part of a broader recent increase in popularity of antisystem and/or populist parties (Hopkin Citation2020). Explanations of this turn in the electorate can be classified into two camps. On the one hand, there are those who posit that the rise of electoral discontent at both extremes of the political spectrum is the result of the reemergence of identity issues and culture wars (e.g., Norris and Inglehart Citation2019). The second camp contends that the appeal of antisystem and/or populist parties is connected to long-term decline in places that once experienced greater prosperity (e.g., Autor, Dorn, and Hanson Citation2016; Becker, Fetzer, and Novy Citation2017; Fetzer Citation2019). According to this view, economic and demographic stagnation have fueled the perception that the future is less bright in those areas that have lost their past dynamism. But explanations that rely either on cultural or on economic or demographic decline are not mutually exclusive (Noury and Roland Citation2020; Schmidt Citation2022). People living in declining places frequently feel trapped in regions they think no longer matter and where they perceive there is (or they have) no future (Rodríguez-Pose, Citation2018, Citation2020; Lenzi and Perucca Citation2021). Many people in these regions feel ignored, neglected, and marginalized by a distant and aloof elite (McKay, Jennings, and Stoker Citation2021), and are ill at ease with a changing world they consider threatens their identity and security.
The article builds on research conducted by Diemer et al. (Citation2022) on the development trap, since much of the rise in discontent is concentrated in trapped regions. Diemer et al. (Citation2022, 487) define development trapped regions as those facing “significant structural challenges in retrieving past dynamism or improving prosperity for their residents.” These regions have lower economic growth compared to the EU average, the country they are located in, and/or their own previous performance. Growth is measured using three indicators: gross domestic product (GDP) per capita, employment, and productivity. A classic example of a region in a development trap is one that initially experienced rapid growth, reaching middle-income levels (Kharas and Kohli Citation2011). However, many regions in Europe have stagnated or even regressed at all stages of development.
The article delves deeper into the notion of the development trap by exploring two critical questions: (1) does the likelihood, severity, and duration of a regional development trap incite regional discontent; and (2) can the origins of Euroscepticism be linked to regions ensnared in a development trap? Previous research has established a link between long-term economic and industrial decline, low employment rates, demographic decline, and the rise of Eurosceptic, populist, and antisystem voting (Dijkstra, Poelman, and Rodríguez-Pose Citation2020; McCann Citation2020; Pinilla and Sáez Citation2021; Rodríguez-Pose, Lee, and Lipp Citation2021). However, there has been no attempt to connect the broader idea of a regional development trap with the increasing appeal of extreme and Eurosceptic parties at the ballot box. This article addresses this gap by linking the phenomenon of the regional development trap to the growing rise of Euroscepticism in the EU.
Our analysis demonstrates that falling into a development trap is possibly the strongest driver of the rise in discontent and the increasing support for Eurosceptic voting across European regions. Inhabitants of trapped regions—particularly at high- and middle-income levels—are more likely to be tempted by both hard and soft Eurosceptic political options, and to support them in elections. Furthermore, factors, such as the risk, intensity, and duration of the development trap, significantly increase the Eurosceptic vote.
To reach these conclusions, this article first discusses the rise of Euroscepticism in Europe in the last two decades, before turning to what have been the drivers, according to scholarly research, of the rise of a geography of discontent against European integration. The following section introduces the concept of the development trap in the EU. This is followed by a section that presents the empirical model, data, and methodology used for this analysis, followed by the econometric results. The article concludes with some preliminary and necessarily cautious policy discussion and a reflection of the implications of the analysis for economic and political geography.
The Rise of Euroscepticism
Euroscepticism has been on the rise. It generally grew from parties—such as the French National Front, the Austrian Freedom Party, the Danish Progress Party, the German Republicans, or the Greek Communist Party—with histories as antisystem movements and/or traditions of illiberalism. Initially, their opposition was primarily directed at national governments rather than European institutions (Betz Citation1993). Later—and without renouncing their stance against national elites—their Euroscepticism has grown. Yet, throughout most of the 2000s, support for parties opposed or strongly opposed to European integration remained low, despite many of the above-mentioned parties already having a presence in the European Parliament. This is because they garnered a higher share of votes in European than in national elections. European elections are generally considered by political scientists as second-order elections (Reif, Schmitt, and Norris Citation1997) and tend to have lower turnout and fewer votes for mainstream parties compared with national elections. However, when it came to national legislative elections, support for Eurosceptic parties historically remained rather muted.Footnote2
Because of the second-order nature of European elections, in this article, we focus on national elections rather than European ones and combine Eurosceptic votes into two categories based on the Chapel Hill Expert Survey (CHES) (Jolly et al. Citation2022). We define hard Euroscepticism as support for parties opposed or strongly opposed to EU integration. This threshold includes parties that not only oppose but also fundamentally challenge core aspects of European integration like monetary union or the supremacy of European law. Some of the parties in this hard Eurosceptic group are the Forum for Democracy or the Party for Freedom in the Netherlands; the Rassemblement National or Débout La France in France; the Lega per Salvini, Fratelli d’Italia, or Italexit per l’Italia in Italy; Alternative für Deutschland in Germany; Gibanje Zedinjena Slovenija and Domovinska Liga in Slovenia; the Danish People’s party in Denmark; and Vlaams Belang in Belgium.
The second category is broader. It includes both soft and hard Euroscepticism, encompassing parties somewhat opposed to those strongly opposed to European integration. This wider categorization captures a more comprehensive range of Eurosceptic sentiments. Soft Eurosceptic parties do not advocate for the exit of their countries from the EU but oppose specific aspects of European integration or European policies. Among the parties categorized as soft Eurosceptic using the CHES classification are the Socialist Party in the Netherlands; la France Insoumise, the French Communist Party, or Reconquête! in France; Fidesz in Hungary; the Law and Justice Party in Poland; the Five-Star Movement in Italy; or Vox in Spain.
The list of Eurosceptic parties incorporates parties at both the extreme right and extreme left of the political spectrum. By contrast, most traditional, mainstream, moderate left-wing and right-wing parties are strongly pro-European.Footnote3
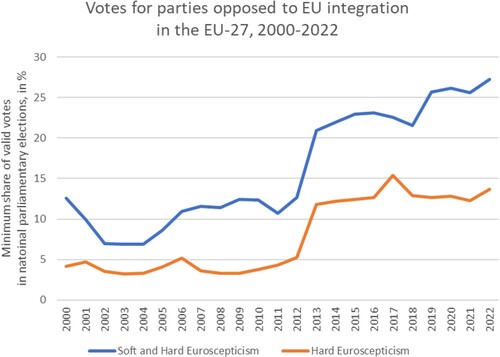
Support for hard Eurosceptic parties remained below 5 percent throughout most of the 2000s. Soft and hard Eurosceptic parties received, on average, around 10 percent of the vote in this period (). The financial crisis and the reaction to austerity saw a rapid increase in the vote for Eurosceptic parties. Support for hard Eurosceptic parties in national parliamentary elections has mostly remained below 15 percent of the vote since 2013. But the share of the combined soft and hard Eurosceptic support has continued to rise, reaching 27 percent in 2022 (). The Brexit vote and its consequences for the UK and Europe may have reduced the appeal of hard Euroscepticism but not that of soft Euroscepticism.
Figure 1. Votes for parties opposed to EU integration in national parliamentary elections in the EU-27, 2000–2022.
Source: Directorate-General for Regional and Urban Policy (DG REGIO) calculations based on the CHES (Jolly et al. Citation2022) and DG REGIO data collection.
Note: Hard Euroscepticism is defined as a score of 2.5 or lower on the EU-position index. Soft and hard Euroscepticism is defined as a score of 3.5 or lower on the EU-position index.
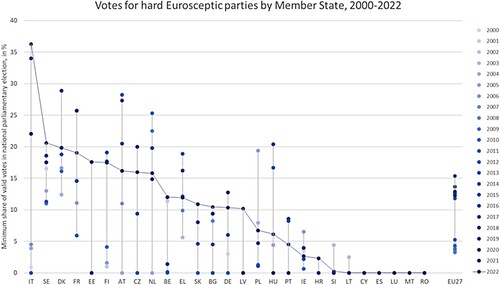
Hard Euroscepticism does not affect all EU countries in the same way. Romania, Malta, Luxembourg, Spain, Cyprus, and Lithuania have virtually no parties that advocate an end to the European project or that propose the withdrawal of their country from the EU. By contrast, support for hard Eurosceptic parties has become prominent in national elections in Italy, Sweden, Denmark, and France (). As indicated by the prevalence of darker shades in the upper echelons of , hard Euroscepticism has grown as the twenty-first century has progressed. The main exceptions to this are Lithuania, Hungary, Slovenia, and Poland. In the cases of Hungary and Poland, the changes over time reflect changes in the views of the EU held by some of the major parties. This means that although the share of votes for hard Eurosceptic parties is lower than in some of the previous elections, the vote share for soft and hard Euroscepticism combined is now above 50 percent.
Figure 2. Votes for hard Eurosceptic parties per Member State, 2000–2022.
Source: Calculations by authors based on the CHES (Jolly et al. Citation2022) and own data collection.
This figure shows all parliamentary elections in the years between 2000 and 2022. If multiple years have the same value, only the most recent year is visible.
Note: Hard Euroscepticism is defined as a score of 2.5 or lower on the EU-position index.
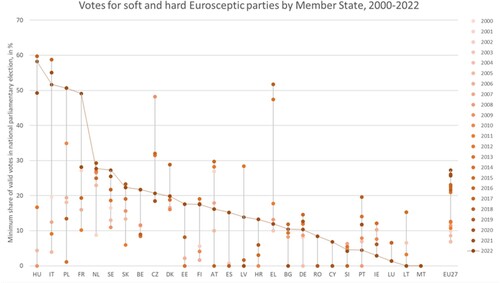
The combined votes for soft and hard Eurosceptic parties also vary considerably by country. The height of the austerity crisis in 2012 resulted in a significant increase in support for soft and hard Eurosceptic parties and, as highlighted earlier, this trend continues. Soft and hard Euroscepticism are pervasive in countries that, at the time of writing, are governed by Eurosceptic parties or coalitions such as Hungary or Italy, or have been in that situation until recently such as Poland. These forms of Euroscepticism are also strong in France and growing in the Netherlands, Sweden, Belgium, and Slovakia (). Malta is the only country where support for Eurosceptic parties has remained negligible.
Figure 3. Votes for soft and hard Eurosceptic parties by Member States, 2000–2022.
Source: Calculations by authors based on the CHES (Jolly et al. Citation2022) and own data collection.
This figure shows all parliamentary elections in the years between 2000 and 2022. If multiple years have the same value, only the most recent year is visible.
Note: Soft and hard Euroscepticism is defined as a score of 3.5 or lower on the EU-position index.
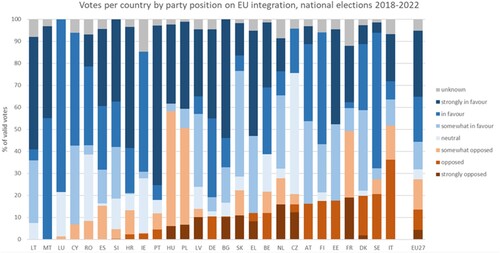
Overall, the backing for hard and soft Eurosceptic parties in the latest round of national legislative elections (2018-2022) is on the rise across the EU. Euroscepticism is supported by 27 percent of the total electorate. In four countries—Hungary, Italy, Poland, and France—Eurosceptic parties represent half of those voting. Elsewhere in the EU (), support for Eurosceptic options drops, but still remains above 25 percent in the Netherlands and Sweden, and above 20 percent in Belgium. Lithuania and Malta were the only countries that did not register votes for Eurosceptic parties in the last round of national parliamentary elections.
Figure 4. Votes in national legislative elections by party position on EU integration (2018–2022).
Source: Calculations by authors based on the CHES (Jolly et al. Citation2022) and own data collection.
The distribution of the vote for hard and soft Eurosceptic parties also varies within countries. shows the distribution of the vote for both hard Eurosceptic parties and for soft and hard Eurosceptic parties combined during the most recent election round (2018-2022). In some cases, the variation in support for Eurosceptic parties is minimal within countries. This is especially the case in countries where Euroscepticism is limited.
Figure 5. Votes for hard Eurosceptic parties and for hard and soft Eurosceptic parties for the most recent parliamentary elections, 2018–2022.
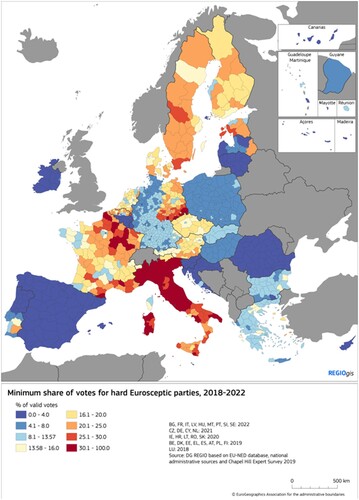
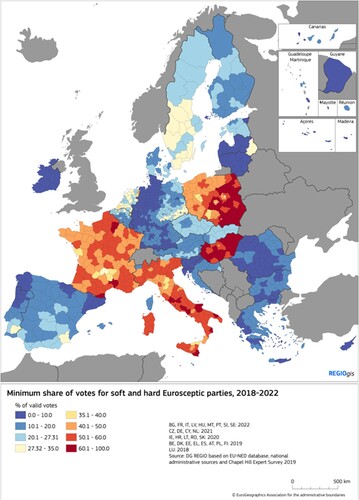
In countries with significant support for Eurosceptic parties, regional variations in support for Euroscepticism are more common. In France, for example, the support for hard Eurosceptic parties is concentrated in the northeast and along the Mediterranean coast. It is far weaker in the two largest urban areas (Paris and Lyon) as well as in Brittany and in rural southern France. Soft and hard Euroscepticism combined is more evenly spread but again weaker in some southern rural departments. The regional contrast in Germany fundamentally concerns hard Euroscepticism and follows the old border between east and west Germany. Support for soft and hard Euroscepticism is higher in the east, with Berlin and other large cities representing the exceptions. In Belgium, the Eurosceptic divide mostly follows the regional and linguistic border between Flanders and Wallonia, with Euroscepticism being stronger among Dutch-speaking Belgians. In Poland, the large metropolitan areas vote less for Eurosceptic parties than their surrounding regions. Soft and hard Euroscepticism also reflect the difference between the eastern and western parts of Poland. Euroscepticism is more prevalent in the east, with the exception of the large cities, including Warsaw, Łódź, and Kraków.
The Drivers of Discontent
What factors drive Europe-wide discontent? Why have some countries and regions seen such an increase in the Eurosceptic vote, while others have remained relatively unaffected by this trend? As indicated in the introduction, explanations for the rise in discontent in the world can be classified into two categories.
The first one emphasizes cultural and identity issues (Norris and Inglehart Citation2019; Bornschier et al. Citation2021). As Western societies have become more diverse and inclusive, and as progressive values dominate, certain sections of society have become ill at ease with these changes. Some people are uncomfortable with the new dominant values relative to those that prevailed when they were young. Others are unable or unwilling to adapt to those changing values. And the rest are anxious about a society that looks quite different from their own recollection of the past. They dislike these transformations that make them feel like strangers in their own land (Hochschild Citation2016).
This cultural and identity justification has a demographic and territorial dimension. On the one hand, some demographic groups are deemed far less capable of adapting to changes (Koeppen et al. Citation2021). For example, some scholars argue that the older we become or the less educated we are, the more difficult it is to adapt to changes in society. Hence, regions in Europe with a concentration of older people and with a less educated population are more susceptible to the arguments of Eurosceptic parties. Similar views about resistance to change have been made about places where population mobility has been limited. Places where most people are locally rooted (i.e., living in, or near to, the place where they were born) have been hotbeds of discontent and resentment (Lee, Morris, and Kemeny Citation2018). Urban societies are considered more malleable and adaptable, meaning that discontent can take hold to a far greater extent in rural areas than in urban ones (de Lange, van der Brug, and Harteveld Citation2023). Eurosceptic voting has been shown to be higher in rural regions even after correcting for a range of economic, social, and territorial characteristics (de Dominicis, Dijkstra, and Pontarollo Citation2022).
A second category of explanations links discontent with economic and demographic decline (e.g., Rodríguez-Pose Citation2018; McCann and Ortega-Argilés Citation2021; Albanese, Barone, and de Blasio Citation2022). A growing body of scholarly research traces the origins of discontent to prolonged periods of relative economic and demographic stagnation in places struggling to adapt to the challenges brought about by globalization; trade integration (Autor, Dorn, and Hanson Citation2016); and, more recently, the green and digital transitions (Rodríguez-Pose and Bartalucci, Citation2023). Places that have lost out in terms of economic growth and industrial production (Dijkstra, Poelman, and Rodríguez-Pose Citation2020; Pike Citation2022), and witnessed considerable employment (Rodríguez-Pose, Lee, and Lipp Citation2021) and demographic decline (Pinilla and Sáez Citation2021), have been receptive to feelings of discontent. In Europe, these feelings have resulted in stronger support for Eurosceptic parties. And discontent rises the greater the intensity and the longer the duration of the region’s relative decline (Dijkstra, Poelman, and Rodríguez-Pose Citation2020; Rodríguez-Pose, Lee, and Lipp Citation2021).
Cultural and economic factors interact with one another (Noury and Roland Citation2020) and often coincide in terms of geography. Large metropolitan agglomerations have, in general, remained dynamic, both from a population growth/change and from an economic perspective. Metro areas are also places with more diverse populations and where progressive ideas are more likely developed and diffused. By contrast, smaller cities, towns, and rural areas often combine a lack of economic dynamism with low diversity (Kenny and Luca Citation2021), meaning that both main factors for the rise in discontent and Euroscepticism are present. Overall, discontent is the result of a series of multilayered influences involving the adverse effects of (1) living in places that don’t matter, (2) being a person with many of the characteristics of people who do not matter, and (3) dealing with contexts where some people matter less than others (Lenzi and Perucca, Citation2021) that is disadvantaging single individuals within their reference communities. This latter aspect goes beyond individual cultural and identity characteristics (2) and demographic and economic decline (1), and emphasizes the role of intraregional inequalities, highlighting that broader societal and institutional contexts can exacerbate feelings of political marginalization, institutional neglect, and social exclusion.
The Regional Development Trap and Discontent
Research focusing on economic and demographic decline has analyzed different dimensions of decline individually. The result of this is that the complexity of trajectories of decline remains overlooked (Blažek et al. Citation2020). Declines in GDP per capita, employment, wages, industrial output, innovation, or population have been considered in isolation, overlooking that decline is a multifaceted and self-reinforcing process. Places that suffer long-term stagnation and/or decline across multiple dimensions are far more likely to breed discontent than areas where one dimension of decline prevails. In this respect, recent research (Iammarino et al. Citation2020; Diemer et al. Citation2022) has introduced the concept of the regional development trap, which captures different economic dimensions of decline. The combination of these dimensions may better explain the rise of discontent and Euroscepticism than each of its constituent elements individually.
The regional development trap has been defined as “the state of a region unable to retain its economic dynamism in terms of income, productivity, and employment, while also underperforming its national and European peers on these same dimensions” (Diemer et al. Citation2022, 489). A region thus falls into a development trap if the prosperity of its inhabitants “does not improve relative to its past performance and the prevailing economic conditions in national and European markets” (Diemer et al. Citation2022, 490). Diemer et al. (Citation2022) measure the development trap along three dimensions: income, productivity, and employment. They assess the performance of European regions on these three dimensions relative to the region itself in the past and its national and European peers.
The authors propose two alternative measurements of the regional development trap. The most basic index (which they call development trap index 1, or DT1) captures whether a region’s growth in GDP per head, productivity, and employment is (1) slower than in the EU, (2) slower than in the country of which the region is a part, and/or (3) slower than in the same region in the past. This results in nine (3 × 3) growth comparisons. The risk of falling into a development trap (trap risk from here onward) measures the number of growth comparisons on which a region performs poorly. The second development trap index (or DT2) considers the intensity of the trap risk of a particular region. This latter index allows for greater variation depending on the degree of stagnation of every region but is far more sensitive to outliers. The authors identify DT1 as their preferred index.Footnote4
Why are trapped regions more likely to breed discontent? Several reasons explain the link between economic stagnation and the growing frustration and disaffection spreading throughout Europe. First, as in any great Greek or Shakespearean tragedy, discontent is far more likely to grow among those who once had something and lost it than among those who never had anything. In a similar way, territories that have stagnated or even gone into economic reverse can be sites of greater discontent than those that have always lagged behind. Hence, relative economic decline is more important than low absolute levels of development as a driver of disaffection with the system. The development trap index also takes into account relative performance. Perceptions of development by individuals are mostly relative (Larsson, Öner, and Sielker, Citation2021). Absolute standards of living and well-being in Europe have increased considerably. However, the expansion in prosperity has not taken place at the same rate everywhere. Whereas many countries in Central and Eastern Europe raced ahead in economic terms after the collapse of communism and accession to the EU, large swaths of northeastern and eastern France and most of Italy and Greece struggled to keep up with the pace of the rest of Europe. Many of these latter areas even experienced absolute declines in GDP since 2000 (McKinsey Global Institute Citation2023). People in trapped areas realize that not only are they doing worse in terms of economic, employment, and productivity growth than in the past, they also realize that their neighbors in other regions within their countries (or in other countries) are performing better. They sense that they are both worse off than they were and worse off than other Europeans. Therefore, they are less likely to support a system and political options that they feel are not delivering for them.
The second dimension to consider in the link between economic stagnation/decline and the rise of discontent is that of the intensity of the trap. People in places where income has suffered the greatest relative decline, where employment prospects are far lower than in neighboring regions, and where productivity has hardly increased for decades are bound to consider that their life chances are considerably worse than those of people living in more dynamic areas. They will also believe that life has handed them a bad set of cards. The lack of opportunities they have endured simply because of the place where they were born or live is not only preventing them from prospering, it is also thwarting their chances of finding better opportunities elsewhere.
Finally, the longer the length of time in a trap, the more difficult it becomes for individuals in trapped places to escape it, both individually and collectively. Extended periods in a trap lead to deteriorating conditions, opportunities, and basic services. In long-term trapped places, basic facilities, such as education, health, infrastructure, transport, or public services,Footnote5 have deteriorated over time. Those in long-term-trapped places lack opportunities relative to people elsewhere and are left with a feeling of being stuck in places that don’t matter.
As a result, people in regions that have lost their edge, where opportunities have declined, and where the provision of basic goods and services is worse than what it once was are at the forefront of the rise in discontent. And the level of discontent is commensurate to the intensity of the slump and to the length of time the region has spent in the development trap. It is not only the fact of being in a development trap that is important but also its intensity and length.
Regional Development Traps in Europe
To capture a development trap, we use three indices developed by Diemer et al. (Citation2022), but we calculate them for NUTS-3 regions instead of NUTS-2 and for the period preceding the last round of elections (2001–2018). The three indices capture (1) the risk, (2) the intensity, and (3) the length of such a trap:
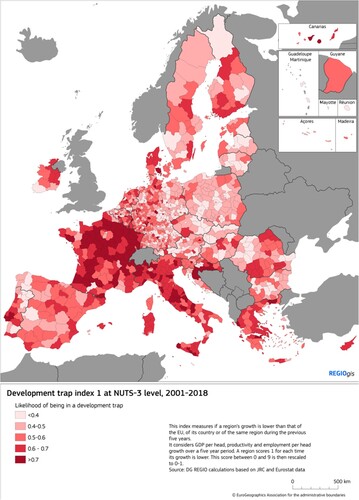
To measure the trap risk, we compare a region’s growth rate over the previous five years across three indicators (GDP per head, productivity, and employment over total population) against three geographic scales (the EU, the country the region belongs to, and the region’s own historic performance). For each comparison, a region scores 1 if it is lower and 0 if it is higher. These scores are added up to a score between 0 and 9, which is subsequently rescaled to a score between 0 and 1. Diemer et al. (Citation2022) refer to this as DT1. This indicator is measured for four periods: 2018, 2015–2018, 2010–2018, and 2001–2018.
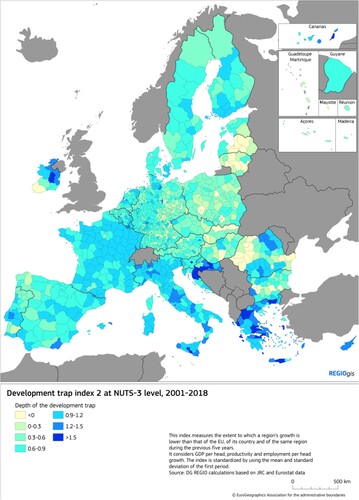
The intensity of the trap is calculated by DT2. This indicator captures the magnitude/intensity of the deviations in income, employment, and productivity growth relative to the region itself, the country, and the EU. We consider DT2 over the same time horizons as DT1.
The length of time spent in the trap is identified by including longer periods of time starting in 2001 for DT1 and DT2 but also more explicitly by counting the years a region has been in a trap since 2001 and 2010. A region is trapped if it has a DT1 above 0.5 in a given year.
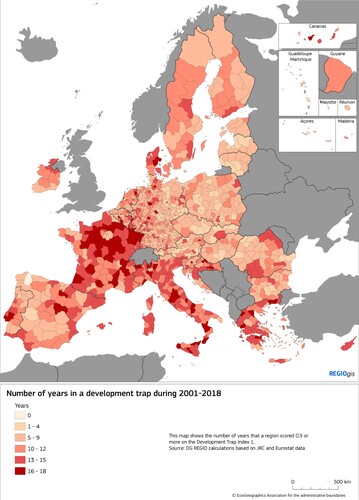
shows the trap risk (DT1) for the period 2001–2018. It reveals considerable variations both across and within countries.
Figure 6. EU regions in a development trap (DT1) (2001–2018).
On the intensity of the trap (DT2) over the same period, the picture that emerges is somewhat different (). Here, the general tendencies observed when identifying trapped regions (DT1 in ) are still in evidence. The intensity of the trap is lower in Central and Eastern Europe, and especially in Latvia, Lithuania, and some parts of Romania and Slovakia. However, it is far higher overall in Italy and France. The deepest traps (i.e., the most intense) are found in Croatia and Greece.
Figure 7. Intensity of the development trap (DT2) (2001–2018).
Finally, the length of time spent in a development trap across regions in Europe is depicted in . Once again, the geography of the length of time in a trap is highly varied.
Figure 8. Duration of the development trap (years spent in a trap) (2001–2018).
The Model, Data, and Method
To what extent are the risk, intensity, and duration of a regional development trap drivers of discontent in the EU? Can the roots of Euroscepticism be traced to places stuck in a development trap?
Our main period of interest is that of the national legislative elections between May 2018 and October 2022. If multiple elections took place in that period, we use the most recent one. To verify whether these same correlations hold for earlier elections, we also analyze the elections between May 2018 and October 2022 in combination with the elections between September 2013 and April 2018.
Model
To answer the above questions, we examine the link between Euroscepticism and the presence of development traps using the following empirical model:
(1)
(1) where
represents the share of votes for hard only or for hard and soft combined—depending on the analysis conducted—Eurosceptic parties in region r at time t. Time t covers two waves of national election cycles across all EU countries.
illustrates the risk, intensity, and length of the development trap in any given European region, measured by DT1, DT2, and the number of years in a development trap, respectively.
depicts a vector of cultural and economic factors that, according to scholarly research on antisystem voting and populism, could be at the root of the rise in discontent and, therefore, of the Eurosceptic vote. The more cultural controls include (1) the migration balance in a region (Ford and Jennings Citation2020; Di Matteo and Mariotti Citation2021), (2) the share of foreigners born in another EU country or outside the EU, (3) the share of the older population (Ford and Jennings Citation2020), or (4) the level of education of adults in a given region (Ford and Jennings Citation2020). Other controls are of a more economic nature, including the wealth of the region or its employment rate (Di Matteo and Mariotti Citation2021). Other controls reflect geography or variations in the regional ecosystem such as the average neighborhood population density (Rodden Citation2019; Rickardsson Citation2021) or the regional quality of government (Díaz-Lanchas, Sojka, and Di Pietro Citation2021).
The considers that not all parties running in national legislative elections have been classified according to their degree of Euroscepticism in the CHES. The share of votes going to parties not classified in the CHES varies between a maximum of slightly over 15 percent of the total share of votes cast in Ireland to 0 percent in Slovenia and less than 2 percent in Poland, Belgium, and Sweden ().
Finally, represents the error term, or the share of variation in Eurosceptic vote that is not adequately explained by the variables included in the analysis. The model is run without country fixed effects, as one of the components of the development trap index involves weighting the performance in income, employment, and productivity of each region in the analysis relative to the country it belongs to.
Data
Using the views of the experts involved in the CHES, we distinguish two types of Eurosceptic votes. These experts examine the electoral programs of the different parties running in national legislative elections against a series of dimensions, including the parties’ views on European integration. Each party is classified by multiple experts on a scale from 1 to 7: 1 means a party strongly opposes European integration; 4 means it is neutral on this topic; and 7 means it strongly supports European integration. As indicated earlier, we make a distinction between hard and soft Eurosceptic parties. Hard Eurosceptic parties are strongly opposed or opposed to European integration. They have an average score of less than 2.5 on the CHES 2019 EU-position index. Soft Eurosceptic parties are somewhat opposed. They have an average score between 2.5 and 3.5. We use these to create two dependent variables: the first variable covers only the hard Eurosceptic votes; the second variable covers both the hard and the soft Eurosceptic votes. Table A1 in the online material presents the parties covered, together with their score on EU integration on the CHES scale and the year of election.
The independent variable of interest covers three distinct aspects of the development trap: (1) the risk of falling into a trap, (2) the intensity of the development trap, and (3) the length of time a region has spent in a development trap.
Finally, we include a series of controls depicting factors that potentially cause discontent. These factors comprise GDP per capita in any given region at the beginning of the period of analysis, as the wealth of regions may affect the extent to which the people living in those regions are happy with the system. Employment in industry—measured as the share of manufacturing in a region—has been connected with growing discontent, especially in cases where such manufacturing employment has declined (Dijkstra, Poelman, and Rodríguez-Pose Citation2020; Pike Citation2022). Migration has also been repeatedly highlighted as a trigger of discontent (Rickardsson Citation2021). We measure it as the average annual share of net migration per one thousand residents in a region over the period of analysis. We include the share of the population aged fifteen or above born in another EU Member State or outside the EU. An aging population has also been identified as being linked with voter discontent (Goodwin and Heath Citation2016). Our proxy for aging is the share of population aged sixty-five and over in a region. We also consider the level of education in a region, measured as the share of adults (defined as those between the ages of twenty-five and sixty-four) with a higher education diploma (i.e., university or postsecondary school). Density, regarded by Rodden (Citation2019) as another factor explaining differences in populist voting, is measured as the population-weighted average population density of a grid with cells of one square kilometer. This captures the density of the neighborhood (defined as a square of 1 × 1 km) in which an average person in that region lives.
We finally control for employment, as regions with more people in jobs are bound to suffer less from discontent, and quality of government, measured using the regional quality-of-government index proposed by the Quality of Government Institute in Gothenburg for 2017 (or 2013, depending on the regression) (Charron, Lapuente, and Annoni Citation2019). This indicator has become the most used measure of institutional quality at a regional level for Europe (e.g., Ketterer and Rodríguez-Pose Citation2018; Rodríguez-Pose and Ketterer Citation2020). Table A2 in the online material contains the variables used in the analysis, their definition, and their sources.
The unit of analysis is the EU region at the finest geographic scales for which data are broadly available: Nomenclature of Statistical Regions Data at level 3 (NUTS-3) regions. The maximum total number of regions covered by the data is 1,166.
Method
Three econometric methods are used. For research covering just the latest electoral period for which data are available at the time of writing (2018–2022), we use an ordinary least squares (OLS) estimation of model (1). The advantages of using OLS are its simplicity and flexibility. OLS is one of the most straightforward and comprehensive econometric methods, with coefficients that are easy to interpret. It is also efficient, since it tends to have the smallest variance among linear unbiased estimators, yielding more precise estimates of the parameters.
When considering the two latest national election cycles (2013–2018 and 2018–2022), we use pooled OLS. Pooled OLS has the same advantages as OLS, while simultaneously making it possible to exploit the combinations of the cross-sectional and time-series dimensions of the data.
The likelihood of encountering endogeneity problems in our estimations is limited, since the rise of Euroscepticism is, as described earlier, a relatively recent phenomenon. However, to address potential endogeneity—where not just the development trap may influence the rise of Euroscepticism, but also Euroscepticism affects the risk of a region being trapped—we resort to instrumental variable (IV) analysis. Our instruments involve the prevalence of historic family structures in a region—and, in particular, the presence of absolute nuclear and communitarian families—as Duranton, Rodríguez-Pose, and Sandall (Citation2009) propose. Appendix 3 in the online material provides the rationale for the IV analysis and the results (Table A3).
The Regional Development Trap and the Geography of EU Discontent
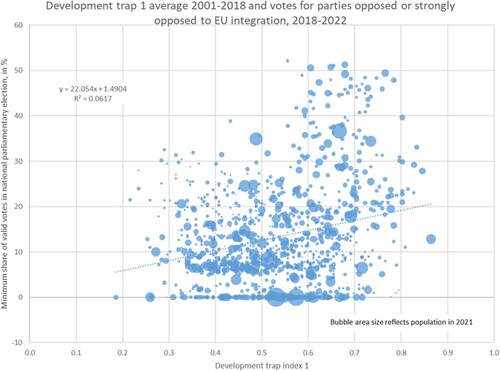
The question we now address is whether the risk, intensity, and length of time of a trap drives support for Eurosceptic parties. Charting the simple correlation between the trap risk on the horizontal axis and the share of votes for hard Eurosceptic parties () on the vertical axis uncovers a positive correlation between both variables. Many regions in a development trap (e.g., Nièvre or Yonne in France or Perugia, Terni, or Viterbo in Italy) have shown considerable support for hard Eurosceptic parties. However, the relationship is not significant, and there are many outliers. On the one hand, many regions with a high trap risk register no (or virtually no) Eurosceptic vote (e.g., Cyprus, Heraklion in Greece, or Morbihan in France). On the other, a high share of votes for Eurosceptic parties is cast in many regions with a low trap risk (Chemnitz and Dresden in Germany, or Milan in Italy). Overall, however, voters in trapped EU regions show greater support for Eurosceptic political options. Does this relationship hold when inserted into an econometric analysis including controls that affect the disaffection of voters with the current system?
Figure 9. Correlation between the trap risk (DT1) and the hard Eurosceptic vote (2018–2022).
Cross-section Analysis
presents the results of estimating model (1) using the development trap index (both DT1, to capture the trap risk, and DT2, to measure the intensity of the trap) for the period between 2001 and 2018.
Table 1 Base Table. Link between Being in a Development Trap (2001–2018) and Votes for Hard Eurosceptic Parties
First, these results show that the coefficients for the control variables are in line with expectations and the scholarly literature. The share of votes for strong Eurosceptic parties is significantly higher in wealthier regions, in regions with more employment in industry, in regions where there is a greater share of older people, and in regions with lower shares of adults with higher education.
The observation that wealthier regions show significant support for strong Eurosceptic parties challenges the dominant narratives surrounding Eurosceptic voting, yet aligns with previous evidence (Dijkstra, Poelman, and Rodríguez-Pose Citation2020). Eurosceptic voting has often been associated with disadvantaged regions and individuals. However, feelings of discontent can permeate even relatively affluent areas. This reflects the broader discourse on inequality and relative deprivation in seemingly prosperous regions. As Dorling (2015) points out, injustice and a sense of exclusion are not confined to areas of overt economic hardship but can also prevail in wealthier communities. As highlighted in the theoretical section, Euroscepticism is more likely to take root in previously prosperous regions experiencing significant long-term economic decline than in regions that have remained at the bottom of the economic hierarchy.
Two different mechanisms explain this result. First, people living in a wealthy region may be more concerned by low economic growth as it reduces their standard of living compared with other regions. Second, it may be easier to persuade people living in more developed regions that they do not benefit from being part of the EU, since many of the benefits they receive (such as greater prosperity, stability, and security) extend beyond direct financial support and are, therefore, less tangible. Enhanced access to wider markets, greater investment opportunities, a stronger voice within the EU's decision-making framework, and an enhanced sense of security and stability are not frequently monetized but are a fundamental source of prosperity.
Voters’ reactions to migration are significantly connected to the origin of the migrants. Regions with higher numbers of migrants from countries outside the EU—a type of migration controlled by national governments and not by the EU—tend to show greater support for hard Eurosceptic parties. Conversely, in regions where there is a higher proportion of migrants from within the EU—a type of migration regulated by the EU—there is less support for hard Eurosceptic parties.
As expected, the hard Eurosceptic vote is, on average and depending on the regression, stronger in (1) the less densely populated suburbs, medium-sized cities, towns, rural areas (de Dominicis, Dijkstra, and Pontarollo Citation2022); (2) regions with a lower share of the population with higher education (Jennings and Stoker Citation2019; de Lange, van der Brug, and Harteveld Citation2023); and (3) regions with lower employment rates. Regions with a high quality of government also register lower support for hard Eurosceptic parties, albeit not when DT2 is considered ().
When we turn to our two main variables of interest—the trap risk (, Regressions 1–3) and the intensity of the trap (, Regressions 4–6)—the coefficients are always positive and highly significant. Voters in regions with a high trap risk (DT1) between 2001 and 2018 were far more likely to cast their votes for hard Eurosceptic options in national legislative elections than those in regions with a lower trap risk. The deeper the intensity of the trap (DT2), the greater the vote for hard Eurosceptic parties. These results are replicated when conducting the same analysis using instrumental variables (Table A3 in the online material)—which also accounts for the nuanced changes in party ideologies and the shifting focus of their opposition to European integration—and when excluding the countries with almost no hard Eurosceptic vote (Table A4 in the online material).
When considering the length of time a region has been in a development trap, we expect, from a theoretical perspective, to find considerable differences between regions that have been trapped for lengthy periods of time and those that have only been trapped for a limited period. This is what tests. Here, we analyze the connection between how long a region has spent in a development trap and the support for parties opposed and strongly opposed to European integration at the ballot box. Regressions 1 and 2 in represent the trap risk—measured by DT1—in 2018, while Regressions 3 and 4 cover the average trap risk for the period 2015–2018. Regressions 5 and 6 cover between 2010 and 2018; and Regressions 7 and 8 cover the longer span between 2001 and 2018. Regressions 9 through 12 opt for an alternative measurement of the duration of a trap, counting the number of years a region has been in a trap since 2010 (Regressions 9 and 10) or 2001 (Regressions 11 and 12). The model is run both without controls (regressions with odd numbers) and with controls (regressions with even numbers). The controls are not reported in the table for the sake of brevity but go in line with the coefficients discussed for .
Table 2 Different Time Measures of the Development Trap (1) and Hard Eurosceptic Vote
The results show that the inhabitants of a region that is trapped, even if only briefly, are far more likely to support hard Eurosceptic options than people living in places that have not suffered—or that have suffered less—from stagnation in wealth, employment, and productivity.Footnote6 As the coefficients for all the regressions are comparable, the results of show that, as expected, the longer the period we consider, the greater the impact on support for hard Eurosceptic parties. How much more likely are voters in long-term trapped places to cast a vote for hard Eurosceptic candidates? According to the coefficients, the impact is six times greater for the period 2010–2018 than if we only consider 2018 (, Regressions 6 and 2). If we consider the two decades starting in 2001, the ratio increases to more than eight times (Regressions 8 and 2). Thus, while being in a trap matters, the length of time a region spends in the trap contributes to an almost exponential increase in the discontent that is later reflected at the ballot box.
The same results are in evidence when the years in a trap are regressed on hard Eurosceptic votes as when we consider the average trap risk over a period of time. The inhabitants of regions that have spent more time in a development trap support hard Eurosceptic options to a significantly greater extent than those living in more economically dynamic regions. This is the case for both the period 2010–2018 and 2001–2018.
If we include the intensity of the trap in the mix (DT2) (Table A5 in the online material), the results reproduce those of : the longer the period, the greater the impact of intensity on Eurosceptic voting. When we consider a longer period, the impact of the intensity of the trap on the vote shares goes up, but by less than when using the trap risk (DT1). As compared to 2018, the impact of the period 2001–2018 is close to twice as high on Eurosceptic voting, while in the case of DT1, it increases by a factor of eight.
When support for both soft and hard Eurosceptic parties is analyzed alongside support for only hard Eurosceptic parties, the coefficients for the average DT1 between 2001 and 2018 remain connected with Eurosceptic vote in national elections and highly significant (, Regressions 1–3). By contrast, the intensity of the trap yields insignificant coefficients when we introduce controls (, Regressions 5–6).
Table 3 Base Table. Link between Being in a Development Trap (2001–2018) and Votes for Soft and Hard Eurosceptic Parties
The coefficients for the control variables, despite generally going in the same direction as in , experience some changes. When all the controls are included, they remain significant in the case of (1) industrial employment, (2) the share of citizens born in another EU country, (3) population density, and (4) employment levels (, Regressions 3 and 6). This means that the voter who supports soft Eurosceptic parties has fewer distinct characteristics compared with the average voter. But the role of the development trap remains strong and significant.
The length of time a region has spent in a trap also matters when estimating support for both soft and hard Eurosceptic parties. The coefficient is insignificant for regions that were trapped in 2018 or that were trapped between 2015 and 2018. Over longer periods, the impact of the trap risk on Eurosceptic voting becomes significant and stronger (, Regressions 5 through 8). The impact of the trap risk on Eurosceptic voting doubles for those regions that have had the same trap risk for two decades relative to those having had that level in just the post-2010 period. When considering the duration of the trap, we find a strongly significant impact both for the period 2010–2018 and 2001–2018 (, Regressions 9 through 12).
Table 4 Different Time Measures of Development Trap (1) and Soft and Hard Eurosceptic Vote
Changes over Time
What happens to the connection between being in a development trap and the share of the Eurosceptic vote when, instead of considering just a single electoral cycle, we cover the two electoral cycles in which Euroscepticism has been on the rise? This is the exercise we conduct in and , where the link between being in a development trap—using the average development trap index between 2001 and 2013 or 2018 depending on the electoral cycle considered—and the electoral support for hard () and both hard and soft () Eurosceptic parties are evaluated over the 2013–2018 and 2018–2022 electoral cycles. The structure of the tables reproduces those of (hard Euroscepticism) and (hard and soft Euroscepticism).
Table 5 Pooled OLS. Link between Being in a Development Trap and Votes for Hard Eurosceptic Parties
Table 6 Pooled OLS. Link between Being in a Development Trap and Votes for Soft and Hard Eurosceptic Parties
Estimating model (1) over two national electoral periods yields comparable results to those already reported for the last electoral cycle. Both the risk of falling into a trap and the intensity of the trap explain the vote for hard Eurosceptic parties across Europe since 2013 (). The support for hard Eurosceptic parties has been considerably greater in EU regions with a lower economic dynamism and with a higher risk of stagnation. The coefficients for the controls reported in also reproduce those of , with a few exceptions. These include the share of employment in industry and the quality of government, which become mostly not significant. Employment rates, by contrast, become significant with the full set of controls (, Regressions 3 and 6).
When considering soft as well as hard Euroscepticism over two electoral cycles, both the risk and the intensity of the development trap matter—and they matter a lot—for Eurosceptic votes (). The results highlight that the link between economic stagnation and the rise of Euroscepticism is not confined to one electoral cycle. Voters in trapped regions—especially if the trap is deep and long—are unlikely to support European integration in the future, unless the lack of economic dynamism in the places where they live is addressed.
The strength of the development trap variables over two electoral cycles contrasts with the weakening of the coefficients for most controls. Those that remain significant go in line with the previous literature. Support for hard and soft Eurosceptic parties is stronger in (1) relatively less dense places, (2) regions with worse endowments in higher education, (3) regions with a higher share of foreigners born outside the EU, and (4) regions with lower quality of government (the only control variable that is not weakened in ). Once all these factors are taken into account, support for hard and soft Eurosceptic parties is, once again, stronger in richer areas ().
Conclusions
Eurosceptic voting has risen substantially since the 2000s. Hard Eurosceptic parties increased their vote share from 5 percent to 14 percent in this period. Since the Brexit referendum, this vote share has not grown. However, softer versions of Euroscepticism have continued to expand, reaching 27 percent in the latest national legislative elections in the EU.
In this article we have explored the factors linked to Eurosceptic voting. The results confirm the impact of a range of social, economic, and demographic factors on the rise of Euroscepticism. In almost all of the regressions presented, Eurosceptic voting is reduced by (1) higher employment rates, (2) higher shares of the population with tertiary education, (3) higher quality of government, (4) higher shares of residents born in another EU Member State, and (5) higher population densities. When these factors are accounted for, the share of Eurosceptic votes tends to be higher in wealthier regions, countering the simplistic narrative that Euroscepticism is purely a product of economic hardship (Díaz-Lanchas, Sojka, and Di Pietro Citation2021). In addition, regions grappling with aging processes and with a greater share of residents born outside the EU register relatively high shares of votes for Eurosceptic parties in most regressions.
The main focus of our study has been, however, on how regions caught in a development trap are experiencing a far greater rise of Euroscepticism. The inhabitants of regions that are trapped in a cycle of low employment and productivity dynamism, and slow growth relative to their performance in the past and to their country and European peers, are veering toward greater Euroscepticism. This finding is consistent across various time measures of development traps, indicating the persistent and long-term nature of these effects. Moreover, the analysis suggests a directional causality from falling into a development trap to the rise of Euroscepticism, rather than the other way around. Sustained economic stagnation and the subsequent growth of regional inequality is shaping political attitudes and preferences toward European integration, endangering the future of the European project.
While the primary contribution of our article may be empirical, the results of the analysis are far-reaching and set the stage for profound theoretical advancements and conceptual shifts in economic geography, and in the relationship between economic and political geography. First, the analysis highlights the need to reconceptualize development traps. The concept of traps in economics and economic geography has generally been approached from a macroeconomic perspective. Yet, our findings suggest that the formation and endurance of development traps does not just reflect static conditions but is a dynamic process influenced by geographic, demographic, and political factors. This calls for an integrated framework that accounts for the spatial heterogeneity of development traps and their sociopolitical ramifications, going beyond simply acknowledging the existence of development traps to delve deeper into their formation, persistence, and resolution (Crescenzi and Rodríguez-Pose Citation2012; Achten and Lessmann Citation2020).
The results also underline that existing theories looking at regional inequality may be somewhat inadequate to explain recent developments in the location of economic activity. The strong link between growing regional economic inequality and Euroscepticism that we have uncovered challenges and enriches existing theories of regional inequality. It pushes economic geographers to rethink and develop new theoretical models that incorporate political attitudes as both an outcome and a driver of regional economic performance (Storper Citation2011; McCann and van Oort Citation2019).
Most crucially, the results stress the importance of revisiting the relationship between economics and politics. Until now, the dominating view—mainly from political science and political geography—has been that the rise in discontent in the so-called places that don't matter has been the result of cultural factors and cultural wars. Yet, we have shown that development traps and Euroscepticism feed on one another, and economic decline affects political behaviors. It may also be the case that the rise of discontent and its political consequences then shape the geography of economic activity and the future shape of territorial inequality. The challenge that lies ahead is deciphering the intricate relationship between economic conditions and political realities, as is also starting to be done in political science (e.g., Mayne and Katsanidou Citation2023; Vasilopoulou and Talving Citation2023). Understanding the symbiotic relationship, feedback loops, and the potential alterations between economics and politics based on varying geographic and institutional contexts becomes paramount. Our research, thereby, underlines the need to realign existing understandings of how economic factors, as opposed to merely cultural wars, can deeply influence and reshape the terrain of political geography and how, in turn, changes in the political panorama affect the location of economic activity. In sum, it calls for economic geographers to develop new theoretical models that incorporate political factors as both an outcome and a driver of regional economic performance.
Finally, the research emphasizes the pressing need to propose policies that can proactively prevent the onset of regional development traps and prevent them from becoming entrenched. While regions at various stages of development face potential vulnerability to these traps, certain interventions, such as bolstering government quality, catalyzing innovation, and amplifying education and training, seem poised to fortify regions against falling into these traps. Cohesion policy investments (Rodríguez-Pose and Dijkstra Citation2021) and careful spatial planning (Mattila, Purkarthofer, and Humer Citation2023) can also play a role in mitigating Eurosceptic sentiments, which can be symptomatic of broader developmental discontent. Nevertheless, tailoring the optimal mix of preventive policies and investments requires a nuanced appreciation of the distinct regional dynamics and a better understanding of how traps are formed and why do they endure in time.
EG_June 2024_Rodríguez-Pose_ONLINE ONLY appendices.docx
Download MS Word (102 B)Acknowledgments
We are grateful to Jim Murphy, the editor in charge, and to the three reviewers for their thorough and incisive suggestions, criticisms, and advice in the different rounds of refereeing. Earlier versions of the article were put to the test of the audience in Beijing, Bergen, Brussels, Cagliari, Corte, Denver, Lisbon, London, Pécs, Madrid, and Split, as well as a keynote lecture at the 2023 ERSA Conference in Alicante. No potential conflict of interest was reported by the authors. The content of this article reflects only the views of the authors. The European Commission cannot be held responsible for any use that may be made of the information contained therein.
Notes
1 Eurosceptic parties are defined based on the Chapel Hill Expert Survey. See the section on “The Rise of Euroscepticism.”
2 Citizens of the EU participate in a variety of elections. Elections to the European Parliament occur every five years. National elections take place every four or five years and determine the national governments, influencing EU policies through representation in the Council of the EU. Regional and local elections allow voters to elect representatives for local governance and are especially significant in countries with a high degree of self-rule. The electoral systems and frequencies of national and subnational elections vary across Member States, reflecting the unique political structures of EU countries.
3 See the data section for a more detailed explanation, including specific CHES scores.
4 For a detailed explanation of the methodology used in the calculation of each development trap index, please refer to Diemer et al. (2022).
5 Economic decline is not the only reason why in some regions public services have been scaled back. Austerity measures or population decline may also lead to reduced public services.
6 The rise of political discontent has different roots in Europe than in the US. While in Europe being caught in a development trap is fundamental for the rise of Eurosceptic feelings, in the US support for populism combines to a greater extent cultural and economic features. In the US, the interplay between economic factors and populism is heavily influenced by racial divides: predominantly White areas undergoing economic decline have veered more toward illiberalism than similarly declining areas with a different—often more mixed—racial composition (Rodríguez-Pose, Terrero-Dávila, and Lee Citation2023).
References
- Achten, S., and Lessmann, C. 2020. Spatial inequality, geography and economic activity. World Development 136: art. 105114. doi:10.1016/j.worlddev.2020.105114.
- Albanese, G., Barone, G., and de Blasio, G. 2022. Populist voting and losers’ discontent: Does redistribution matter? European Economic Review 141: art. 104000. doi:10.1016/j.euroecorev.2021.104000.
- Autor, D. H., Dorn, D., and Hanson, G. H. 2016. The China shock: Learning from labor-market adjustment to large changes in trade. Annual Review of Economics 8:205–40. doi:10.1146/annurev-economics-080315-015041.
- Blažek, J., Květoň, V., Baumgartinger-Seiringer, S., and Trippl, M. 2020. The dark side of regional industrial path development: Towards a typology of trajectories of decline. European Planning Studies 28 (8): 1455–73. doi:10.1080/09654313.2019.1685466.
- Becker, S. O., Fetzer, T., and Novy, D. 2017. Who voted for Brexit? A comprehensive district-level analysis. Economic Policy 32 (92): 601–50. doi:10.1093/epolic/eix012.
- Betz, H. G. 1993. The two faces of radical right-wing populism in Western Europe. Review of Politics 55 (4): 663–86. doi:10.1017/S0034670500018040.
- Bornschier, S., Häusermann, S., Zollinger, D., and Colombo, C. 2021. How “us” and “them” relates to voting behavior—Social structure, social identities, and electoral choice. Comparative Political Studies 54 (12): 2087–122. doi:10.1177/0010414021997504.
- Charron, N., Lapuente, V., and Annoni, P. 2019. Measuring quality of government in EU regions across space and time. Papers in Regional Science 98 (5): 1925–53. doi:10.1111/pirs.12437.
- Crescenzi, R., and Rodríguez-Pose, A. 2012. An ‘integrated’ framework for the comparative analysis of the territorial innovation dynamics of developed and emerging countries. Journal of Economic Surveys 26 (3): 517–33. doi:10.1111/j.1467-6419.2012.00726.x.
- de Dominicis, L., Dijkstra, L., and Pontarollo, N. 2022. Why are cities less opposed to European integration than rural areas? Factors affecting the Eurosceptic vote by degree of urbanization. Cities 130: art. 103937. https://doi.org/10.1016/j.cities.2022.103937.
- de Lange, S., van der Brug, W., and Harteveld, E. 2023. Regional resentment in the Netherlands: A rural or peripheral phenomenon? Regional Studies 57 (3): 403–15. doi:10.1080/00343404.2022.2084527.
- Díaz-Lanchas, J., Sojka, A., and Di Pietro, F. 2021. Of losers and laggards: The interplay of material conditions and individual perceptions in the shaping of EU discontent. Cambridge Journal of Regions, Economy and Society 14 (3): 395–415. doi:10.1093/cjres/rsab022.
- Diemer, A., Iammarino, S., Rodríguez-Pose, A., and Storper, M. 2022. The regional development trap in Europe. Economic Geography 98 (5): 487–509. doi:10.1080/00130095.2022.2080655.
- Dijkstra, L., Poelman, H., and Rodríguez-Pose, A. 2020. The geography of EU discontent. Regional Studies 54 (6): 737–53. doi:10.1080/00343404.2019.1654603.
- Di Matteo, D., and Mariotti, I. 2021. Italian discontent and right-wing populism: Determinants, geographies, patterns. Regional Science Policy and Practice 13 (2): 371–96. doi:10.1111/rsp3.12350.
- Duranton, G., Rodríguez-Pose, A., and Sandall, R. 2009. Family types and the persistence of regional disparities in Europe. Economic Geography 85 (1): 23–47. doi:10.1111/j.1944-8287.2008.01002.x.
- Fetzer, T. 2019. Did austerity cause Brexit? American Economic Review 109 (11): 3849–86. doi:10.1257/aer.20181164.
- Ford, R., and Jennings, W. 2020. The changing cleavage politics of Western Europe. Annual Review of Political Science 23 (1): 295–314. doi:10.1146/annurev-polisci-052217-104957.
- Goodwin, M. J., and Heath, O. 2016. The 2016 referendum, Brexit and the left behind: An aggregate-level analysis of the result. Political Quarterly 87 (3): 323–32. doi:10.1111/1467-923X.12285.
- Greven, T. 2016. The rise of right-wing populism in Europe and the United States: A comparative perspective. Friedrich Ebert Foundation. https://dc.fes.de/fileadmin/user_upload/publications/RightwingPopulism.pdf.
- Hawkins, K. A., Aguilar, R., Silva, B. C., Jenne, E. K., Kocijan, B., and Rovira Kaltwasser, C. 2019. Measuring populist discourse: The global populism database. EPSA Annual Conference, June 20–22, Belfast, UK.
- Hochschild, A. R. 2016. Strangers in their own land: Anger and mourning on the American right. New York: New Press.
- Hopkin, J. 2020. Anti-system politics: The crisis of market liberalism in rich democracies. Oxford: Oxford University Press.
- Iammarino, S., Rodríguez-Pose, A., Storper, M., and Diemer, A. 2020. Falling into the middle-income trap?-A study on the risks for EU regions to be caught in a middle-income trap. Luxembourg: European Commission Publications Office. https://ec.europa.eu/regional_policy/sources/studies/middle_income_trap_pres.pdf.
- Jennings, W., and Stoker, G. 2019. The divergent dynamics of cities and towns: Geographical polarisation and Brexit. Political Quarterly 90 (Suppl2): 155–66. doi:10.1111/1467-923X.12612.
- Jolly, S., Bakker, R., Hooghe, L., Marks, G., Polk, J., Rovny, J., Steenbergen, M., et al. 2022. Chapel Hill Expert Survey trend file, 1999–2019. Electoral Studies 75 (February): art. 102420. doi: 10.1016/j.electstud.2021.102420.
- Kharas, H., and Kohli, H. 2011. What is the middle income trap, why do countries fall into it, and how can it be avoided? Global Journal of Emerging Market Economies 3 (3): 281–89. doi:10.1177/097491011100300302.
- Kenny, M., and Luca, D. 2021. The urban-rural polarisation of political disenchantment: An investigation of social and political attitudes in 30 European countries. Cambridge Journal of Regions, Economy and Society 14 (3): 565–82. doi:10.1093/cjres/rsab012.
- Ketterer, T. D., and Rodríguez-Pose, A. 2018. Institutions vs. ‘first-nature’ geography: What drives economic growth in Europe's regions?. Papers in Regional Science 97 (S1): S25–S62. https://onlinelibrary.wiley.com/doi/pdf/10.1111/pirs.12237.
- Kitschelt, H. 2002. Popular dissatisfaction with democracy: Populism and party systems. In Democracies and the populist challenge, ed. Y. Mény and Y. Surel, 179–96. London: Palgrave Macmillan. doi:10.1057/9781403920072_10.
- Koeppen, L., Ballas, D., Edzes, A., and Koster, S. 2021. Places that don't matter or people that don't matter? A multilevel modelling approach to the analysis of the geographies of discontent. Regional Science Policy and Practice 13 (2): 221–45. doi:10.1111/rsp3.12384.
- Larsson, J. P., Öner, Ö., and Sielker, F. 2021. Regional hierarchies of discontent: an accessibility approach. Cambridge Journal of Regions, Economy and Society 14 (3): 583-599.
- Lee, N., Morris, K., and Kemeny, T. 2018. Immobility and the Brexit vote. Cambridge Journal of Regions, Economy and Society 11 (1): 143–63. doi:10.1093/cjres/rsx027.
- Lenzi, C., and Perucca, G. 2021. People or places that don’t matter? Individual and contextual determinants of the geography of discontent. Economic Geography 97 (5): 415–45. doi:10.1080/00130095.2021.1973419.
- Mattila, H., Purkarthofer, E., and Humer, A. 2023. Governing ‘places that don’t matter’: Agonistic spatial planning practices in Finnish peripheral regions. Territory, Politics, Governance 11 (4): 813–32. doi:10.1080/21622671.2020.1857824.
- Mayne, Q., and Katsanidou, A. 2023. Subnational economic conditions and the changing geography of mass Euroscepticism: A longitudinal analysis. European Journal of Political Research 62 (3): 742–60. doi:10.1111/1475-6765.12528.
- McCann, P. 2020. Perceptions of regional inequality and the geography of discontent: Insights from the UK. Regional Studies 54 (2): 256–67. doi:10.1080/00343404.2019.1619928.
- McCann, P., and Ortega-Argilés, R. 2021. The UK ‘geography of discontent’: Narratives, Brexit and inter-regional ‘levelling up’. Cambridge Journal of Regions, Economy and Society 14 (3): 545–64. doi:10.1093/cjres/rsab017.
- McCann, P., and Van Oort, F. 2019. Theories of agglomeration and regional economic growth: A historical review. In Handbook of regional growth and development theories, ed. R. Capello and P. Nijkamp, 6–23. Cheltenham, UK: Edward Elgar.
- McKay, L., Jennings, W., and Stoker, G. 2021. Political trust in the “places that don't matter.” Frontiers in Political Science 3: art. 642236. doi:10.3389/fpos.2021.642236.
- McKinsey Global Institute. 2023. Pixels of progress: A granular look at human development around the world. https://www.mckinsey.com/mgi/our-research/pixels-of-progress-introduction.
- Norris, P., and Inglehart, R. 2019. Cultural backlash: Trump, Brexit, and authoritarian populism. Cambridge: Cambridge University Press.
- Noury, A., and Roland, G. 2020. Identity politics and populism in Europe. Annual Review of Political Science 23:421–39. doi:10.1146/annurev-polisci-050718-033542.
- Pike, A. 2022. Coping with deindustrialization in the Global North and South. International Journal of Urban Sciences 26 (1): 1–22. doi:10.1080/12265934.2020.1730225.
- Pinilla, V., and Sáez, L.A. 2021. What do public policies teach us about rural depopulation: The case study of Spain. European Countryside 13 (2): 330–51. doi:10.2478/euco-2021-0021.
- Reif, K., Schmitt, H., and Norris, P. 1997. Second-order elections. European Journal of Political Research 31 (1–2): 109–24.
- Rickardsson, J. 2021. The urban–rural divide in radical right populist support: The role of resident’s characteristics, urbanization trends and public service supply. Annals of Regional Science 67 (1): 211–42. doi:10.1007/s00168-021-01046-1.
- Rodden, J. A. 2019. Why cities lose: The deep roots of the urban–rural political divide. New York: Basic Books.
- Rodríguez-Pose, A. 2018. The revenge of the places that don’t matter (and what to do about it). Cambridge Journal of Regions, Economy and Society 11 (1): 189–209. doi:10.1093/cjres/rsx024.
- Rodríguez-Pose, A. 2020. The rise of populism and the revenge of the places that don’t matter. LSE Public Policy Review 1 (1). https://ppr.lse.ac.uk/articles/10.31389lseppr.4. doi:10.31389/lseppr.4.
- Rodríguez-Pose, A., and Bartalucci, F. 2023. The green transition and its potential territorial discontents. Cambridge Journal of Regions, Economy and Society. https://doi.org/10.1093/cjres/rsad039.
- Rodríguez-Pose, A., and Dijkstra, L. 2021. Does cohesion policy reduce EU discontent and Euroscepticism? Regional Studies 55 (2): 354–69. https://doi.org/10.1080/00343404.2020.1826040.
- Rodríguez-Pose, A., and Ketterer, T. 2020. Institutional change and the development of lagging regions in Europe. Regional Studies 54 (7): 974–86. doi:10.1080/00343404.2019.1608356.
- Rodríguez-Pose, A., Lee, N., and Lipp, C. 2021. Golfing with Trump. Social capital, decline, inequality, and the rise of populism in the US. Cambridge Journal of Regions, Economy and Society 14 (3): 457–81. doi:10.1093/cjres/rsab026.
- Rodríguez-Pose, A., Terrero-Dávila, J., and Lee, N. 2023. Left-behind versus unequal places: Interpersonal inequality, economic decline and the rise of populism in the USA and Europe. Journal of Economic Geography 23 (5): 951–77. doi:10.1093/jeg/lbad005.
- Schmidt, V. A. 2022. The discursive construction of discontent: Varieties of populist anti-system ideas and discursive interactions in Europe. Journal of European Integration 44 (2): 165–82. doi:10.1080/07036337.2022.2032019.
- Storper, M. 2011. Why do regions develop and change? The challenge for geography and economics. Journal of Economic Geography 11 (2): 333–46. doi:10.1093/jeg/lbq033.
- Torreblanca, J. I., and Leonard, M. 2013. The continent-wide rise of Euroscepticism. European Council on Foreign Relations. https://ecfr.eu/publication/the_continent-wide_rise_of_euroscepticism36578/.
- Vasilopoulou, S., and Talving, L. 2023. Euroscepticism as a syndrome of stagnation? Regional inequality and trust in the EU. Journal of European Public Policy. doi: 10.1080/13501763.2023.2264891.
- Zakaria, F. 2016. Populism on the march: Why the West is in trouble. Foreign Affairs 95 (6): 9–16.