
 ?Mathematical formulae have been encoded as MathML and are displayed in this HTML version using MathJax in order to improve their display. Uncheck the box to turn MathJax off. This feature requires Javascript. Click on a formula to zoom.
Abstract
“Bee pollen” is pollen collected from flowers by honey bees. It is used by the bees to nourish themselves, mainly by providing royal jelly and brood food, but it is also used for human nutrition. For the latter purpose, it is collected at the hive entrance as pellets that the bees bring to the hive. Bee pollen has diverse bioactivities, and thus has been used as a health food, and even as medication in some countries. In this paper, we provide standard methods for carrying out research on bee pollen. First, we introduce a method for the production and storage of bee pollen which assures quality of the product. Routine methods are then provided for the identification of the pollen’s floral sources, and determination of the more important quality criteria such as water content and content of proteins, carbohydrates, fatty acids, vitamins, alkaloids, phenolic and polyphenolic compounds. Finally, methods are described for the determination of some important bioactivities of bee pollen such as its antioxidant, anti-inflammatory, antimicrobial and antimutagenic properties.
Métodos estándar Para la investigación del polen
El "polen de abeja" es el polen recogido de las flores por las abejas melíferas. El polen de abeja es utilizado para nutrir a las propias abejas, principalmente para proporcionar jalea real y alimento para las crías, pero también se utiliza para la nutrición humana. Para este último fin, se recoge en la entrada de la colmena en forma de gránulos que las abejas llevan a la colmena. El polen de abeja tiene diversas bioactividades, por lo que se hautilizado como alimento para la salud, e incluso como medicamento en algunos países. En este artículo, proporcionamos métodos estándar para llevar a cabo investigaciones sobre el polen de abeja. En primer lugar, presentamos un método de producción y almacenamiento de polen de abeja que garantiza la calidad del producto. A continuación, se ofrecen métodos de rutina para la identificación de las fuentes florales del polen y la determinación de los criterios de calidad más importantes, como el contenido de agua y de proteínas, carbohidratos, ácidos grasos, vitaminas, alcaloides y compuestos fenólicos y polifenólicos. Por último, se describen métodos para la determinación de algunas bioactividades importantes del polen de abeja, como sus propiedades antioxidantes, antiinflamatorias, antimicrobianas y antimutagénicas.
花粉研究的标准方法
“蜂花粉”是蜜蜂从花中采集的花粉。首先, 它用于蜜蜂本身的营养, 主要是提供蜂王浆和哺育幼虫的食物, 其次也用于人类营养。对于后一目的, 花粉作为蜜蜂带到蜂巢的颗粒, 在蜂巢入口处被收集。蜂花粉具有多种生物活性, 因此被用作健康食品, 甚至在一些国家被用作药物。本文提供了研究蜂花粉的标准方法。首先, 我们介绍了一种生产和储存蜂花粉的方法, 以保证产品的质量。然后提供常规鉴定方法来鉴定花粉源及更重要的质量标准, 如水含量和蛋白质、碳水化合物、脂肪酸、维生素、生物碱、酚类和多酚类化合物的含量等。最后, 描述了测定蜂花粉的一些重要生物活性的方法, 如其抗氧化、抗炎、抗菌和抗诱变特性。
1. Introduction
Pollen production on an industrial scale can be considered as a recent development, so there is a need for an international directive for quality control. In this chapter, the authors propose optimized methodologies based on the major skills developed in the field which can be used in the near future to fill that gap. This section aims to aid the understanding of actual production and the development of sanitary standards in the light of food security, standardized beekeeping management actions, collection of the product in the bee hives, transportation, sanitary treatment, processing and storage by agribusiness, resulting in a product with flavor, very delightful aroma and texture of excellent quality for food or nutraceutical purposes. To achieve the above characteristics, we also discuss corbicular pollen itself in terms of weight, size, color, shape and surface texture and, unified systems (descriptors) for the evaluation of corbicula morphological parameters of monofloral pollen.
Pollen is considered by some researchers to be one of the naturally available resources that may be regarded as a perfect food, since it is rich in essential amino acids, trace elements, enzymes, B-complex and some C and E vitamins. The pollen grains present a huge variation of morphological characteristics, established by genetic heredity and do not vary depending on environmental events or changes. In this context, the pollinic analysis of bee pollen is the best method to determine the plants used by honey bees, making it possible, among other inferences, to establish the plant taxa in the regions used for the pollen forage. The goal is to provide global information regarding the pollinic analysis of this matrix and the analytical procedures that are most frequently applied, from the more laborious and time consuming to the quicker and more advanced. Among the last, flavonoid / phenolic acid profiles using a gradient HPLC/DAD method is described. Given the specie-specific feature of those profiles obtained with different taxa collected by bees, they represent an important tool for quality control concerning the botanical origin of both monofloral and complex mixtures of bee pollen.
The first step in the determination of phenolic compounds is their appropriate extraction. The complexity of the structure of pollen grains requires multiple-stage extraction of polyphenols. Here there will be explained different procedures for the preparation of pollen extracts containing phenolic compounds and proposed a general procedure. Also presented are the applications of SPE for pre-concentration of the obtained phenolic fractions which facilitate further analysis. One of the sections describes LC and LC/MS techniques used for the identification and quantification of phenolic compounds with a detailed procedure for their determination by the UHPLC- HESI-MS/MS technique.
Another important question to be discussed is the fact that traditional pollen analysis via light microscopy has limitations in sample throughput as well as taxonomic resolution. Recently, pollen meta-barcoding methods have been developed as alternative approaches, where plant species identification of pollen grains works via DNA sequencing. However, these currently utilize different genetic markers and sequencing platforms lessening study comparability. We here describe a detailed protocol of the latest development in this field as a standard method for pollen meta-barcoding. It is highly cost-efficient, requires no palynological knowledge, is performable in standard laboratories and profits from a well-established reference database.
For the main macro and micronutrients standard methods are proposed. Bee pollen has been considered by some researchers as Mother Naturés perfect food by containing nearly all nutrients required by humans as proteins, sugars, amino acids, lipids, vitamins, minerals, nucleic acids, enzymes, phenolics and many more compounds. Pollen can also be characterized as a supplementary food with varied enhancing effects in human health due to its nutritional properties. Once pollen was exclusively a source of protein for bees’ diet, but recently, it has gained further attention as a potential food source for human consumption too. The Kjeldahl method is widely used for protein determination. In this section, we examine the methodology concerning the volumes of the reagents, as well as the distillation time and the quantity of the sample, in order to elucidate the most suitable procedure and a method been validated using bee pollen. There is increasing knowledge of the nutritional value of pollen as a supplementary food or medicine. One species of pollen is different from another, and not one has the same standard chemical composition, nor contains all the characteristics attributed to "pollen" in general. The lipid fraction is one of the main pollen constituents, and its determination is highly important. In this chapter, we describe a method for the determination of lipid content of pollen investigated and optimized, by minimizing the reagent consumption and the sample quantity.
Suggested methods to analyze micronutrients are also presented. Pollen vitamins as well as the literature found about them are included in the text. Methods for B-complex (B1, B2, B6 and PP, with vitamers) and antioxidant vitamins (vitamin E, C and carotenes as provitamin A) are explained and involve HPLC, open column and titrimetric determinations. The composition of minerals in pollen collected by honey bees is dependent on the plant species visited. The variety of the samples collected is closely associated with the geographical apiary locality given by the floral sources (taxa) and the environmental conditions in the area such as soil composition, climatic conditions and agricultural crops grown close to the apiary. Because plants can cause bioremediation of some pollutants and are part of some other anthropogenic processes, they should also be considered as an additional source of minerals in pollen (e.g., Cd, Cr, Cu, Fe, Ni, Pb and Zn). Monitoring these minerals in this matrix, as well in other food products is very important as a quality parameter. Despite this, the publications in the field are scarce. Here we propose, from the research published on the mineral composition on pollen, different methodologies that can be carried out.
Regarding toxic compounds, research has been limited. However, as a starting point, attention has focused on pyrrolizidinic alkaloids (PA). Many plant species produce pollen containing PAs that honey bees collect and bring as a protein source into the bee hive. Methods for identification of PA in pollen, together with the extraction and analysis of PAs, are essential tools for plant and food research. Mainly two approaches are commonly used: In the first approach, the total PAs (N-oxides and free-bases) are analyzed as the sum of the “necine bases” (the basic structures of PAs) by gas chromatography coupled with mass spectrometry (GC-MS). The second approach is based on liquid chromatography coupled with mass spectrometric detection (LC-MS). This method can detect both the free alkaloids and their N-oxides simultaneously, and has become the method of choice in recent years. Due to the lack of standards on the market and the multitude of PAs discovered so far, the detection, identification and quantification of PAs still represent a continuous challenge. In the following chapter, methods for the collection, extraction and profiling of PA plant pollen from Echium vulgare L. and Eupatorium cannabinum L. are presented.
In the advanced methods that allow multiple analysis with a small amount of sample, it will be shown the potential of new integrated methods as the Fourier Transform Infrared (FTIR) spectroscopic method with Attenuated Total Reflectance (ATR) used, for example, to predict the total content of phenolic and polyphenolic compounds. Determination of Free radical scavenging (EC50) and antioxidative capacity (ABTS) of bee pollen is also included. FTIR-ATR can be a useful technique for the quantification of total phenolic compounds, total flavonoids and antioxidant capacity of bee pollen that could improve the speed of laboratory analyses of this product.
Concerning the bioactivity of pollen, several studies have been developed in order to elucidate the usefulness of pollen, and therapeutic effects have been reported among others in the treatment of benign prostatitis and for oral desensitization of children who have an allergy, effects as anti-inflammatory, antimicrobial, anti-fungicidal, anti-mutagenic and immunomodulatory. Some studies reported that bee pollen accelerates mitotic rate, promotes tissue repair, enhances greater toxic elimination and reduces excessive cholesterol levels. Pollen has also been used to alleviate or cure conditions such as colds, flu, ulcers, premature aging, anemia, colitis and today is increasingly used as a health food supplement.
For these reasons, bee pollen has attracted especial attention by researchers throughout the world, and many scientific publications have been produced. In the last 17 years, at least 42 reports have been published about the antioxidant properties from different taxa, evaluating these properties by various methods. The available information corresponds to bee pollen of 21 countries including Brazil, Mexico, New Zealand and Portugal, the countries where most attention has been dedicated to this topic. The reports cited in the current work give information about the antioxidant capabilities of bee pollen coming from around 75 well identified plant species belonging to approximately 52 families. The 2,2-diphenyl-1-picrilhydrazyl (DPPH*) assay is the most popular method to evaluate the free radical scavenging properties of bee pollen. It is based on the single electron transfer mechanism, is rapid, easy, accurate, reproducible, and presents good correlations with other assays like TEAC and β-carotene bleaching. The oxygen radical absorbance capacity (ORAC) assay is based on the hydrogen atom transfer mechanism, which reflects biological conditions, and has been proposed for evaluating antioxidant properties in foods. For all these reasons, DPPH* and ORAC assays are proposed as standard methods to assess the antioxidant properties of bee pollen. The steps to carry out both assays are described. Due to related properties for human health, some information about standard methods commonly used for the determination of antimicrobial and antimutagenic activities in bee pollen are provided.
In conclusion, a significant quantity of standard methods for pollen research is now validated, and will be helpful to be included in the future International Directive for Quality Control of bee pollen in the near future.
2. Producing bee pollen from harvest to storage
To provide a good quality product it is necessary to get results in the conception of a professional, technical and competitive apiculture, mainly dealing with the opening trade between the nations, MERCOSUR, European Union, and others (Barreto et al., Citation2006; Panetta, Citation1998). The beekeeping segment in the industry context, fits into the conception, “in search of excellence and quality,” concerning the significant role that the products represent to humanity (Bassi, Citation2000; Germano et al., Citation2000).
Bee pollen harvesting requires special skills and guidelines. In this work we will represent the best methods for a better quality of product in line with the good practices in the field.
The main guidelines to obtain the best raw material are
Production plan – Such planning should aim at the highest yield in both quantity and quality. Inside an organization, technical support is crucial, and can be achieved by courses, training, internships and even from specialized consultancy, according to the needs of the production (Barreto et al., Citation2006);
Directing the raw material – It is of an unquestionable importance to direct the raw material for processing and acquisition in an ideal standard with the following sequence: production, harvest, transport, processing and storage.
Production: Standardized handling results in the harvest schedule.
Harvest: Harvest is the first stage from raw material operations to processing; this process should undergo rigorous contamination control.
Transport: Incorrect transport can negatively affect the quality of raw material. The following parameters should be considered (Barreto et al., Citation2006):
Adaptability of the vehicle to the type of raw material;
Suitable packaging for the quality and type of the collected material;
Necessity of traveling long distances (weather conditions, temperature, sun exposure, dust, rainfall, etc.);
Internal environment of the transport (odor-free).
Processing: In this phase, the facilities should be planned according to the flowchart that is demonstrated, as well as the necessary equipment to process the product such as freezers, dehydrators, sieves, cold chambers and others (Barreto et al., Citation2006).
Storage: In this phase, consider the following requirements:
Type of packing;
Product identification, label;
Temperature, humidity, luminosity;
Time of travel to the facilities should be the lowest possible (Barreto et al., Citation2006).
During the next steps, other situations can occur, for example: Deterioration of raw material: It usually occurs by the action of living organisms (insects, microorganisms, etc.), by physical processes (freezing, heating, pressurizing, etc.) and biological (fermentation, rancidity, etc.). Follow all the previous recommendations to avoid this situation, otherwise do not use the product (Franco, Citation2002; Silva, Citation2000).
Contamination of raw material: Avoid the following causes of contamination (Gilliam et al., Citation1989; Silva, Citation1999):
Lack of cleanliness in rooms and personnel;
Exposure of raw material to fresh air;
Exposure of raw material to environment with dirt, garbage, animals with injuries and infectious illness and poor and badly kept premises.
2.1. Production and handling of bee pollen before processing
Bee pollen is the result of specific conditions of the bee colonies, normally with regular population density of a bee hive in development, where the bees are stimulated to intensify pollen collection. Since it is a protein material production, this raw material will be susceptible to a more rigorous standard in the hygiene requirements, from the production up to its processing and storage (Barreto et al., Citation2006).
2.1.1. Quality control in the apiary
The quality control of bee products begins in the apiary because these products do not get their quality by handling, but by nature’s attribute. The regulation of good practices in the elaboration and food production is a broad subject that is applicable in most of the production. It is known that the microflora in the bee pollen can have two different origins: (1) by the normal microflora, originated from pollen, being yeast, mold and bacteria; (2) by outside microflora, originated from practices of handling, elaboration and product storage.
To achieve a better-quality product some steps should be done follow this check list:
Systematized handling of bee colonies;
Feeding the bees with high quality and reliable products when forage is scarce;
Daily collection of bee pollen;
Disposal of bee pollen collected on rainy days;
Sanitation of equipment in contact with the pollen at the harvest period (pollen press, hive tool and brush);
Sanitized bee gloves and beekeeper’s clothing;
Packing of harvest and transport previously sanitized and dried;
Enough harvest time and transport to keep the integrity level of the product until the processing facility.
2.1.1.1. Smoke
Smoke is a safety procedure used during the handling of bee colonies. However, the fuel materials, sawdust, should be sieved to avoid producing unwanted dust that can affect bee pollen pellets. The smoke should have a pleasant odor, and pine, cypress and eucalyptus leaves and lemongrass can be used as additives to the mixture. Animal manure must not be used. The smoke should not be aimed at the combs with honey (avoiding that the product acquires unpleasant flavor) or brood. The smoke should be applied horizontally in the bee hive when there is no exposed frame. It should never be aimed directly at the raw material in production (Barreto et al., Citation2006).
2.1.1.2. bee hives
Nowadays bee hives are often already impermeable, which avoids the previous practice of painting then, with the risk of heavy metal contaminated paints (Barreto et al., Citation2006)
2.1.1.3. Clothing
The overalls or coats used in the apiary should be cleaned after each handling session to avoid contamination in the bee hive by moth eggs and microorganisms that may adhere to clothes (Barreto et al., Citation2006).
2.1.1.4. Tools
Hive tool, clean rubber gloves. After each handling, in case any bee hive is found contaminated, these utensils should be substituted so as not to contaminate the next hive (Barreto et al., Citation2006).
2.1.1.5. Inputs
The main input used in the bee hive is the bees wax. The beekeeper should acquire this material in stores or suitable processing centers. Whenever buying bees wax, make sure it is packed with PVC film, whether there is moth or not (crumbled aspect in the plastic foil). Any wax that is directly packed with newspaper should be avoided as printing ink is a powerful source of heavy metals (Barreto et al., Citation2006).
2.1.1.6. Handling
The choice of technology to be used in production handling is crucial. The material applied in the production has to be standardized, and it needs to be easily handled to avoid higher bee losses, as well as allow perfect sanitation of the product. For example, some hive boxes made of wood are now being replaced by nontoxic plastic boxes that permit efficient sanitation. Another point is the handling standard; it refers to the conduction of the production in a way that the harvest can be realized in all bee hives in a timely fashion (Petersen et al., Citation2011).
2.1.2. Types of pollen traps
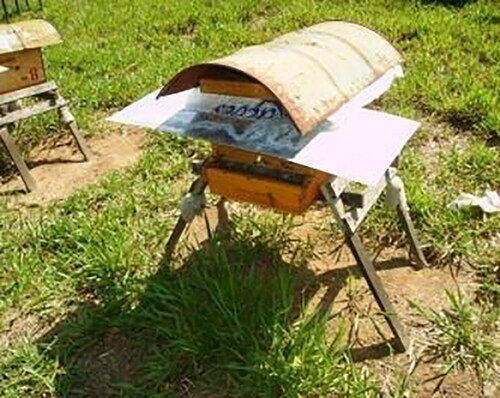
Among frontal, floor, intermediate or bottom pollen traps (), each one has its advantages and disadvantages. The ideal pollen trap is one that can receive the pollen in a safe and hygienic manner. The frontal pollen trap is practical and hygienic but because it is attached to the main floor, it receives a significant amount of dirt resulting from the internal bee hive cleaning. The bees continuously remove particles from inside to outside of the hive, making the pollen trap dirty. In the intermediate internal pollen trap, it is opened a secondary drawer, the main one being closed with a ventilation screen. It is noticed that the dirt level decreases and even the pollen has a lower humidity level than the previously mentioned. However, it can cause an increase in the bees’ defensibility due to the obstruction of the main entrance. It is recommended to choose a pollen trap that can be easily placed and removed. In addition, a pollen trap that makes the handling easier, allowing better ventilation and sanitation, allowing the flight of drones and protected against weather changes. In tropical countries such as Brazil, beekeepers have been using the “Tropical Africanized Type” () with good results (Barreto, Citation2004).
Figure 1. A tropical Africanized pollen trap (TTA).
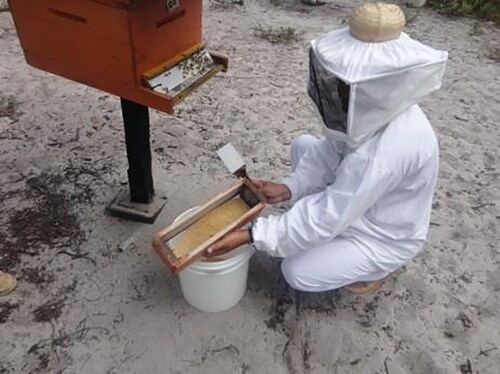
The collection of pollen () should be done daily, there are some devices that prescribe the weekly collection of the product, but there is no consensus among scientists about such procedure.
Figure 2. Pollen collection by beekeepers.
2.1.3. Chosen area of apiary production
Choice of apiary location can be problematic. Today, the choice should be careful, taking into account the use of agrochemicals, both in crops and in animals. Pollution is not exclusive to urban areas, and unfortunately some rural areas can show contamination in air, water and or soil. Rubbish in the apiary attracts undesirable insects, exposing the raw material to the risk of unwanted contamination ( and ).
Figure 3. Conditions to be avoided in the apiary and surrounding area.
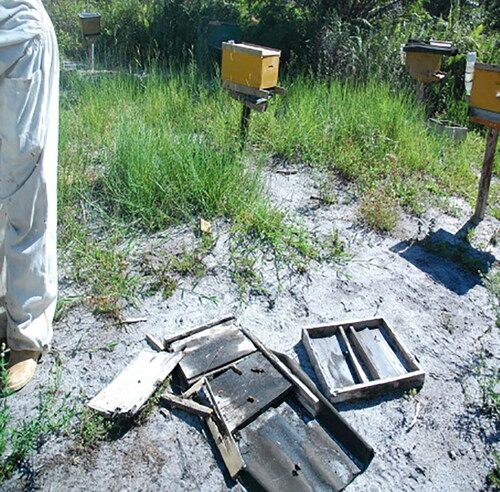
Figure 4. Bad conditions of the hives and packaging containers; hives on the ground are subject to rot and termite attack.
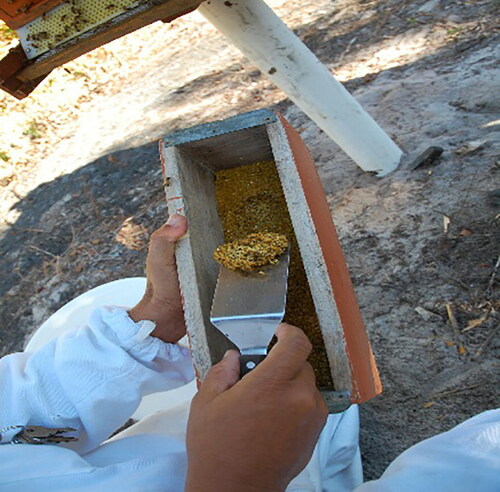
2.1.4. Quality control in the collection
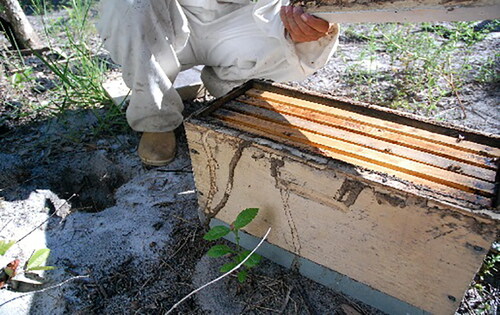
Damp compressed pollen should be collected separately from the raw materials intended for processing, and should only be used for bee feed (). The collecting box should not be exposed to contamination from the ground.
Figure 5. Damp compressed pollen.
2.1.5. Quality control in the transport of raw material
At harvest, the beekeeper should be aware of the type of packaging used to transport the product from the apiary to the processing sector, thus avoiding:
crushing of raw material;
contamination with dust;
transfer of odors and humidity as well as high temperatures, which may interfere with the quality of the product to be processed.
2.2. Handling of bee pollen in the processing sector
This sector should be provided with a reception room for production (raw material) and processing rooms, according to the Technical Regulation on Hygiene and Sanitary Conditions and Good Preparation Practices for Developers of Establishments/Industrialized Food (Example for Brazil – Ordinance 368 of 4 September 1997 (Brasil, Citation1997) obtained in www.agricultura.gov.br/ada/dipoa/). Other countries have similar regulations.
In these areas, verify the rules:
machinery that will be in contact with the raw material should be in stainless steel (AISI 304);
manipulation, the process of cleaning and sanitizing should be adopted integrally;
use of heat, dehumidifiers, chemical agents, must have precise control;
water used for cleaning the room and machinery should be of known origin with recognized purity.
2.2.1. Flowchart from production to processing of pollen
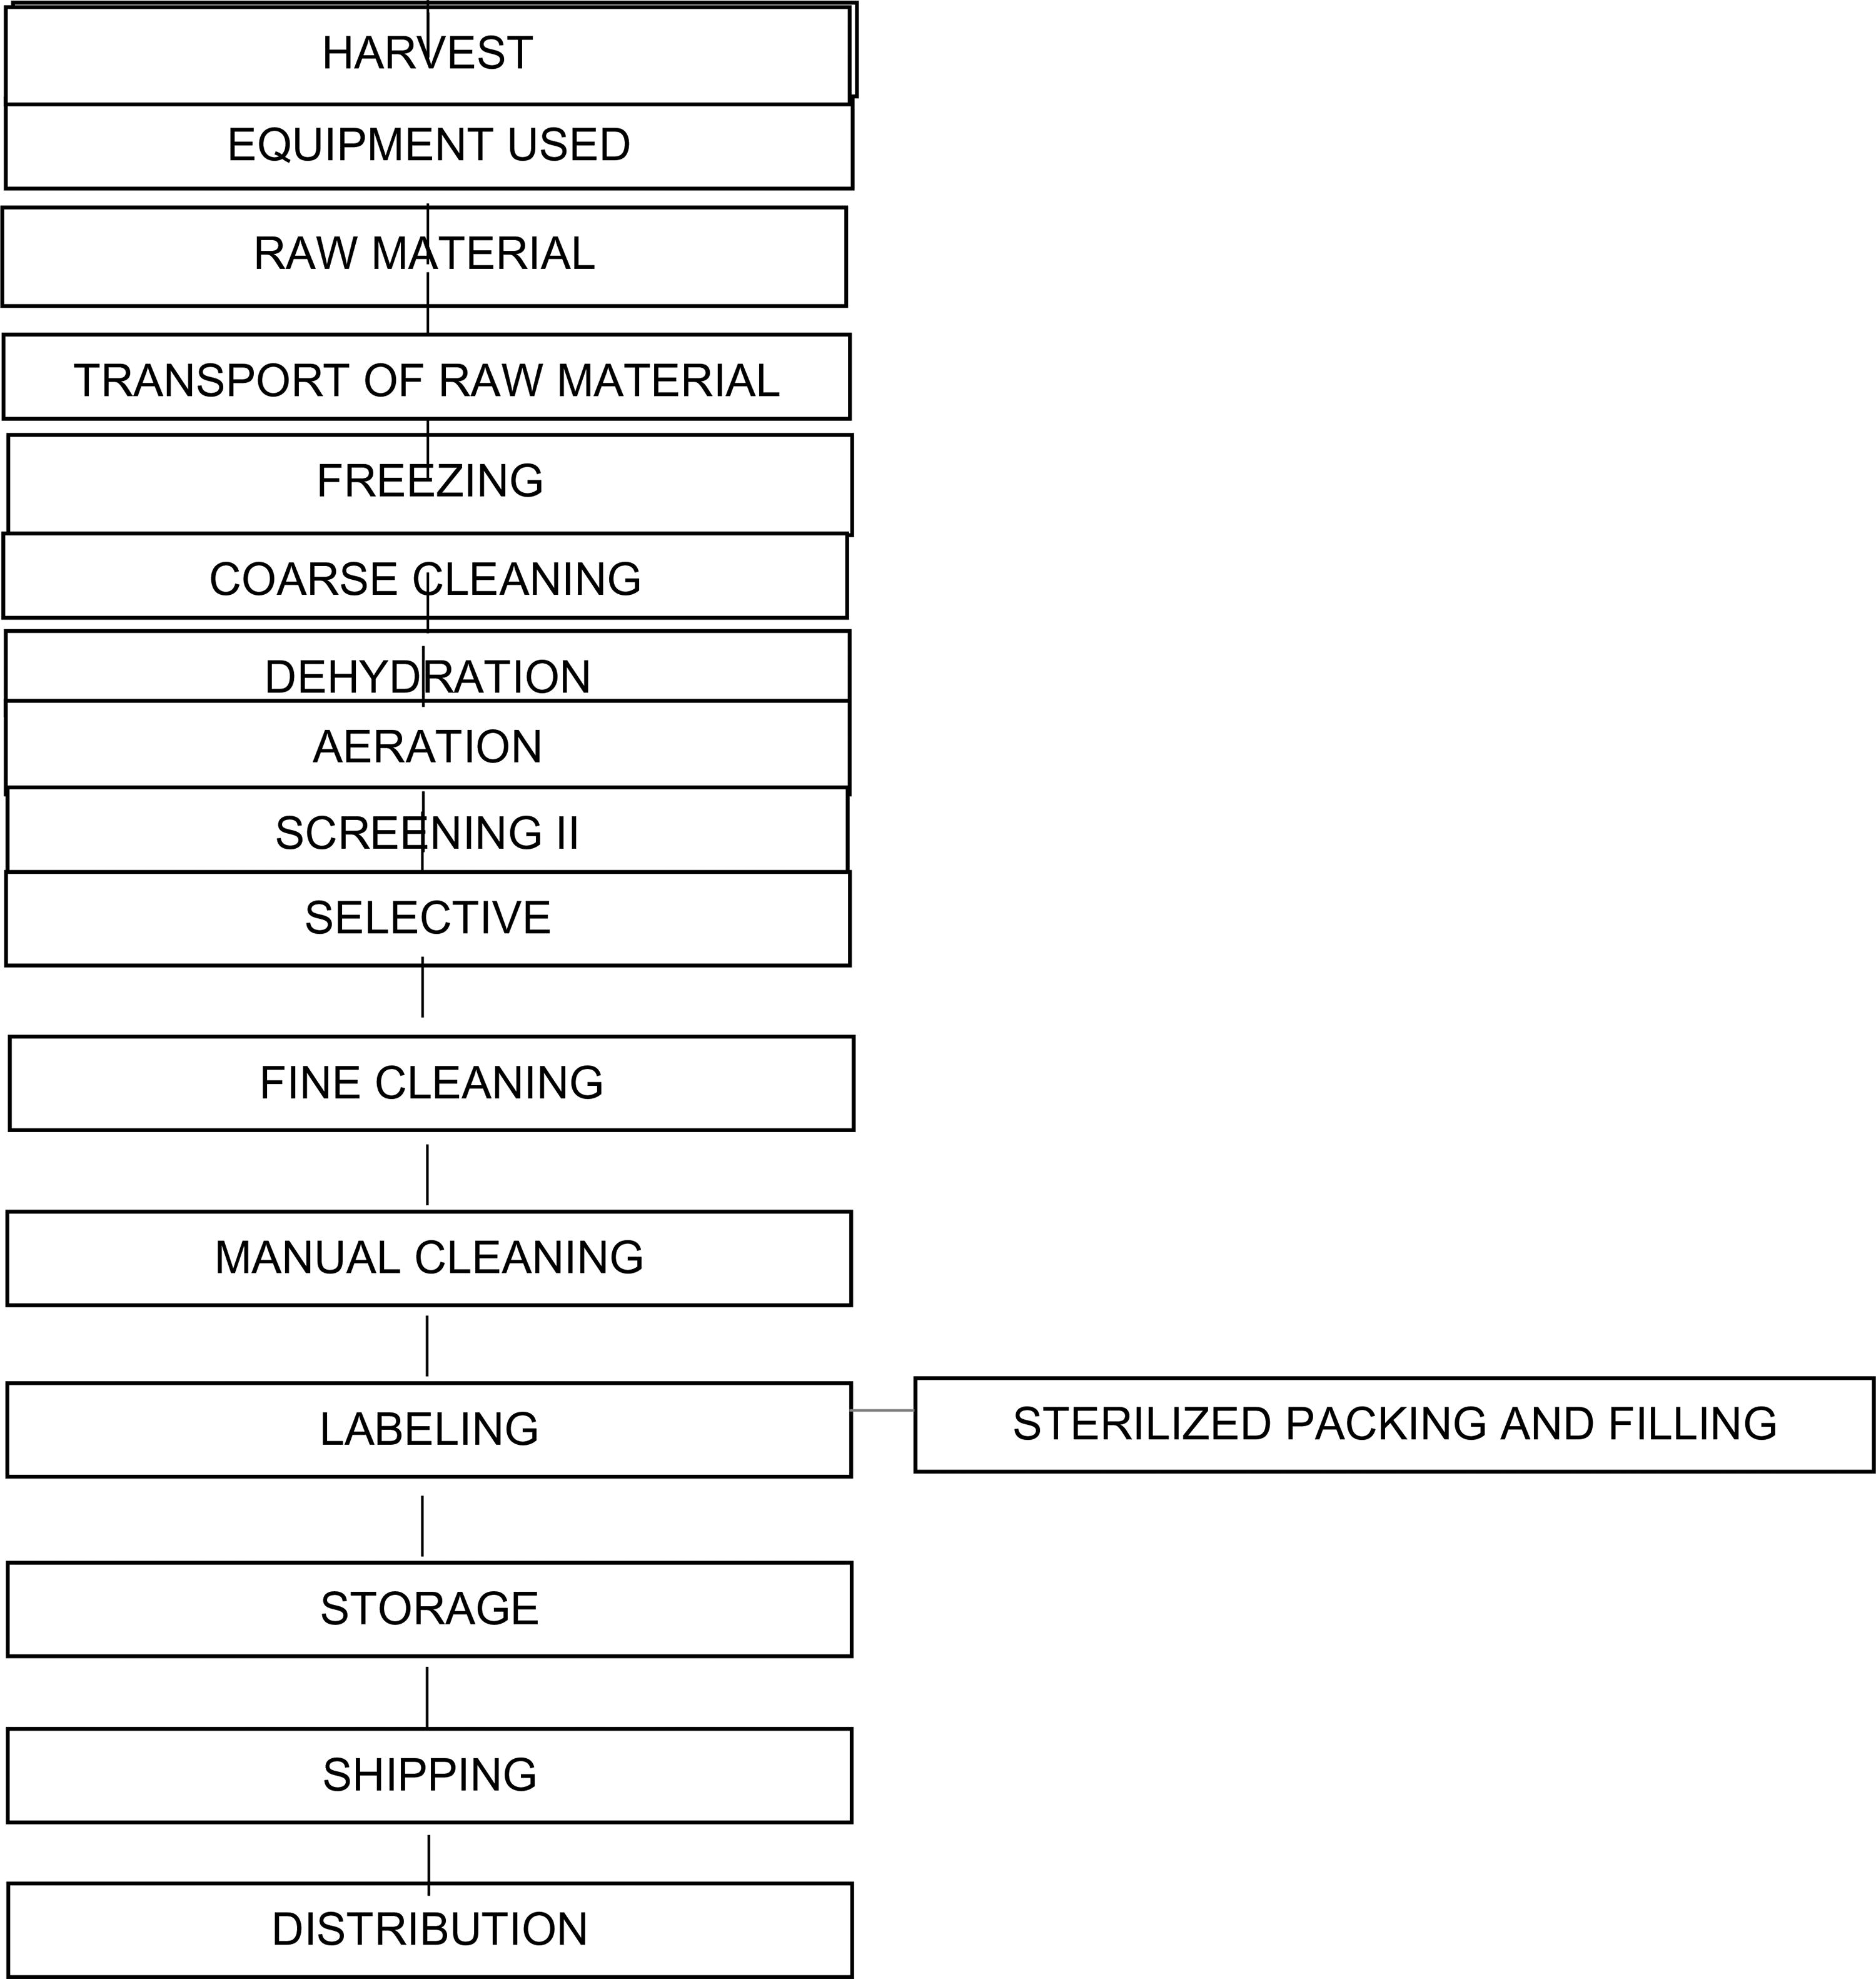
2.2.2. Processing bee pollen
In the processing area, the handler must necessarily follow the sequence below (Barreto et al., Citation2006):
Reception of raw material ("In Natura" pollen);
Primary labeling, date and place of harvest;
Removal of coarse dirt, dead bees, chalk brood mummies;
Screening;
Freezing to −18 °C for 48 hours minimum and maximum 15 days;
Dehydration step I at a maximum temperature of 42 °C for 8 hours;
Cleaning by ventilation;
Manual cleaning;
Dehydration step II maximum temperature of 42 °C for 4 hours;
Checking moisture content of dehydrated bee pollen;
Final filling of the dehydrated product;
Final product labeling valid up to 12 months;
Storage;
Shipping.
2.3. Materials and equipment involved in the process
The collection tray often used is a model made of nontoxic, broad and shallow plastic, suitable for food. Fresh pollen contains high humidity content (20 to 30%), consequently, fragile to large overlap, becoming brittle and causing an increase of pollen powder, representing the most significant loss at the time of processing. These trays must be provided with a cover which will prevent dirt from becoming incorporated into the product during transport (Almeida-Muradian et al., Citation2012; Brasil, Citation1997, Citation2001).
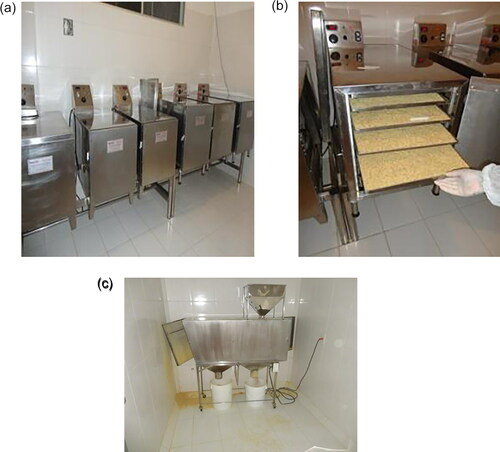
In and can be seen the steps involved from the reception to the delivery of bee pollen. When the product arrives at the facilities, it has to be:
Figure 6. Processing “fresh” bee pollen; first screening.
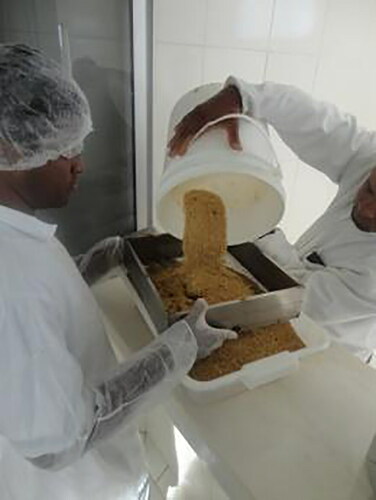
Figure 7. Example of a warehouse for bee pollen production in Brazil. This is one of the largest in Latin America, located in the state of Bahia, northeast Brazil. The main source of pollen is the coconut palm, achieving high standards of excellence and quality of the product: (a) Dehydration room 40 °C; (b) distribution trays; (c) aeration of the dehydrated product room.
Transferred to lots;
Pass through wet sieving (usually with maximum capacity of 5 kg);
Freeze. Pollen should be in a sterile polyethylene container and immediately placed in a freezer. Bee pollen will remain there for a minimum of 48 hours to destroy possible mites, eggs or larvae of the wax moth (Galleria spp.), and other insects. The freezing will also have the property of stabilizing and controlling the development of microorganism related to normal microflora contained in pollen (Ibrahim & Spivak, Citation2006). The collected pollen can be stored in the freezer for a period of a few weeks. After a month, it begins to show change in taste, texture and color;
Dehydrated. For this step is necessary to have a greenhouse with adjustable thermostat, keeping the temperature between 40 and 42 °C. Internally, the equipment consists of stainless steel with shelves that receive trays with screens in stainless steel AISI 304 that will allow efficient cleaning and sanitizing. The dehydrating aims at the water removal until it reaches the maximum humidity of 4–8% (Campos et al., Citation2008), but for tropical countries 4% is often recommended (Thakur & Nanda, Citation2020).
Frozen pollen is usually placed in a greenhouse, which facilitates its uniform distribution in the screened trays, but it should not be submitted to an immediate temperature of 42 °C. It is essential to respect a thawing period of the material to prevent damaging the product due to thermal shocks. It is suggested that after removing the pollen from the freezer, it should be transferred to a refrigerator for approximately 2 hours for defrosting. The distribution of pollen in the tray should be done in thin layers. Every instrument in contact with the pollen must be stainless steel to prevent contamination. The pollen must remain in the greenhouse from 8 to 12 hours. After dehydration, the packing of bee pollen will involve three steps:
Transferring dehydration, sealed loads;
Cleaning – First undergo the pollen in sieve particle size to have the larger lumps undone and separate the commercial pollen powder after applying dry air to remove dirt such as bee fragments that are possibly present. The final phase of cleaning is grooming materials not previously removed, for example, any propolis that is still mixed with bee pollen;
Packing – Should be done after cleaning, reducing the rehydration possibilities of the processed material. For this procedure, you must use a nontoxic plastic bag, suitable for food packaging as primary, which remains protected by secondary packaging of nontoxic plastic barrels of first use or food cardboard. Before closing it, air must be removed from the bag with help of a vacuum pump. Storage should be in dry conditions, with mild temperature and away from light. For fractional packing of bee pollen, it is suggested placing silica gel pads for foods – that will keep humidity level of the product stable (Brasil, Citation1997).
3. Inexpensive pollen load authentication by means of computer vision and classification algorithms
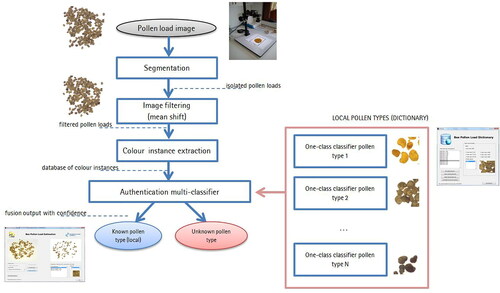
Bee-keepers, bee-keeping associations, and laboratories are interested in detecting fraud in pollen, and require tools to standardize and authenticate bee pollen origin to guarantee their nutritive and health benefits. Microscopic analysis of pollen grains, which form bee pollen loads, is a precise method for identifying pollen origin. However, this process requires the laboratory work of melissopalynology experts, and is thus time consuming and costly. There have been many attempts to automate pollen grain identification by computer algorithms but there is no inexpensive, complete, and automated process (Allen, Citation2006; Boucher et al., Citation2002; Rodríguez-Damián et al., Citation2006). Image processing techniques and one-class classification algorithms can be used to identify unknown pollen types. Concretely, the mean shift algorithm (Comaniciu & Meer, Citation2002) filters the pollen image and is used to homogenize pollen load color information. Then, one-class classification algorithms (Chandola et al., Citation2009; Moya et al., Citation1993) identify each local pollen type. The method makes use of a multi-classifier algorithm, designed to aggregate one-class classifier outputs, given a unique response with a confidence measure. Finally, an ambiguity discovery algorithm is also included to detect identical pollen type and reduce misclassification.
The chapter provides general details of the algorithms involved in the methodology, describes the necessary hardware for the standard method, and presents the results of applying the image processing algorithms and one-class classifiers. In addition, the chapter presents the overall process to create a software dictionary with known local pollen types, how to use the graphical user interface, and a guide to separate and analyze the pollen loads of the images by type. The validation of the proposed standard methodology is carried out for the authentication of four pollen types, Cistus ladanifer, Rubus, Echium, and Quercus ilex, which serve as an example of the methodology (Otero & Losada, Citation2002). Totally, a dataset of around 2000 instances has been used to validate the trained system.
3.1. General overview of the method
shows the outline of the method. In a nutshell, it starts with preparation of a pollen load sample to acquire the image by the computer vision system. Second, the pollen loads of the image are segmented from background (see Section 3.2.1) and filtered (see Section 3.2.2). Third, the color instances of the processed pollen loads are used to train a multi-classifier model based on one-class classifiers (one for each local pollen type). Finally, the multi-classifier outputs the authentication of each color instance, classifying them as a known local or non-local (outlier) pollen type. Section 3.2.3 provides more details about the classification algorithms.
Figure 8. The proposed standard method for detecting unknown pollen loads. The processing chain finishes with an authentication output.
3.2. Description of the computational techniques
3.2.1. Segmentation algorithm
The Otsu segmentation algorithm (Otsu, Citation1979) is the one applied to the gray-scale image to extract the pollen loads from the background. Later, a morphological opening operation is applied to the thresholded binary image (Gonzalez & Woods, Citation2008). The goal of this computer vision operation is to remove those small objects having less than 50 connected pixels in an 8-connected neighborhood.
Those pixels extracted in the latter phase are analyzed by the remaining processing algorithms. Their color information can be represented in several ways. The most common is the RGB space where colors are represented by their red, green, and blue components in an orthogonal Cartesian space. However, the RGB space does not represent the higher levels processes which allow human color perception. Color is better represented in terms of hue, saturation, and intensity, as HSI or HSV spaces do (Lucchese & Mitra, Citation2001). However, the latter color spaces are not perceptually uniform. The CIE and and
are ideal for color recognition because of the following three properties: a) separation of achromatic information from chromatic information, b) uniform color space, and c) similarity to human visual perception. In these color spaces, for instance, the Euclidean distance between two color points can be easily calculated. This property will ease the work of the classification algorithms.
3.2.2. Homogenizing the pollen loads of the image by mean shift filtering
Each extracted pollen load from the image has many different color values, possibly as many as pixels contained in the load. This has a negative impact on pollen load color authentication since human experts identify each pollen load as a unique color. Therefore, we need a procedure of homogenizing the images of pollen loads, which is divided into three different steps:
First, we apply an image processing algorithm before using the classification methods. The goal is to homogenize and smooth the large quantity of different color points of a pollen load in just a few unique and representative color instances. One of the best methods for discontinuity-preserving smoothening in image processing is the mean shift algorithm, proposed in Comaniciu and Meer (Citation2002), and in line with the feature space analysis. The main strengths of the mean shift algorithm are: (a) it is an application independent tool, (b) it is suitable for real data analysis, (c) it does not assume any prior shape on data clusters, (d) it can handle arbitrary feature spaces and (e) it has only one parameter, the bandwidth selection window size. The mean shift procedure, originally presented by Fukunaga and Hostetler (Citation1975), is a procedure for locating the maxima of a density function given discrete data sampled from that function. It is also an iterative method, starting with an initial estimate or points
and a
2.When both domains are concatenated, the dimensions of the joint spatial range domain are compensated by a proper normalization. Thus, the multivariate kernel is defined as the product of two radially symmetric kernels, and the Euclidean metric allows a single bandwidth parameter for each domain:
where is the spatial part,
is the range part of a feature vector,
the common profile used in both domains,
and
the kernel bandwidths, and
the normalization constant. A kernel process usually provides satisfactory results and then the user just has to provide one parameter
which controls the size of the kernel, and thus the smoothening resolution. Nevertheless, replacing the pixel in the center of the window by the average of the pixels in the window blurs the image. Discontinuity-preserving smoothening techniques, on the other hand, reduce the amount of smoothening near abrupt changes. The mean shift algorithm uses a bilateral filtering which works in the joint spatial-range domain. The data are independently weighted in the two domains and the centered pixel is computed as the weighted average of the window. The kernel in the mean shift procedure moves toward the maximum increase in joint density gradient, while bilateral filtering uses a fixed static window.
3.The last step is the application of the mean shift filtering algorithm. The algorithm works as follows. Let
Initialize
Compute
Assign
The spatial bandwidth has a distinct effect on the output when compared to the range (color) bandwidth. Only features with large spatial support are represented in the filtered image when increases. On the other hand, only features with high color contrast remain when
is large.
3.2.3. One-class multi-classification algorithm based on distance
In Chica and Campoy (Citation2012) authors compared four different one-class classification approaches for the problem: Gaussian, Parzen classifier, SVDD and The
algorithm with
showed the best performance. Then, this is the proposed algorithm for the pollen recognition system.
originally provided by Dasarathy (Citation1991), is a distance-based one-class classifier based on the assumption that normal data instances occur in dense neighborhoods while anomalies occur far from their closest neighbors. The basics of the algorithm for one-class classification is that the anomaly score of a data instance is defined as the distance with its
nearest neighbor in each dataset.
Nearest neighbor classifiers always require the definition of distance or similarity measures between two data instances. For continuous features, the Euclidean distance is the most popular choice. In the case of choosing as the parameter of the algorithm, each new instance
will be considered as target or outlier depending on the classification of its closest neighbor in the training data.
In multi-class anomaly detection (our pollen authentication problem) training data contains labeled instances belonging to multiple normal classes but it does not contain anomalous instances. A test instance is considered anomalous if it is not classified as normal by any of the classifiers. To do this, a confidence score obtained from the prediction output of the classifier is normally provided. If none of the classifiers are confident in classifying the test instance, the instance is then labeled as anomalous (Chandola et al., Citation2009).
We have followed the latter approach, modeled as follows: being a set of known local bee pollen load types, the training data will contain instances belonging to
classes. In order to use one-class
classifiers and be able to reject unknown pollen load types, we have to decompose the classification system in
binary sub-problems. Thus, we will train
different
classifiers:
An ensemble scheme is used to fuze all of them in a multi-class authentication output.
Therefore, for each pollen color instance we first map each one-class classifier output
to a posterior probability
These probabilities are also normalized in the range
The posterior probability of each classifier’s target can be considered as the confidence
for one instance
to belong to class
In order to classify an incoming pollen load sample as one of the
possible pollen types we build a multi-classifier. The multi-classifier will compare the confidence
of all the one-class classifiers and will provide a global prediction from the most reliable one-class classifier. The multi-classifier prediction
is given by:
(3)
(3)
3.2.4. Multi-classification confidence and ambiguity discovery process
It is also necessary to estimate the confidence of the multi-classifier prediction. To do this we first introduce two parameters, and
as done in Goh et al. (Citation2005) in EquationEquations (4)
(4)
(4) and Equation(5)
(5)
(5) :
(4)
(4)
(5)
(5)
is the highest confidence factor from the
binary one-class classifiers and determines the multi-classifier prediction class
However,
might not be enough to estimate the global confidence of the multi-classifier prediction. This is the reason for introducing the second parameter, the multi-class margin
Wrong predictions could have high
but small
Then, correct predictions must have high multi-class margin values
Goh et al. (Citation2001) showed that there is a better separation of correct from erroneous predictions if the multi-class margin variable is used. After a preliminary experimentation, we set parameters and
to 0.5 and 0.01, respectively, to be used in the final decision stage of the multi-classifier, as shown in the rule of EquationEquation (6)
(6)
(6) .
(6)
(6)
Sometimes, one or more bee pollen types could have exactly the same color description as another. In that case, the multi-classification system must be able to detect, during the training phase, that one incoming local pollen type is identical to one already existing (i.e., it is already included in the dictionary). The goal for the software prototype is to also warm the user not to introduce duplicated entries in the dictionary. This mechanism is called ambiguity discovery. Being
a sensitivity-specificity error of a multi-classifier before the inclusion of the new pollen type, and
the error of a multi-classifier after the inclusion of the classifier of the new pollen type, we define
as the difference between them. In our case we have used the F-measure (van Rijsbergen, Citation1979) as the
error measure.
The ambiguity discovery process is launched every time the parameter is higher than a fixed value. Then, if
exceeds a threshold value, ambiguity discovery is triggered, and the process works as follows:
The confusion matrix of the new multi-classifier for the testing data is computed;
The maximum value of
The user is asked about merging conflicting classes
The multi-classifier is trained according to the response of the user in the third step.
3.3. Experimentation
Section 3.3.1 explains the data used for the experimentation. Section 3.3.2 explains the image processing and filtering results. Section 3.3.3 presents the results to analyze the behavior of the one-class classifiers and multi-classification systems. Finally, Section 3.3.4 shows the validation of both the software prototype and proposed standardization process.
3.3.1. Experimental setup: equipment and data
The main equipment used in the experiments is composed of:
Camera and optics device to obtain images of the pollen load samples. The resolution does not need to be extremely high since only color and edge information will be processed. (Example: color camera uEye UI-1485LE-C (www.ids-imaging.com) with an Aptina CMOS sensor in 5 M Pixels resolution (2560 × 1920 pixels). The light-weight housing of the UI-1485LE features a C/CS lens mount with adjustable flange back distance. A focal lens obtained from Goyo Optical (www.goyooptical.com) is also used.
The lighting conditions are decisive and must be controlled. An external lighting generator, which points out the pollen load sample is employed to ensure that the color of the pollen loads do not change for the different runs. The external lighting consists of a 50 LED-based ring light from CCS Direct Lighting (www.ccsgrp.com). This lighting device can be mounted on a CS mount.
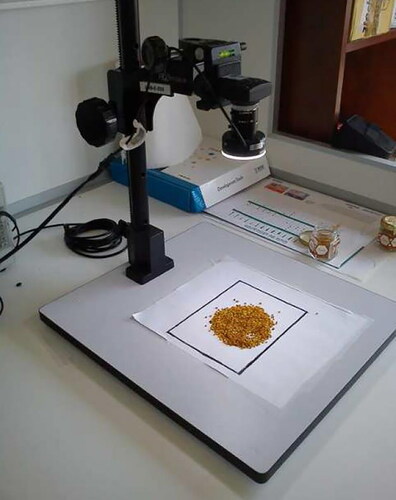
A support device is needed to allow a fixed position for the camera, lens, and lighting. The sample of pollen loads is placed on the base of this supporting device in order to get a stable and low-cost system to acquire images of the sample for a posterior processing and analysis (see ).
Figure 9. The computer vision system needs inexpensive hardware such as a camera and a stand to control illumination.
Finally, a computer must be connected to the camera via USB to install the software. Proprietary software can be used to take snapshots of the pollen load samples. Then, the proposed computer vision and classification system will be controlled by the software prototype to ease the labor of the expert.
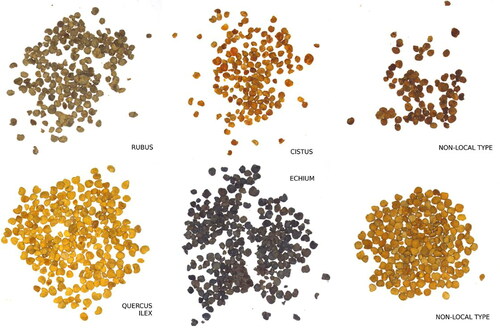
Different samples from Spanish bee pollen loads were obtained from beekeepers to build the authentication models and validate them against nonlocal samples. Samples belonging to four Spanish local pollen types (Rubus, Echium, Cistus ladanifer and Quercus ilex) and non-local samples were identified, labeled, and grouped by experts. shows these pollen loads samples. In this figure we can see how, even for experts, the separation and classification of the pollen loads by color is difficult and subjective. One can also see in the figure how non-local samples can be misleading (bottom right loads of ).
Figure 10. Different images of pollen load samples which were taken with our vision system. Left and central images belong to known pollen types (Rubus, Cistus ladanifer, Quercus ilex, and Echium, respectively). Right images are non-local samples and must be rejected by the system.
3.3.2. Image processing results
The first step of the method is processing the images of the pollen samples (taken in TIFF format and resolution of 1024 × 768 pixels). The software will apply the filtering algorithm after segmenting pollen loads from background. As explained in Section 3.2.2, the selection of an appropriate bandwidth parameter for the mean shift algorithm is not trivial. This selection depends on the type of images. The implemented mean shift algorithm receives the spatial bandwidth the range bandwidth
and the minimum segment area in number of pixels. The last parameter is fixed to a high value (20 pixels) not to segment a pollen load into different parts.
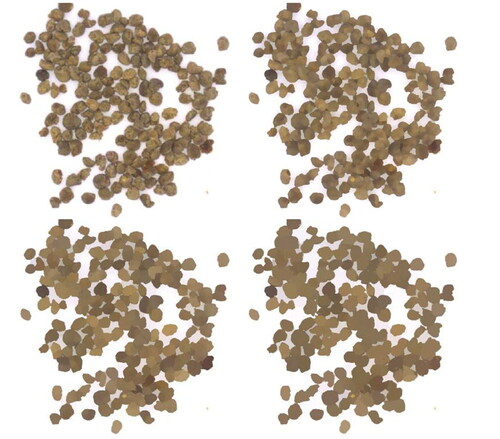
The selection of the other two parameters is more difficult. High spatial bandwidth values merge different bee pollen loads because they are normally close to each other. Low range bandwidths do not effectively aggregate the entire color information of the pollen loads. We conducted a preliminary experiment with different values. In order to illustrate the importance of this parameter selection, we show in an original Rubus data sample together with three output images after applying the filtering algorithm with different values of 7, 15, and 30. Additionally, it is important to remark that higher bandwidth values mean higher computational time. Thus, we set the bandwidth values to
for the experimentation, which seems one of the best parameter combination for this pollen load authentication problem.
Figure 11. Original image and resulting images after applying the mean shift algorithm (varying spatial bandwidth to 7, 15, and 30, respectively).
We generate, from the processed and filtered images, a set of 3146 color instances. Each color instance has three input features, corresponding to the color space values, and its class (one of the four pollen types or an outlier class). From this set of color instances, 400 of them are used for training the four one-class classifiers (100 for each pollen type), 800 to test the one-class classifiers (400 belonging to the four know pollen types and 400 were outliers). The rest of the 1946 instances are used to validate the multi-classification system (Section 3.3.4). summarizes these groups of experimental data.
Table 1. Description of the three independent datasets used to train, test the classifiers, and validate the one-class multi-classifier.
3.3.3. Numerical performance of the multi-classification algorithms
In this section we employ the classification accuracy, false negative and positive rates, F-measure, and confusion matrix to numerically validate the multi-classifier performance. A false negative (FN) occurs when the outcome of the classifier is incorrectly predicting as outlier when it is actually a target. A false positive (FP), on the other hand, occurs when the outcome is incorrectly predicting as target when it is actually an outlier. The FN rate measures the number of FNs out of the total number of negatives or outliers, and the FP rate calculates the fraction of FPs divide by the total number of positives or target instances (Witten & Frank, Citation2005). The F-measure provides a relation between the precision and recall of the classification results (van Rijsbergen, Citation1979).
First, we analyzed the performance of the classification method for the authentication of each of the selected local bee pollen types in isolation. These results are obtained by classifying the test dataset with the train one-class classifiers. The classifiers are trained without rejecting any training instance as outlier (rejection threshold equal to 0%). shows the evaluation measures of the classifiers for each pollen type. By observing figures of we can conclude that the FP rate is almost 0. This means that the classifiers are able to correctly identify all the outliers (non-local pollen types) without misclassifying them as local pollen types. The FN rate is higher than the FP rate although its value is low, 9% in the worst case (Echium pollen type).
Table 2. Evaluation measures obtained by the one-class kNN classifiers for each of the four pollen types.
shows the performance measures of the final multi-classifier. In the first block of figures we show the accuracy and FP-FN rates when rejection threshold equals 0%. In the second block, a rejection threshold of 10% is used for obtaining the results. The algorithm, with a rejection of 10%, is the model having the best results as it has low FP and FN rates, and has the highest accuracy.
Table 3. Evaluation measures of the final multi-classifier.
Finally, shows the confusion matrix of the best multi-classifier configuration with a algorithm with a rejection of 10%. The reader can see that, in general, there is no miss-classification between the known pollen load types. There is just one miss-classified instance by the
multi-classifier. The highest error is in the right column. These are FNs because real pollen load type instances are classified as outliers (non-local pollen types). Nevertheless, as it can be seen in , the FN rate is low.
Table 4. Confusion matrix of the multi-classification system formed by the four one-class kNN classifiers (one for each pollen type).
From the results, we can also see that the tradeoff between FP and FN rates is better than in the isolated one-class classifiers. This fact comes from the confidence mechanism of the multi-classifier, able to discard instances classified by one of the one-class classifiers as local pollen types when they are not clearly confident about their decision. Although accuracy is obtained when classifying all the classes (four known pollen types and outliers), the FP and FN rates are calculated between the classification of the instance as known pollen type (one of the four known types) or as outlier. There is almost no error when classifying among local pollen types.
Finally and by comparing the validation measures of the multi-classifiers and the one-class classifiers, it can be concluded that the overall results of the multi-classifier are better than the independent one-class classifiers. This fact indicates a good behavior of the whole fusion scheme for detecting the known pollen type classifiers.
3.3.4. Validation of the complete prototype
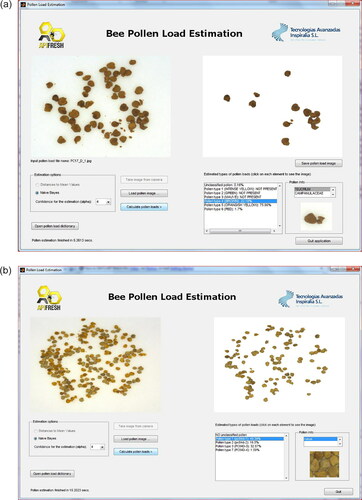
The proposed software prototype includes the software methods to manage and create local pollen types, train the models, and validate the whole process. The software prototype was programmed in MATLAB using some functions of the DD tools library (Tax, Citation2011). Initially, the user needs to train the system with the known local samples. The user must manually separate pollen types as shown in . By using the dictionary tool of the software prototype, the user can also save her/his local (known) types. See for instance where an entry called Rubus is introduced into the system. After performing the training phase of the system, a new incoming pollen samples can be processed to start with the automatic pollen loads separation by color. Some screenshots of the software application are provided in . In these images, one can see the graphical user interface with the list of separated pollen loads by type, the entries of the dictionary, and final output of the multi-classification algorithm.
Figure 12. Pollen load samples separated by an expert to train the system.
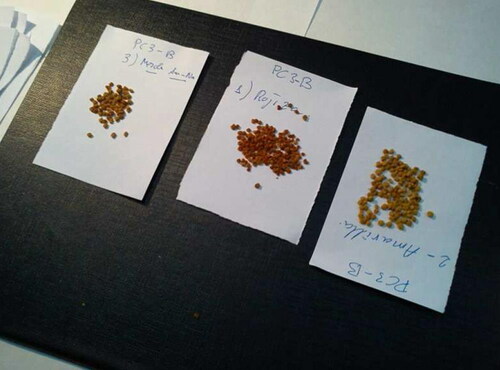
Figure 13. Screenshot of the prototype pollen dictionary. The ambiguity discovery algorithm checks if there is an existing pollen type having identical features compared to the new sample.
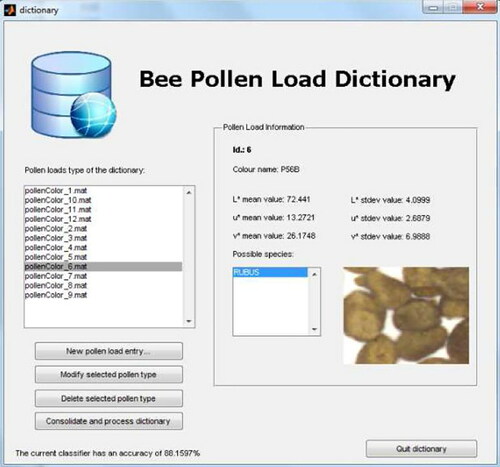
Figure 14. (a and b). Two screenshots of the prototype software detecting a local pollen type in the pollen load images.
3.4. Concluding remarks
The propose standard methodology used a chain of methods based on computer vision and classification techniques for authentication the origin of bee pollen loads. This process can be used to check and detect fraudulent samples. A one-class multi-classification scheme based on and its merging scheme improve the accuracy of isolated classification methods and is able to provide a final global output. The best multi-classifier configuration, formed by
one-class classifiers, is able to achieve a 94% accuracy when detecting local pollen types. The model has been validated in 1946 colors instances for the authentication of four Spanish pollen types against different outlier samples. The use of the presented standard methodology drastically reduces the time and effort spent by experts to several seconds and can be used as a standard method for macroscopically rejecting unknown pollen loads. Future work can be devoted to apply a more interpretable multi-classification system such as linguistic rule-based classifiers. In that way, the users of the standard method could understand the reason why a sample is rejected as known local pollen type.
4. Evaluation and classification of corbicular pollen morphology
The evaluation of quality of the corbicular pollen is one of the areas which lacks unified and standardized evaluation systems. However, descriptors used in the evaluation of genetic resources of cultivated species of plants could be a suitable system for the evaluation and characterization of various types of corbicular pollen.
Among other analyzes, the technical parameters of the corbiculae, may be an important marker for assessing the geographical and botanical origin and subsequently the nutritional quality of corbicular pollen. The industrial production, however, requires methods for the identification of corbicular pollen that can be systematically included into the production chain. What the plant species a corbicula is composed of, and what the plant composition and their proportionality is in the overall pollen lay, are the indicators of the geographic and botanical origin of the corbicular pollen (Carrión et al., Citation2003).
Briefly, the pollen color can distinguish the types of corbicular pollen and it mainly depends on factors such as pollen maturity, moisture, drying, pigments and the actual plant source (Nôžková, Brindza et al., Citation2010). The authors suggest a variety of colors ranging from white, yellow, orange, red, with a greenish tint, to black and its shades. The works also present a common fact: the color of the flower pollen varies with the color of the corbicular pollen of the same plant species (Chica & Campoy, Citation2012; Reiter, Citation1947).
The information regarding the size of corbiculae is very scarce in the literature. The authors mention the size only indirectly – either using the parameter of weight, or the number of pollen grains in one corbicula (Rodríguez-Damián et al., Citation2006). The size, shape and surface of the pollen grains, the corresponding botanical origin, size of the openings in the pollen trap, beekeeper's handling of the corbiculae after harvesting, etc., are all factors that have a decisive effect on the shape and size of the corbiculae, and so also on its the quality. The ornamentation of the exina of the pollen grains can cause differences in the structure of the corbicula surface.
4.1. Characteristics of corbicular pollen samples
The selected samples of corbicular pollen, frozen and store at the temperature of −11 °C to −18 °C, immediately after collection.
4.2. Methodology for assessing the morphometric characters of corbicular pollen
Quantitative and qualitative characteristics will be under evaluation of morphological parameters of corbicular pollen collected by the honey bees. For each characteristic is designed and defined the methodology of evaluation. Then a database of detailed image recordings is created. The corbiculae in each sample is placed on a glass slide using a fully automatic magnifying glass, for instance, Zeiss Discovery with a digital camera AxioCam, or similar. The corbiculae are placed on the glass slide in the same direction. The upper part of the corbiculae in the image is always the depression created by placing the pollen around the bee leg inside the pollen basket.
4.2.1. Methodological procedures for evaluating the quantitative characteristics
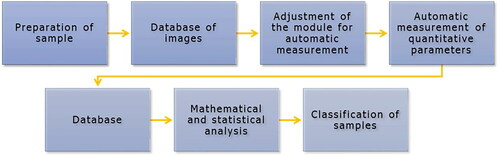
In the selected quantitative traits evaluate the corbiculae by using the image analysis software Zeiss Axiovision or open source software like ImageJ with the corresponding modules (plugins) for automatic measurement (). In the case of corbicular weight, conduct the measurement on precision analytical scales. The following section presents the assessment methodology of quantitative characteristics, which were published in Nôžková, Ostrovský et al. (Citation2010).
Figure 15. Flowchart of image analysis.
Corbicula size. The size of corbiculae determines eight quantitative traits – bound height (mm), bound width (mm), Feret minimum (mm), Feret maximum (mm), shape index, symmetry, diameter (mm) and area (mm2). The methodological procedure for the assessment of these characteristics is based on the manual for the Axiovision software.
Corbicula bound height. Indicates the height (in the y axis) of a bound square for the selected area. The square is drawn parallel to the x and y axis (). Unit of measurement: mm.
Figure 16. Evaluation of corbicula size characteristics.
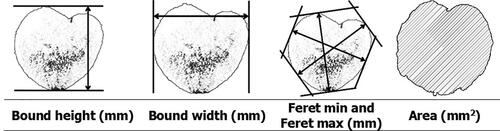
Corbicula bound width. Indicates the width (in the x axis) of a bound square for the selected area. The square is drawn parallel to the x and y axis (). Unit of measurement: mm.
Feret maximum and Feret minimum. This trait is based on the measurement of a minimum and a maximum distance. Two parallel lines are place on the opposite sides of the object in 32 positions and evenly rotated by the respective angle (). The corresponding distance is measured in each position. The maximum value is Feret maximum and the minimum value is Feret minimum. Unit of measurement: mm.
Shape index (bound width/bound height). This parameter is determined by calculating the two values. It is not expressed by any unit. It can be used only if the width and height of the corbicula has been correctly specified. The shape index helps us express the shape of the object. If the value is > 1, the object is flatter. If the value is < 1, the object is taller. If the value approaches 1, the object has a round shape – it is equally as wide as it is tall.
Symmetry or Feret index (Feret min/Feret max). This is a parameter determined by calculating the two measured values. It is not expressed by any unit. With this parameter, it is possible to express the shape of the object. Possible values range from 0 to 1. The values approaching 1 indicate the presence of compressed or round objects. Feret min and Feret max have approximately the same value. If the parameter has a low value, the objects are long, elongate or oblong.
Diameter. It is assumed that the measure area is a circle. This surface is then use as a basis to calculate the corresponding diameter. Unit of measurement: mm.
Area. This is determined by the boundaries of the object by distinguishing the limit color of the object from the background (). Unit of measurement: mm2.
Corbicula weight (mg). Each corbicula is weighed on accurate laboratory scales.
From each sample select healthy and typical corbiculae. The minimum number is 5 and the maximum is 100 corbiculae per sample.
4.2.2. Methodological procedures for evaluating the qualitative characteristics
For the evaluation of qualitative traits, the set of corbiculae should be as big as possible, that it will cover the widest variability of the select characteristics. The qualitative characteristics of the corbiculae can be evaluated visually in digitalized images. From each sample select healthy and typical corbiculae. A database of detailed recordings, should be done with a fully automatic macro magnifying glass, for instance, Zeiss Discovery with a digital camera AxioCam (or similar). The following section presents the assessment methodology of the qualitative characteristics (Nôžková, Brindza et al., Citation2010).
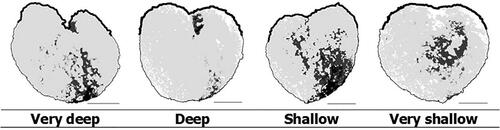
Corbicula shape. For the evaluation of the corbicula shape, from three characteristics can be chosen: shape, heart shape and cutout depth. The variability in these characteristics is shown in and .
Figure 17. Evaluation of corbicula shape.
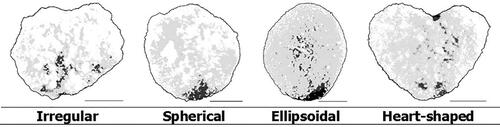
Figure 18. Evaluation of corbicula heart shape.
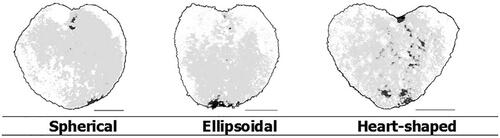
Figure 19. Evaluation of corbicula cutout depth.
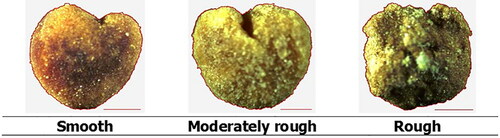
Corbicula surface. The variability in this characteristic is shown in the and .
Figure 20. Evaluation of corbicula surface.
Corbicula color. The color of the corbicula can only be assessed on samples of homogeneous color, i.e., samples of monofloral pollen. Color evaluate by using a visual color grading scale by Royal Horticultural Society (RHS) (2004) (or similar), which represents a universal color system with the respective color codes.
4.2.3. List of descriptors and classification
4.2.3.1. General structure of descriptors list
The list of descriptors designed for the evaluation of genetic resources of cultivated plant species have always been specifically attuned to a particular plant species or genus.
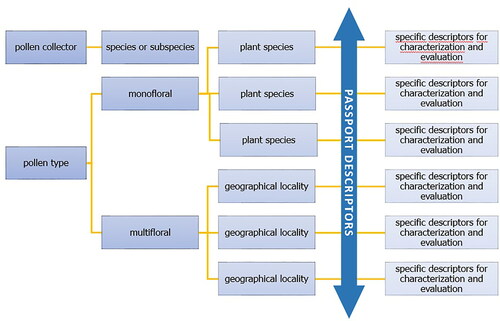
Each list of descriptors consists of three main parts – the manual, passport descriptors and descriptors for evaluation and characterization. The manual contains the information on the structure and use of the descriptors, as well as the general principles for assessing the samples. The passport descriptors are designed according to the nature of the evaluated object and provide identification and passport data on the assessed sample. The descriptors for evaluation and characterization are designed based on the study of variation in quantitative and qualitative characteristics. Using these descriptors, the morphological, biological and economic characteristics are evaluated. When creating a list of descriptors for the corbicular pollen, it will always be necessary to specify the type of insect involved in the creation of the corbiculae and the descriptors for characterization and evaluation will be designed specifically for the different types of monofloral pollen, the predominant plant species and especially in the case of multifloral corbicular pollen, according to the geographical origin ().
Figure 21. Flow chart of the descriptors list structure.
4.2.3.2. Passports descriptors
The passport descriptors provide general information about the accession included in the collection and the management of growth (characterize by the collection method, storage and handling of the accession). The passport descriptors should define the mandatory information to identify the originality of the accession (Haussmann & Parzies, Citation2009). In the case of genetic plant resources, the passport data are exchange, and for the individual institutions to be able to communicate with each other, an international standardize list of Multi-crop passport descriptors (FAO/IPGRI, 2001) was created.
To evaluate the quality of corbicular pollen, it is also necessary to design the passport descriptors, which will guarantee the authenticity and identify the specific properties of the evaluated sample. What we consider to be the most important step is that the passport descriptors also determine the botanical and geographical origin. This means, it should be clear whether the pollen in question is monofloral or multifloral. In the case of multifloral pollen, the geographic origin should be identified, which ensures the representation of specific plant species.
Similar to plant species, even the corbicular pollen should have passport descriptors universal for all types of pollen. Despite the very high heterogeneity between the types of corbicular pollen, they should be designed in a way that they can be used to collect the necessary information be it in monofloral or multifloral pollen.
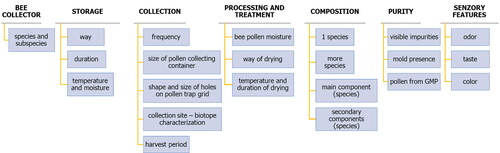
The following section contains a draft structure of passport descriptors (). The information on the insect species or subspecies creating the corbiculae should come first. It should be followed by information on the collection by the beekeepers, i.e., the collection frequency, pollen trap characteristics, growing season and habitat characteristics. What is also important is the information on storage (method, length, temperature and humidity) and pollen processing (moisture, drying method). They should also include information on purity, i.e., presence of visible impurities, mold or whether the pollen comes from genetically modified plants (GMPs). The sensory characteristics such as flavor, color and taste, are also an important identifier of the specific characteristics and authenticity of pollen.
Figure 22. Descriptor structure.
4.2.3.3. General structure of characterization and evaluation descriptors
A descriptor is an independent rating system for one specific characteristic. We use them to describe quantitative or qualitative characteristics.
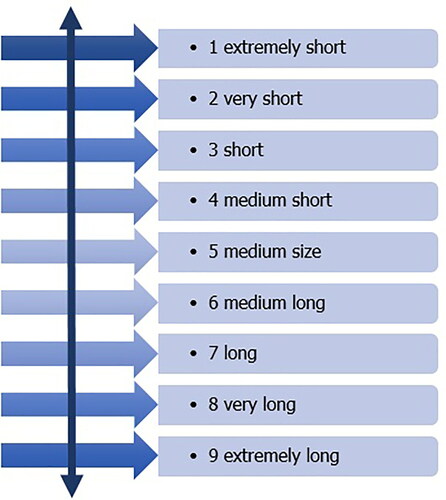
The structure of each descriptor is the same (), which is a big advantage ensuring their universal use. Descriptors consist of a maximum of 9 classification grades (). The minimum number of classification grades is two. Their number is proposed according to the observed variability in the characteristic.
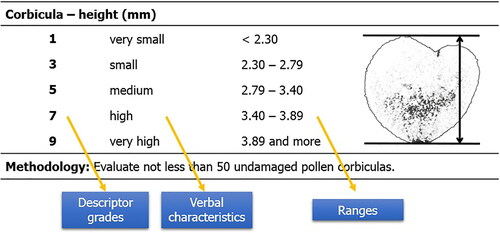
For each classification grade, the respective verbal description is proposed. In the case of quantitative characteristics, the individual classification grades should come with intervals (ranges). An important part of the descriptors is the assessment methodology with concise diagrams and pictures that describe the evaluation in detail.
4.2.3.4. Methods and techniques for creating and modifying the descriptors
A descriptor, which was included in the list of descriptors, covers the known variability of morphological, biological or economic characteristics and properties. If a new characteristic or trait is discovered in the future, which better characterizes and identifies the evaluated objects, the methods and techniques for creating new or modifying the existing descriptors should be observed. In the next section we present the procedures and rules for the creation and design of various parts of the descriptor for the purpose of characterization and evaluation.
Completeness. The descriptor grades should be designed to allow for any measured value or trait in the characterized sample to be included into the respective grade. This rule applies to both quantitative and qualitative characteristics (). In the case of quantitative characteristics, the intervals must be clearly defined. Also, a specification whether the range is open or closed should be included ().
Table 5. Descriptor for quantitative character – principle of completeness.
Table 6. Structure of open and closed intervals in descriptor grades.
Unambiguity and uniformity. A descriptor is a ranking system with a clear identification of what, how, when, and to what extent it evaluates. An adequately designed methodology, pictures, diagrams and classification levels helps maintain the overall unambiguity. The descriptor should be used uniformly to evaluate the given characteristic. This means that all evaluators should use the same procedure for characterization and classification.
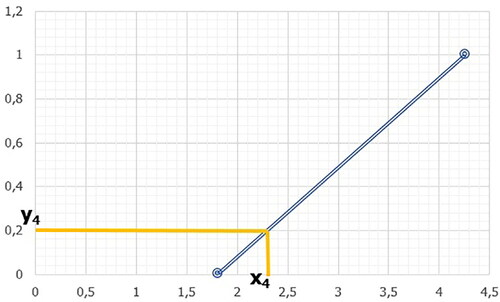
Measurement ranges. In order to ensure the unambiguity in the evaluation of quantitative characteristics (in the case of a continuous scale), the classification grades are recommended to be supplemented by ranges. By specifying the respective ranges, misinterpretations in the characterization of samples are avoided. One of the ways to create the evaluation scales is using the principle of membership function in the fuzzy set (Nôžková et al., Citation2011).
a. The first important step is to determine the limit values in the given characteristic. This means that it is necessary to determine the minimum (xmin) and maximum limit (xmax), which can be achieved in the evaluated characteristic independent of the environmental conditions.
b. Based on the defined limits, the equation is expressed as follows: The straight line is uniquely determined by two points (xmin, ymin); (xmax, ymax).
In our case, xmin = minimum limit and xmax = maximum limit, ymin = 0 and ymax = 1 (). Thus, the equation for the line is
Figure 23. Visual representation of the line for the limit points xmin = 1.81; xmax = 4.26 and the coordinate “x4” to the point “y4.”
The above equation is used to express the variable "x" necessary to calculate the limit points of the individual ranges
c. The values of “y1” to “y19” (0.05, 0.1, 0.15 to 0.95) are then sequentially assigned to variable "y." The variable "x" represents the coordinate we are trying to find to the respective point "y" (). The value of the variable "x" calculated according to Equation (2.3) is the limit point for the respective descriptor range ().
Figure 24. Flowchart of the passport data structure.
An illustrative example of 5 levels in a descriptor for the height characteristic where xmin = 1.81; x max = 4.26 and the value of “y1” to “y19” (0.05, 0.1, 0.15 to 0.95) were attributed to variable “y” ().
Table 7. Calculated value of variable “x.”
Table 8. Determination of limit points in ranges for five descriptor levels.
Table 9. Ranges of 5 descriptor levels for height.
4. Grading scales for qualitative characteristics. In the qualitative characteristics with a nominal range (color, shape, etc.), the classification grades are consecutive. Their number depends on the observed variability in the characteristic. The classification grade "9 – Other" is open to the newly detected variability in the characteristic (). In the case of ordinal scales (color intensity, etc.), the classification grades are not consecutive but follow the polarity of verbal characteristics (). In alternative characteristics, grade "1" refers to the absence of the given feature in the characteristic, and grade "9" refers to the full presence of the feature ().
Table 10. Descriptor for qualitative character – structure of grades.
Table 11. Descriptor for qualitative character – structure of grades in the case of ordinal scale.
Table 12. Structure of alternative character.
5. Polarity of verbal description. In the descriptors for quantitative characteristics, it is necessary to follow verbal polarization (). This means that the classification grade 1 represents something extremely small and grade 9 something extremely large.
Figure 25. Polarity in verbal description.
6. Descriptor name. The name of the descriptor should be concise, it should accurately determine the evaluation area and it should be integral. The name should employ correct terminology and its structure should be uniform throughout the list of descriptors (Biodiversity International, Citation2007).
7. Evaluation methodology. The methodology should contain the evaluation details, i.e., how much material from the sample is to be assessed in order to get a representative result, what the assessment period is, as well as other information specific to the given characteristic ().
Table 13. Complete descriptor with methodology and pictures.
Table 14. Descriptor for characteristic – corbicula – height (mm).
Table 15. Descriptor for characteristic – corbicula – width (mm).
Table 16. Descriptor for characteristic – corbicula – Feret maximum (mm).
Table 17. Descriptor for characteristic – corbicula – Feret minimum (mm).
Table 18. Descriptor for characteristic – corbicula – shape index (width/height).
Table 19. Descriptor for characteristic – corbicula – symmetry (Feret min/Feret max).
Table 20. Descriptor for characteristic – corbicula – area (mm2).
Table 21. Descriptor for characteristic – corbicula – weight (mg).
Table 22. Descriptor for characteristic – corbicula – texture.
Table 23. Descriptor for characteristic – corbicula – shape.
Table 24. Descriptor for characteristic – corbicula – heart shape.
Table 25. Descriptor for characteristic – corbicula – cutout depth.
Table 26. Evaluation of corbicular color (Nôžková, Brindza et al., Citation2010).
Table 27. Descriptor for characteristic – corbicula -color.
8. Drawings and pictures. It is appropriate that the methodology be supplemented with concise diagrams, drawings and pictures. These help the evaluator to clearly and consistently determine the correct classification grade in the descriptor and to avoid confusion caused by undesirable side effects.
5. Identification of the floral origin by microscopy
Pollinic analysis by microscopy is one of the first steps and one of the very important because once the pollen morphology is identified, it is possible to infer the characteristics of the geographical regions where the BP was obtained, as well as the habitat of forest, fields and crops (Barth et al., Citation2010; Corbi et al., 1985; Dias et al., 2012; Rodríguez-Damián et al., Citation2006). This method is based on two stages: the first consists in the identification of the pollen grains that are under observation and the second one aims to count them (http://www.apiservices.com/abeille-de-france/articles/pollinic_analysis.htm). Pollinic analysis allows scientists to infer the vegetation present in the area and to date and ascertain any biodiversity changes, as for example, the presence and distribution of invasive or exotic plants. Also, allows the scientists to distinguish if the pollen is monofloral, bifloral or multifloral, or if the pollen grains present different color means that belongs to different botanical species (Nogueira et al., Citation2012). The application of Pollinic analysis in paleoclimatic reconstruction has been reported (Li & Flenley, Citation1999; Rodríguez-Damián et al., Citation2006). Some other studies revealed that BP analysis provides important information about the plant preferences of honeys bees (Chaturvedi, Citation1973). Therefore, BP load analysis indicates the behavioral pattern and sense of selection of plants for food (Sharma, Citation1970). Moreti et al. (Citation2002) referred that allows the identification of the major pollen sources used by the bees, as well as the periods of pollen production in the field and possible times of shortage. By another side, Arroyo et al. (Citation1986) referred that the determination of the flora where the bee products are originating is certainly of great interest to plan rationally the exploiting of natural resources. This knowledge allows us to know the geographic origin of these products, so avoiding counterfeits of origin (Ricciardelli, Citation1982). While these analyzes (Melissopalynology) are important to the aspects mentioned above, it’s important to highlight that the process of counting and classification of pollen grains are much laborious and time consuming due to the fact that they are done manually by highly skilled experts. Therefore, a high level of training is required for obtain reliable identification results (Rodríguez-Damián et al., Citation2004, Citation2006). The classification of the different aspects of the structure used to the analysis of pollen by microscopy will be referred in Section 5.3 and complement the full characteristics. Accordingly to the Dictionary.com (http://dictionary.reference.com/browse/pollinic), pollen is defined as “male grain gametophyte generation of seed-bearing plants. In gymnosperms, each pollen grain also contains two sterile cells (called prothallial cells), thought to be remnants of the vegetative tissue of the male gametophyte.”
5.1. Structure of the pollen grain
Pollen is a granular mass of male reproductive cells produced in the anthers of a flower. A pollen grain is a living cell surrounded by two protective coats, the intine and exine. The cell contains cytoplasm and nucleus. On the surface are apertures or germinal pores or furrows. The detail structure of a pollen grain and pollen grain wall is shown in and . The inner layer or intine is thin, delicate and very elastic. It is semi-permeable membrane and does not stain. When the grain is seen in section, the intine can be recognized as a thin, clear line surrounding the cell contents. The outer layer exine is thicker, more brittle, and often variously sculptured or provided with various modifications such as spines, outgrowths or reticulations. The exine is made of an extremely durable material called sporopollenin and is composed by four layers, as listed below:
Figure 26. Diagrams showing the structure of a pollen grain in optical section (Sawyer, Citation1981).
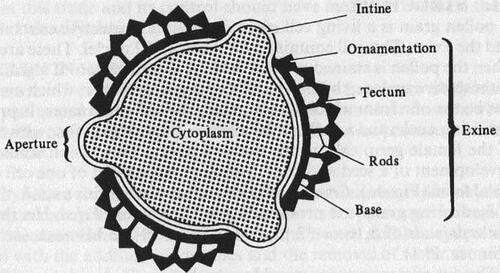
Figure 27. Diagrams showing details of pollen grain walls (Sawyer, Citation1981).
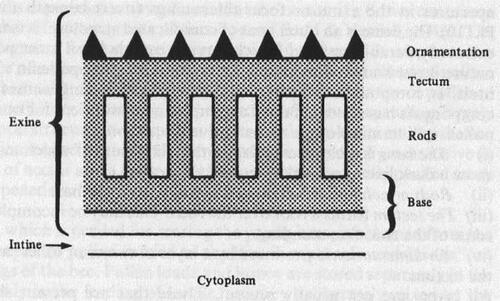
Base: This is a clear, uniform layer, the outer part of which can be stained to reveal a dark line in the optical section of the grain;
Rods or columns: These are arranged radially from the base;
Tectum: This layer forms a roof over the rods. It may be an incomplete layer, leaving some of the rods free-standing;
Ornamentation. This is provided by a layer of spines, outgrowths, reticulation, and other processes on the tectum.
Usually, all the layers are not present. Those which are present, show many modifications that are very useful in identifying a particular pollen grain.
Apertures are present on the surface of pollen grain. These are formed by the thinning or the absence of same of the layers of the exine. They are called furrows or colpi, if they are elongated and tapering toward the end or pores when they are round or oval (). The furrows run longitudinally with their ends toward the polar areas. The apertures are generally situated on the equator but pores are often found scattered over the whole grain surface. Pores and furrows often occur together, but at different levels of the exine. Apertures allow the grain to dry or to absorb water and thus to change into an expanded state. Also provide an easy outlet for the pollen tube when the grain germinates. Therefore, they are also called germ pores or germinal furrows.
Figure 28. Diagrams illustrating the morphological regions of a pollen grain and pollen grain apertures: (a) equatorial view; (b) polar view (Sawyer, Citation1981).
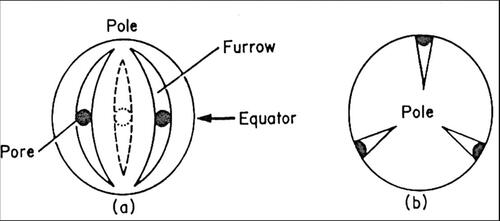
5.2. Floral origin
Considering the bee pollen loads, pollen may be classified as:
Unifloral, also named monofloral, when this product is derived from a single botanical source (Campos et al., Citation2008);
Bifloral when obtained from two species of bee plants;
Multifloral, also named heterofloral or plurifloral, when the pollen originates from several botanical species (Barth, Citation2004; Campos et al., Citation2008; Sharma, Citation1970; Stanley & Linskens, Citation1974).
5.3. Features of pollen grains
Each pollen grain has its own peculiar structural features (size, shape, apertures type, exine sculpture (exine ornamentation) and surface and other features), which helps us recognize its origin. Scientists-palynologists Sawyer (Citation1981) and Vorwohl (Citation1990) have different opinions of these features. Some of them will be show along the text.
5.3.1. Size
The size (diameter) of the pollen grain is expressed in microns or micrometers (µm), where 1 µm = 1 / I 000 mm. The maximum diameter of a pollen grain includes the spines or other ornamentation. Sawyer (Citation1981) used five size classes:
Very small (<20 µm);
Small (20–30 (µm);
Medium (30–50 µm);
Large (50–100 (µm);
Very Large (>100 µm).
However, not all pollen grains are round. Many are either elliptical or triangular, even elongated. Vorwohl (Citation1990) suggested that instead of defining size by the diameter, it should be defined by the length and breadth and defined nine classes of length and width ().
Table 28. Diagnostic pollen grain features used for identification (Vorwohl, Citation1990).
5.3.2. Shape
Shape is the outline; the optical section seen under the microscope and has been considered as an important feature in pollen identification (Sawyer, Citation1981). A pollen grain can be round, oval, elongated, triangular, semi-circular or boat-shaped, and irregular or multi-sided. The shape plays a very minor role in the identification of pollen grains, because it varies depending upon the position in which the grain lies and upon the viewing aspect (polar view or equator view). Many grains appear round in one particular aspect. If they also show special characteristic shapes, these have been given preference in the key. These alternative shapes should be used for identification. In addition to the definitely triangular or tri-lobed appearance of many grains, other 3-furrowed grains may show a shape intermediate between rounds and triangular. Both these classifications should then be considered.
5.3.3. Apertures
Pollen grains have apertures on the surfaces. The shape (type) and the numbers of apertures are important characteristics of a pollen grain and can be used in identification. Furrows containing pores are counted as one aperture. In compound pollen grains, the numbers refer to each single grain sub-unit. Nine classes of aperture number (as given in ) can be used in pollen identification. Regarding aperture type, Vorwohl (Citation1990) used the following five classes in pollen identification (). Whereas Sawyer (Citation1981) recognized only four classes of aperture types to be important in pollen identification as:
Pores only;
Furrows only;
United pores and furrows;
Irregularly occurring furrows.
5.3.4. Exine sculpture (exine ornamentation) and surface
The exine, the outermost coat of the pollen grain, is either smooth or various ornamented with different outgrowths or projections, such as granules, various kinds of spines, and reticulum or window-like structures. The ornamentation of the exine has a major effect on the surface of pollen grain as viewed under the microscope. The surface of pollen grains, as seen under the microscope, can sometimes change with a change in focus. For example, the pollen grain of Luffa cylindrica may appear granular under one focus and reticulate under another.
Nine classes of exine ornamentation can be identify: thin; medium, no rods; medium with spaced rods or beaded; medium or thick with coarse external rods; layer of closed thin rods; long thin spines; large broad-based spines; small or very small spines; or warts and other projections.
Five classes of surface as: smooth or indefinite; granular or warts; striated; net or pitted and Isolated dots due to spines or other projections. (exine ornamentation can also be divided into seven classes of exine sculpture – ):
Psilate, Faveolate and Fossulat: When exines are smooth, they are known as psilate, e.g., Betula spp and Pyrus spp. Exine sculpture with little pits is reported as faveolate and is known as fossulate with relatively larger pits. In viewing the surface, the pollen grains with psilate, faveolate, and fossulate exine sculpture appear smooth or sometimes indefinite;
Scabrate, Verrucate and Gemuate: Exines with little warts and diameters of not more than one pm are scabrate, e.g., some species of Quercus. In verrucates, the diameter of the warts is more than one pm, e.g., members of the Ranunculaceae family, some Asteraceae, and Nigella spp. Gennuate is an exine sculpture with round warts which are narrower at the base, for example, Ilex spp. In optical sections, this kind of exine appears to have small projections. Pollen grains with this kind of exine sculpture appear granular in viewing the surface;
Echinate: Exines provided with different kinds of spines, e.g., Malvaceae, Cucurbitaceae, Campanulaceae, and many Asteraceae are echinate. Pollen grains with echinate exine sculpture appear to have dots on the surface;
Clavate and Bacculate: Exines with rods which have thicker ends are clavate and those with stick-like rods are bacculate. Pollen grains with clavate or bacculate exine sculptures are very rare. On examining the surface, the pollen grains with this kind of exine sculpture appear granular (they have larger grains than scabrates, verrucates, and gennuates);
Rugulate and Striate: Exine sculptures with striations, e.g., species of Acer, Prunus, Datura, and Fragaria, belong to these categories. In optical section, the exines appear to have close, thin rods. On examining the surface, the pollen grains also appear striated;
Reticulate: This term is used when the exine sculpture is reticulate or net-like. This category is divided into fine reticulate, or beaded, or coarse reticulate. Examples are Lilium spp, Hedera helix, and Ligustrum spp. In optical sections, reticulate exines appear to have either thin or coarse rods, or they appear to be beaded. Pollen grains with reticulate exine sculpture appear reticulate on the surface also;
Fenestrate: Exines in which there are window-like holes between the ribs of the exine belong to this category. Important examples include Taraxacum officinale (Ap.: and members of Amaranthaceae). On the surface, the pollen grains appear to have window-like holes.
5.3.5. Other features
According to Vorwohl (Citation1990), aggregation of pollen grains is one of the important features in identifying pollen grains. Pollen grains of some plant species have other diagnostic features. For example, the pollen grains of many plant species in the family’s Ericaceae and Leguminosae (sub-family, Mimosoidae) are polyads, i.e., compound. In Ericaceae, four grains are aggregated to form a tetrad, e.g., Rhododendron spp., whereas in the Leguminosae, eight, twelve, or sixteen pollen grains are aggregated to form a polyad, e.g., Acacia spp, Albizia spp, Calliandra spp, and Mimosa spp. Also another important feature for pollen determining as: Air sacs; Thickened or projecting edges to apertures; A cap or streak on the apertures; Granules or projections scattered on the apertures; Intine swollen below the apertures; Intines thick or very thick and cell content’s granular has been reported by Sawyer (Citation1981).
5.3.6. Irregular grains
In the study of pollen found abnormal, not typical, grains. Sawyer (Citation1981) allocates such grains in the following groups:
Shriveled or abortive grains. Particularly in Rubus (blackberry), Trifolium repens (white clover) and many garden cultivars (e.g., Saxifraga and Oxalis) we find shriveled grains which do not expand when mounted. Such grains may even form the majority in a sample;
Giant and dwarf grains. Many pollen samples show the occasional giant grain; much larger than usual and often irregular. Others, for example Plantago (plantain) and Fagopyrum (buckwheat), produce a number of unusually small perfect grains among their pollen;
Aperture numbers. Variants with 4 furrows are occasionally found among 3-furrowed grains. This is particularly noticeable in some of the Rosaceae (e.g., blackberry and fruit blossom), Rumex (dock) and Hippophae (sea buckthorn). Regular variation of the number of pores is found in Carpinus (hornbeam) (3, 4 or 5); Alniis (alder) (4, 5 or 6) and Epilobium angustifolium (rosebay willowherb) (3 or 4);
Abnormal furrows. An interesting variation occurs in Veronica (speedwell) and occasionally in other Scrophulariaceae. This results in a square grain (PI. 188). Irregular and united furrows are common in Hypericum while the 'furrows' of Berberis (barberry), Crocus and Populus (poplar) appear as irregular breaks in the exine rather than true furrows (Crocus). The study of atypical pollen grains used for palinoindication of environment. (See also the paragraph regarding to Palinoindication of environment).
5.3.7. Pollen “types”
Although the pollen from each species of plant differs from that of all others, the differences are often slight and with the multitude of plant species and hybrids in the world, it will be appreciated that we cannot expect to identify each one by its pollen alone. Here they are group according to their “type.”
The pollen of some species is unique in its characters. Thus, Trifolium repens (white clover) and Trifolium pratense (red clover) may be distinguished from one another and from all others. But more often we find a “type” of pollen common to a genus or other group of plants. The pollen of all Tilia (lime) is unmistakable and although careful study may indicate the particular species, the classification “Tilia type” is usually sufficient in limiting.
5.4. Colors of pollen
The colors of bulk pollen, dry from the anthers or the pollen loads of bees, have been arranged in spectral order. They show considerable variation but may at times provide a valuable clue to identity (Hodges, Citation1952; Kirk, Citation1994; Partap, Citation1997; Sawyer, Citation1981). Hodges (Citation1952) and Kirk (Citation1994) consider that the first steps for identification of pollen loads are
sorting by color;
selecting one or two pollen loads from each color group;
pollen loads are put on white paper and lightly patted to make a uniform flat surface. This is necessary in order to find an exact match to a known color chart.
The nice color charts in Hodges (Citation1952) and Kirk (Citation1994) illustrate the different color pollen loads of different plants. The presents an example of the different colors of pollen loads. Important is the lighting, in which the identification is carried out. Pollen loads that are to be identified must therefore be matched to the color chart under these same standard conditions. If the chart is used in direct sunlight or under electric light, the result may well be different. According to Kirk (Citation1994), many plant species have pollen loads with very similar colors, so the particular species from which a pollen load has been collected can rarely be identified from just the pollen color. However, a combination of the color, flowering time and knowledge of local plants can usually narrow down the possibilities to one or a few species. However, this identification cannot be accurate. Therefore, for more exact identification microscopic examination pollen grains is necessary.
Figure 29. Photos to illustrate the variety of colors of pollen loads of different species of plants: (a) gray – Vicia faba; (b) lemon yellow – Brassica napus; (c) dark gray – Papaver rhoeas; (d) blue – Phacelia tanacetifolia; (e) mixed yellow pollen – mixed pollen from fruit trees (Prunus, Pyrus, Malus) and bright orange – Taraxacum officinale.
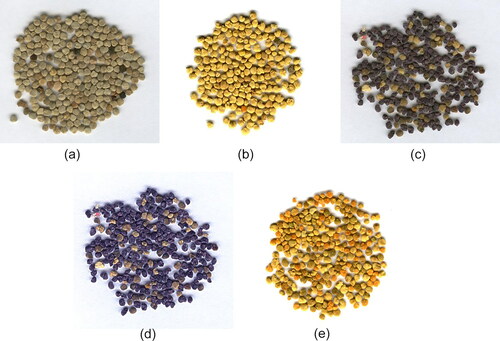
For instance, it has been proved that the color of pollen influences the color of honey; pollen and pollen loads from Taraxacum and Helianthus annus are bright orange – the color of pure honey with this plants – also is bright orange; pollen from Phacelia – blue, pure honey from Phacellia as a pale-blue color, pollen loads from Aesculus hippocastanum give a burgundy, honey with reddish color, etc. Most of the loads collected by honey bees consist only of pollen, but bees also collect propolis and occasionally fungal spores and various dusts (Hodges, Citation1952).
5.5. Methods of pollinic pollen analysis
5.5.1. Types of microscopy examination
The exact definition of the botanical origin of bee products, especially honey and bee pollen, requires the use of microscopic examination. The literature describes three methods of microscopic procedures.
5.5.1.1. Light microscope
Use a light microscope at a magnification of which is 100, 500, 1000 makes it possible to determine the external characteristics of the pollen grain: the shape, size, surface sculpture, and the presence of pores, fissures, etc.). And identify it up to the family, genus and species (Tripathi et al., Citation2003). But this method has its drawbacks: the internal structure of the grain is unattainable because of the opacity of the outer shell (exine) and pollen grains of some plants are too large and therefore it is impossible to get a clear image.
Preparation of pollen analysis for microscopic preparations. There are several techniques, which differ mainly in the medium fixing pollen grains turpentine, alcohol, honey solution or acetolized method (Dustman, Citation1992). Since the methods of preparation of pollen in microscopy greatly affect the appearance of pollen grains and noted the difference in the results of analysis, it is advisable to reference preparations of pollen grains and pollen description made in a relatively similar procedure.
5.5.1.2. Transmission electron microscope (TEM)
Microscopic examination of pollen using a transmission electron microscope, which allows the study the ultra-thin sections of pollen grains;
The image has pollen with unlimited depth transparency (X-ray allows us to study the internal structure of an object is significantly different than the other methods) (Kedves et al., Citation2002, Citation2003; Laere et al., 1969).
5.5.1.3. Scanning electron microscope (SEM) (three-dimensional image)
Accuracy to distinguish varieties even within the same species of plants. Especially for minor differences in the size and structure of the surface of pollen grains of different varieties of fruit crops (Brindza & Brovarskyi, Citation2014; Fogle, Citation1977; Klungness & Peng, Citation1983; Lindtner, Citation2014).
At the present stage of research melisopalinologiy widely practiced a combination of all methods of microscopy (Tripathi et al., Citation2003). For carrying pollen analysis must have reference preparations of pollen grains of the plants that could potentially occur in the samples of pollen, keys and atlases pollen. Help in defining various botanical origin keys pollen grains photographs, drawings. Modern pollen atlas published in 2004 by German melisopalinology. It contains pictures and descriptions of pollen about 170 species of plants and honey flora characterizes his country (Bucher et al., Citation2004). Several studies focused on computerized texture analysis of Scanning Electron Microscopy (SEM) images have been published (Langford et al., Citation1990; Li & Flenley, Citation1999).
5.6. Microscopic techniques
Identification of pollen is carried out in 3 stages.
5.6.1. Preparation of pollen grain slides from pollen loads for microscopic research
Method of preparation of pollen grain slides based on the method of mellisopalinology Louveaux et al. (Citation1978).
Take 1 mg of bee pollen loads with tweezers and transfer to a glass slide, add a drop of distilled water, which cement pollen grains will be separate each other. The amount of water is such that pollen grains freely melt away in a single layer on a slide.
Evaporate the water.
Apply one drop of warm (+40 °C), heat by thermal table glycerin-gelatin and cover with cover slip.
Preparation of glycerin jelly. Weight 10 g of gelatin and place them place for two hours in distilled water (gelatin absorbs 34.2 ml of water) and add 66.3 g of glycerin. This ratio of ingredients allows to save pollen grain shape unchanged. To prevent microbial growth in glycerol-gelatin add 0.5 g of carbonic acid (phenol) and to get a clear picture of the structures of pollen grains – 0.1 g Basic Fuchsine. 12 hours later for the prevention of further drying up of the slides aids its conservation – edge of the coverslip treat with decorative lacquer (nail polish).
5.6.2. Identification of pollen under microscope
Determination of botanical species of pollen can be done using the computer program identification of pollen LUCIA (Rodlauer & Hüttinger, Citation1992) (or similar). As an example, Digital camera Sony with light microscope Nicon transfer image of pollen on the computer screen. The operator determines the size, shape, number of pores, fissures and other parameters of the pollen grain – creates a digital key for determine (details in Introduction). Using this key, another computer program (electronic database of pollen) "Pollen Data Bank," provides a search and similar pollen grains select and begins clarification of affiliation pollen to a particular plant species. For comparison also use own standard slides and/or slides from other collections as, for example, the collection of the Austrian Institute of Beekeeping.
Determination of the botanical origin of pollen will be performed by comparing investigational pollen grains with descriptions and photographs of existing atlases and reference books, as for instance: Ambruster and Oenike (Citation1929), Burmistrov and Nikitina (Citation1990), Faegri et al. (Citation1993), Fossel and Pechhacker (Citation2001), Hodges (Citation1952), Maurizio and Louveaux (Citation1965), Sawyer (Citation1981) and Zander (1935).
Microscopic magnification of X 450 (Zea mays) and ×1000. For the magnification of ×1000 used oil immersion (cedar oil). A calibration line representing 10 µm should be add to each photograph.
5.6.3. Description of pollen grains
Description submitted by the following scheme:
Latin name of the plant;
The family of plant;
Plant life form (tree, shrub, herb; an annual or perennial plant);
Morphological characteristics of pollen grains:
size of the diameter and the equator;
number of furrows, pores;
surface and exine sculpture;
Color of bee pollen loads.
5.7. Palinoindication of environmental pollution
The knowledge of the morphology of pollen grains from different species (plants) allows simultaneous pollen analysis of bee products, also to carry out environmental monitoring, determine ecologically disadvantaged regions. It has been proved that the formation and development of pollen is very sensitive to external factors (radiation, volcanic activity, solar activity, heavy metal contamination, etc.) (Bogdanov et al., 2005). The result is a significant amount of pollen grains with modified morphological structures. Research shows that in harsh conditions, plants may produce large amounts of atypical imperfect, irregular and abnormal pollen grains - the worse the state of the environment, the greater the percentage of abnormal pollen and vice versa. (Bessonov, Citation1992; Dzyuba, Citation2006, Citation2007; Dzyuba & Tarasovich, Citation2001; Gilber & Lisk, Citation1978; Glazunov, Citation2001; Muszynska & Warakomska, Citation1999).
5.8. Concluding remarks
Research using light and scanning electron microscopy show the changes in size and shape of the pollen grains, the number, the shape and type of apertures, their size and location relative to each other. Main thing changes the most stable structure of pollen grains – sporoderm surface structure (shell), the number and thickness of the layers. Russian scientists have developed a method for determining the quality of the environment by the number of abnormal, atypical pollen grains (Dzyuba, Citation2006). In selected samples investigated at least 200 pollen grains, each of which is examined by the following parameters:
The form of the pollen grain;
The size of the pollen grain;
The number of apertures;
The nature of the location and type of apertures;
The thickness and number of layers sporoderm;
The nature and type of sculpture sporoderm;
Symmetry breaking pollen grain.
Thus, each sample was fixed in the presence/absence teratomorfic (pathologically developed) pollen grains, their quantity and analyzed morphological features. The illustrates the typical, normal pollen grains. Pollen grains have no deviations in the morphological parameters (size and shape of grains, number, shape and type of apertures, their size and location relative to each other, the sculpture's surface the number and thickness of layers). In the presents the photographs of pollen grains morphological features which correspond to norm. Photos made with the help a scanning electron microscope () and the shows some pollen grains (scanning electron microscope) with changed morphological structures. Particularly large number of abnormal pollen grains in Phacelia tanacetifolia (atypical shape and size) (). Pollen grains of Taraxacum officinale observed symmetry breaking () (Lokutova, Citation2014).
Figure 30. Typical (normal) pollen grains (scanning electron microscopy): (a) Aesculus hippocastanum; and (b) Vicia faba.
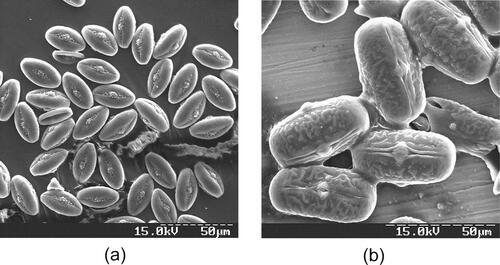
Figure 31. Pollen grains with changed morphological structures (scanning electron microscopy): (a) Phacelia tanacetifolia; (b) Taraxacum officinale; and (c) Scilla bifolia.
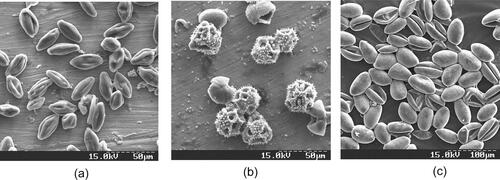
Figure 32. Separation of bee pollen by color pellets from a sample that include different floral origin pollens.
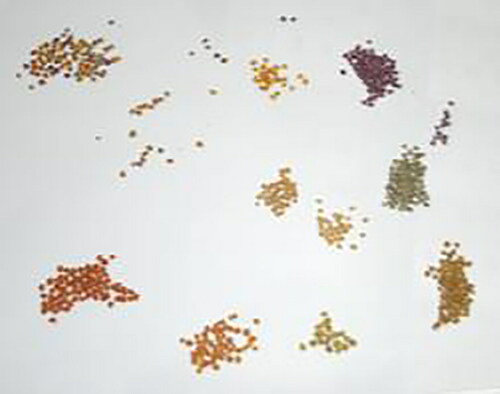
Therefore, numerous experiments have shown that during pollen analysis of bee products to determine their botanical and geographical origin there is a possibility at the same time estimate the state of the environment. According the quantitative content abnormal pollen grains can draw conclusions about environmental situation in the region, where these bee products were received.
6. Phenolic and polyphenolic profiles as fingerprints of floral origin of bee pollen
Rapid and easier method developed by Campos et al. (Citation1997) use High Pressure Liquid Chromatography/ Diode Array Detector (HPLC/DAD) profiles, of phenolic and polyphenolic compounds, made with hydroalcoholic extracts of pollen and bee pollen loads. It is easy to do, reliable, highly effective, and requires minimum sample preparation, as indicated by the several reports, from worldwide, in which the method has been used to analyze the phenolic composition of pollen. This method allows the identification of the genus and the species (sp.) and provides valuable information related to chemical structure of the constituents under analysis. The phenolic acids and polyphenolics in pollen are expressed as specie-specific, which represents an important tool for taxonomy studies. It should be do a screening of different color pellets from a mixture of bee pollen and the identification of the potential floral source using a data base build with floral hand collect pollen or herbarium specimens. The first approach to the flavonoid structures can be based on Campos and Markham theory (2007).
6.1. Materials and methods
6.1.1. Sample management
Sample management is an important issue for the analysis. It is essential to specify details about where and when specific pollen samples are collected, sample storage, handling, and preparation, as details of any of these aspects might affect the phenolic composition of pollen. More details found in Section 2 of this chapter.
6.1.2. Sample collection
6.1.2.1. Pollen hand collected – reference samples
Reference samples should be collected from the specimens at the Herbariums if they show a very good preservation or they can be hand collected from the stamens of flowers at the field and bring to the laboratory. The correct taxonomic identification should be assured. The HPLC/DAD fingerprints of the phenolic and polyphenolic compounds of these well-known samples will be used as a data base for match of the unknown samples of bee pollen. For that, it is important to:
record location of harvesting;
record date of sampling;
collect the respective voucher specimen, which must to be deposited at herbarium to be identified or authenticated.
6.1.2.2. Bee pollen pellets/loads
Samples collected directly from bee pollen traps or purchased from beekeepers during the collection period. Information about the apiary locations and harvesting data is always welcome, as well the processing of drying, if it was applied.
6.1.3. Methods
6.1.3.1. HPLC/DAD analyses
6.1.3.1.1. Sample preparation (hand collected pollen and/or pollen from herbarium)
Weight ten milligrams of dried pollen of each sample. If the sample is from herbarium lower amounts can be used but the proportion 10 mg to 1000 µl should be maintained.
Note: Using always the same concentration among samples makes easy to compare the approximate amount of phenolic and polyphenolic compounds in the fingerprints, without the need of quantification. If need, a rigorous determination of the total amounts of each compound can be done, using a calibration with standard solutions.
Add an ethanol (EtOH)-water solution (1 ml, 50% V/V).
Sonicate for 60 min.
Centrifuge the resultant extract at 5000 rpm for10 min.
Take out the supernatants and do a microfiltration with a 0.45 µm membrane for HPLC/DAD analysis as previously described (Campos et al., Citation1996).
6.1.3.1.2. Sample preparation (bee pollen)
Usually bee pollen samples are made up of different color loads/pellets and set up a “multifloral bee pollen.” However, “monofloral” samples are also found in the market and/or produced with this purpose according to Campos et al. (Citation2008).
Separate pollen loads by colors ().
Note: commonly each color corresponds to a botanical origin and, for each one, it will be carried out a HPLC/DAD profile (fingerprint of the taxon). This fingerprint will be compared to others in the data base to obtain the match with a similar one.
2. Weight one pellet, keeping the same ratio for extraction (10 mg/ml EtOH 50%), for instance, if the weight is 6.78 mg the solvent will be 0.678 ml of EtOH 50% (V/V).
3. Proceed the same way for mixtures of bee pollen. The extraction should keep the same ratio. If necessary, du an aliquot that represents the entire weight of the sample under analysis, for example, 10 g/l EtOH 50% (V/V). The portion of the mixture to be weighed is removed after sample homogenization.
4. Proceed as explained in points 3–5 in sSection 6.1.3.1.1.
Note: In addiction a standard of quercetin-3,5,7,3′,4′-O-pentamethyleted can be add to samples for HPLC/DAD injection, as an internal standard (Campos & Markham, Citation2007).
6.1.3.1.3. HPLC/DAD analysis
For the HPLC/DAD pollen analysis several steps must be performed rigorously to have a correct identification of the compounds in the different samples with different origins:
HPLC/DAD system with a RP18 column;
Eluent formed by acidified water with ortho-phosphoric acid to pH 2.4 (solvent A) and acetonitrile HPLC grade (solvent B), combined in a linear gradient according to the following: starting with 100% A, decreasing to 91% over the next 12 min, to 87% over the next 8 min, to 67% over the next 12 min, to 57% over the next 10 min, and holding that last proportion until the end of analysis (a total of 60 min).
Note: This gradient was optimized to avoid sample purification, which decrease time of preparation, sample manipulation and possible loose or degradation of compounds to be used on the fingerprints for each taxon. Among phenolic and polyphenolic compounds many other polar constituents will be extracted with the hydroalcoholic solvent used; however, the contamination does not interfere with the HPLC analyze because at the beginning a water gradient is used and the compounds that will be separated stay in the top (head) of the reverse phase column choose, allowing the more polar, i.e., amino acids, proteins, sugars, hydrosoluble vitamins and minerals to elute in the first minutes without interfering in the fingerprint. Phenolic and polyphenolic compounds only start to be eluted 15 min later with the increase of acetonitrile in the gradient;
3. Flow rate 0.8 ml/min;
4. Temperature stated at 24 °C;
5. Injection of the samples extracts (20 to 100 µl, depending on phenolic concentration);
6. Standard chromatograms plotted at wavelengths 260 and 340 nm (the choice of these two wavelengths consist in the knowledge that flavonols and flavones glycosides, the main compounds in pollens, have two characteristic bands of ultraviolet – absorption around these values; phenolic acids and its derivatives can also be identified using the same range);
7. Spectral data for all peaks is accumulated in the range 220–400 nm (the phenolic/flavonoid spectra are all in this display) using DAD;
8. Apparatus: HPLC system, Diode Array Detector with respective software;
9. The phenolic/polyphenolic profile of each sample is made up with all compounds resolved in its respective chromatogram;
10. The structural information for each compound is made by direct comparison of retention time and ultraviolet absorption spectra with standards, and according to the theoretical rules developed and compiled by Campos and Markham (Citation2007).
Note: the compounds can also be isolate and the structures determined by Nuclear Magnetic Resonance (NMR) and/or LC-MSMS (Campos et al., Citation1996, Citation1997). Briefly: The extracts are applying in sheets Whatman 3 MM chromatography paper for 1D separation. Each compound is prepared for further studies by chromatography on a C-18 reversed phase column using water: acetonitrile gradient and checked for purity by HPLC/DAD, according to Markham and Campos (Citation1996). For the full structure elucidation by NMR spectra can be carry out in Bruker AC apparatus at 300 MHz (or similar) with the isolated compounds, solved in DMSO-d6, with TMS as intern standard at 30 °C (Markham & Geiger, Citation1993).
6.2. Theoretical rules for structural determination of the main phenolic acids and flavonoids
The identification of the compounds is carried out by direct comparison of retention time and ultraviolet absorption spectra (Campos & Markham, Citation2007). In flavonoid structures are shown to a better understanding of the explanation of the UV spectra related to the position of the substitution in the molecule. The majority of the flavonoids in pollen are derivatives of flavones and/flavonols. The majority of the flavones found in pollens are apigenin or luteolin derivatives, and the compounds with a flavonol nucleus, are mainly kaempferol, quercetin or isorhamnetin. In the most samples these compounds appear as glycoside derivatives. Examples of different flavonol and flavone structures and its respective UV-spectra are show in . Isoflavones, as daidzein, glycitein and genistein derivatives can also be found in certain pollens but are not so common.
Figure 33. Basic flavonoid structure in order to show a better understanding of the explanation of the UV spectra related to the position of the substitution in the molecule (From Campos & Markham, Citation2007. Reproduced with permission).
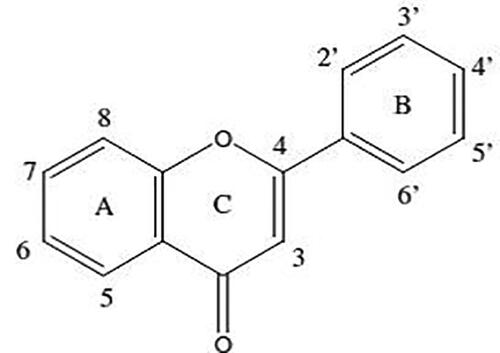
Figure 34. Examples of the more common UV- spectra found in bee pollens: (a) apigenin; (b) apigenin-7-O-derivative; (c) luteolin; (d) kaempferol-3-O-derivative; (e) quercitin-3-O-derivative; (f) isorhamnetin-3-O-derivative; (g) chalcone.
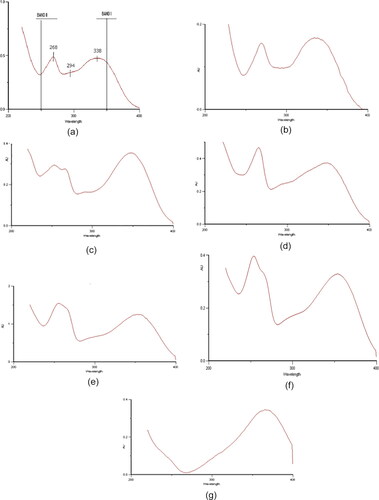
Figure 35. Fingerprint of Eucalyptus globulus obtained with a pollen pellet (100% pure) and a mixture of bee pollen with about 60% of Eucalyptus globulus pollen pellets.
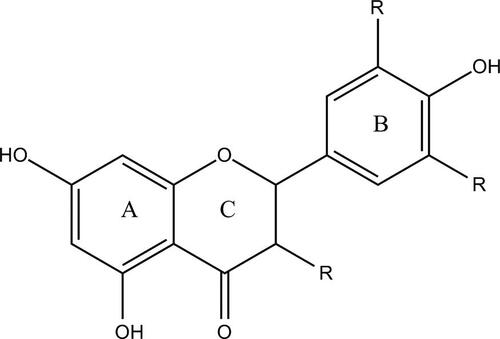
Examples, of rules developed in Campos and Markham (Citation2007) for identification of details in the UV-spectra:
In all of them can be observed a clear existence of two intense bands of absorption which indicate the presence of the rings A, B and C from flavonoids. In are pointed the three important absorption points:
Band I, usually with absorption around 340–390 nm. Flavones 340–350 nm; Flavonols-3-O-derivatized () (as glycosides, for instance) 350–360 nm; Flavonols with the C-3-O-H free 370–390 nm;
Band II, usually with absorption around 240–280 nm;
shoulder between 280 and 310 nm – substitution in C7;
The absence of the shoulder between 280 and 310 nm is indicative of a substitution in C7-OH. Example, flavones as Apigenin () and apigenin-7-O-derivative (). This –OH is free in Apigenin itself with no substitution, and the shoulder remain in the UV-spectra.
Example, flavonols as Kaempferol-3-O-derivatives () and Kaempferol-3,7-O-di-derivatives (substitution in C7-OH) (). The same absence of the shoulder at 280–310 nm can also be seen for Quercetin-3,7-O-di-derivative (). When the C7-OH is free the shoulder is present at 280–310 nm (a flat region in this part of the spectrum), examples of luteolin, Kaempferol-3-O-derivative and Quercetin-3-O-derivative (, respectively – all have the C7-OH free);
2. Differences between isorhamnetin and quercetin: Comparing isorhamnetin-3-O-and quercetin-3-O-derivative, the difference in the structure is in B-ring with a methyl group in C3’ hydroxyl in the first. This implies an intensification of Band IIb and IIa (wavelengths of UV absorption for both around 255 and 265shoulder nm). Quercetin show a smoother absorption among these two bands;
3. To distinguish both structures, flavones or flavonol 3-O-substituted the relative intensity of absorption among Band I and Band II should be analyzed. If Band I is higher than Band II, usually are flavones but in the inverse case, Band I lower then Band II is a high probability to be a flavonol-3-O-substituted (glycosylated in the majority of the times) (examples in );
Note: More details for UV interpretation of the spectra in Campos and Markham (Citation2007).
4. In and , the wavelengths related to the oxygenation pattern, for the more common flavones and flavonols can be consulted and there, a prevision of the bathochromic effect (relating to a shift to a longer wavelength in the absorption spectrum of a compound) in band I with the increase of the oxygenation pattern on B-ring in these structures. However, when these changes occur, usually the UV-absorption of Band II remain the same ().
Table 29. Amplitude of the Wavelengths in Band I of flavones and flavonols UV spectra.
Table 30. Wavelengths of Band I in UV spectra of flavonols with a different pattern of oxygenation in B-ring.
Table 31. Wavelengths of Band II in UV spectra of flavones with oxygenation only in A-ring.
Table 32. Model of chemical structures of subclasses or representative molecule of subclasses of non-flavonoids phenolic compounds.
Table 33. Model of chemical structures of flavonoids.
6.3. Quantification of the major floral specie (floral source) in a mixture
With this method it is also possible the identification of the major taxon source in mixtures of various floral species (different color loads/pellets in general corresponding to various floral sources), if one of them is in a high percentage.
Analyze the phenolic HPLC/DAD profiles (fingerprints) for the different taxon found in the mixture.
In each taxon select the compound that can be used as a marker for this specie. The compound used as marker should not be found in the other floral species in the full mixture. Note: This approach is supported by microscopic analysis. The flavonoid/phenolic HPLC/DAD fingerprint of the full mixture should be the same as the profile corresponding to the major floral specie, i.e., if the major floral source in the bee pollen sample (batch) is Salix atrocinerea, the fingerprint match with the one obtained with same floral source in the data base made up with the hand/herbarium pollen sample.
To achieve the percentage of this major monofloral identification in a bee pollen mixture:
Run HPL/DAD profile of the mixture and compare to the data base to verify if it is the same as one of them;
Once the floral specie is identified choose one of the major compounds as a marker and its quantification will correspond to 100%. Note: analyze the fingerprints obtained with the various pellets (other floral origins) in the mixture and choose a compound that does not belong to them;
Quantify the same compound in the mix. The amount determined will be a % of the marker and corresponds to the percentage of the major specie in the entire batch. In an example involving a mixture of bee pollen with about 60% of Eucalyptus globulus is shown. In this case, quercetin-3-O-sophoroside (di-glycoside) was chosen for quantification and the calibration curve was made with rutin, which is a similar di-glycoside of quercetin as the one used as marker for this taxon.
Figure 36. General formula of flavonoids.
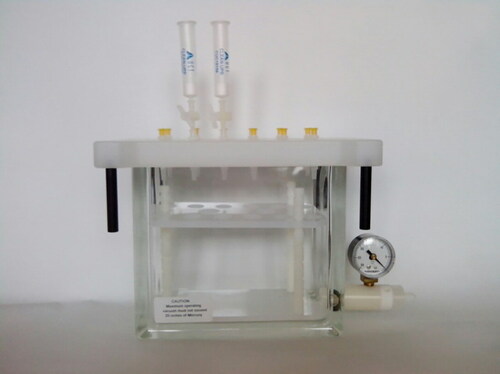
Note: The majority of the flavonoids in pollen are kaempferol, quercetin, isorhamnetin, apigenin or luteolin derivatives, mainly glycosides. However, many different structures can be found and is not difficult found a good marker for each taxon. A combination of two or more markers can also be used if necessary.
7. Determination of phenolic profile of bee pollen extracts by LC and LC/MS
Polyphenols are known to interact with compounds present in foods, like carbohydrates, proteins or lipids (Jakobek, Citation2015; Ozdal et al. Citation2013). Comprehensive analytical methods such as LC and LC/MS can be used to obtain more detailed information on phenolic profile of bee pollen as well as on interactions in food systems. Standard procedures for the extraction of phenolic compounds from bee pollen, pre-concentration of phenolic extracts prior to analysis, LC and LC/MS techniques for their determination will be described.
7.1. Polyphenolics: importance, structure and classification
The phenolic compounds in pollen grains are important as a part of reproductive process in plants. They protect pollen load from destructive exterior factors such as UV-radiation (LeBlanc et al., Citation2009). During the germination of pollen load, the formation of two protective membranes – exine and intine is occurred. Both membranes are rich in content of phenolics. Campos et al. (Citation1997) have shown that it is possible to establish the correlation between the polyphenols and palynological origin of bee-collected pollen.
There are thousands phenolic structures of substances present in plants (Boudet, Citation2007). It can be the simple molecular structure with one substituted benzenoic ring or complex polyphenolic structure with two or more interconnected aromatic rings. Natural phenolic compounds can be classified according to their structure in two major classes:
non-flavonoids polyphenols (Lignans and lignins, phenolic acids, coumarins, stilbene oligomers, gallotannins, ellagitannins and procyanidins (Soto-Vaca et al., Citation2012)) ();
flavonoids (large group of molecules with complex structure derived from p-coummaric acid. Basically, it consists of two aromatic rings with different alkyl and (or) O-substituents and with multiple chiral centers (Yáñez et al., Citation2013). Benzene rings A and B are connected with C3 chain which are often closed and form heterocyclic ring C ().
There are a significant number of subclasses of flavonoids based on different reactions that occur on the rings over the lateral groups – hydroxylation, prenylation, alkalinisation and glycosylation (Stalikas, Citation2007): chalcones (without formed C ring), aurones, flavanols (includes catechins, epicatechins and procyanidins), flavonols, flavones flavanones, isoflavones and antocyanins. The general structures of these subclasses of flavonoids are presented in . Presence of sugar unit (in form of glycoside) and OH-groups increase water solubility of these molecules, meanwhile the presence of alkyl groups make them lipophilic. The most abundant form of flavonoids is the glycosidic form with different sugars linked (glucose, ramnose, etc.). If there is no bonded sugar unit, flavonoids are in aglycone form.
Table 34. Some publications on LC and LC/MS analysis of polyphenolic compounds from bee pollen samples.
7.2. Preparation of pollen extracts for determination of phenolic compounds
Bee pollen can be considered as a complex mixture of different compounds which differ, both, in chemical composition as well as in their solubility. The complexity of the structure of the pollen grains are also reflected in the fact that it is protected by two membranes with the main outer, exine, that consists of polymer sporopollenin. For this reason, isolation and extraction of material from pollen requires prior softening or maceration of pollen grain so that membranes slightly relaxed or their physical disruption (by using ultrasound or sonification) in order to increase the extraction efficiency. Application of ultrasound (which increases penetration of solvent’s molecules into the pollen matrix thereby enhance contact of solvent and the respective soluble components therein) is especially recommended due to the presence of thermolabile components in plant materials (Wang & Weller, Citation2006), including pollen. Generally, during the entire extraction process application of higher temperature should be avoided in order to preserve the original composition of the compounds present in the pollen because some of them are volatile at elevated temperatures (lipids, phenolic compounds, etc.) or they can lose their native structure (free amino acids, proteins, polysaccharides). All phenolic compounds present in plants can be regarded as more or less water soluble (flavonoids, most of the phenolic acids, gallotannins and ellagitannins) and water insoluble (coumarine, stilbenes, proantocyanidins, some phenolic acids bonding in the cell wall, lignins). Solubility/Insolubility in water and similar solvents depends primary on the presence of side groups attached to the aromatic rings.
7.2.1. Extraction of phenolic compounds from pollen – general procedure
Based on the aforementioned the following procedure for the extraction of phenolic compounds from pollen can be proposed:
Measure the appropriate mass of pollen sample (e.g., 0.5 g);
Add 20 cm3 (calculated for 0.5 g of pollen) of heptane in order to remove lipid components;
Shake thoroughly sample on Vortex and place it in an ultrasound bath for 15 min at 30 °C;
Centrifuge sample (5000 rpm) to separate non-polar, lipid fraction;
Add 20 cm3 (calculated for 0.5 g of pollen) of 50% ethanol on the residual undissolved portion of pollen and place it in an ultrasound bath for 15 min at 30 °C;
Centrifuge sample (5000 rpm) in order to separate liquid and solid phases;
Evaporate ethanol from supernatant by vacuum-rotary evaporator at temperature of 35 °C;
Add ethyl acetate to the remaining aqueous solution (volumes of solution and extraction solvent should be equal) in order to perform the extraction of the phenolic compounds and their separation from the remaining organic substances (proteins and sugars);
A phenolic fraction, obtained in this way, is prepared for further concentration using the solid-phase extraction (SPE) method.
7.2.2. Preparation of enzymatic hydrolysates from pollen
Besides the common extracts for determination of phenolic profile of pollen, some authors (Rzepecka-Stojko, Pilawa et al., Citation2012; Rzepecka-Stojko, Stec et al., Citation2012) have prepared two types of enzymatic hydrolysates from pollen: pepsin hydrolysates from pollen (PEP) and ethanol extracts of pepsin-digested bee pollen (EEPP). On the other hand, Smirnova et al. (Citation2012) prepared enzymatic hydrolysate of pollen’s exine by using feruloyl esterase.
7.2.2.1. Preparation of PEP
Measure 20 g of pollen samples.
Add distilled water (volume of distilled water should be five times the volume of sample) and acidify with conc. HCl until reach pH 2.
Add pepsin to obtain its concentration of 1%.
Incubate sample at 37 °C for 48 h to perform hydrolysis.
Boil sample for 10 min to stop enzymatic activity.
Filter the obtained enzymatic hydrolysate under reduced pressure.
Centrifuge the filtrate for 10 min at 10,000 rpm.
Evaporate the supernatant at rotary vacuum-evaporator to yield dry extract.
Complete drying in a laboratory incubator (desiccator) at 38 °C.
Measure the dry extract and dissolve it in distilled water to prepare PEP-solution with concentration of 2 mg/cm3.
7.2.2.2. Preparation of EEPP
Extract the supernatant obtained after pepsin-treatment of pollen with 200 cm3 of 50% ethanol for 60 min at room temperature with intensive shaking.
Filter the extract under reduced pressure.
Centrifuge the filtrate for 10 min at 10,000 rpm.
Evaporate the supernatant at rotary vacuum-evaporator to yield dry extract.
Complete drying in a laboratory incubator (desiccator) at 38 °C.
Measure the dry extract and dissolve in 50% ethanol solution to prepare EEPP-solution with concentration of 2 mg/cm3.
7.2.2.3. Preparation of feruloyl esterase hydrolysate from pollen’s exine
For the preparation of this type of hydrolysate, Smirnova et al. (Citation2012) used enzyme feruloyl esterase derived from the mold of genus Aspergillus sp. according to the following procedure:
Incubate the exine of pollen in acetate buffer solution pH 4.5 containing enzyme feruloyl esterase in quantity of 5 g/dm3 for 24 h at 50 °C;
Thoroughly wash the digested material with distilled water;
Incubate in 1% sodium-dodecylsulfate (SDS) solution;
Wash again with distilled water;
Dry at 55 °C until constant mass has been reached.
7.2.3. Application of SPE for pre-concentration of phenolic compounds for further LC and LC/MS determination
Solid-phase extraction () is one of the methods of sample preparation for the further analysis. It was developed during the 1980s. Currently, SPE is applied for pre-concentration of samples or for their isolation and purification (Bertoncelj et al., Citation2011; Gašić et al., Citation2014a; Citation2014b; Kečkeš et al., Citation2013; Santana et al., Citation2009). It is based on interaction of some components from liquid phase with solid (sorbent) phase. The desired compound retains on column, meanwhile, all the unwanted components have been washed and removed with rinsing of column in convenient medium. The analyte is than recovered with small quantity of appropriate solvent. In this way, apart from the isolation of the substance, its pre-concentration is achieved which facilitate further analysis. Also, the use of large amounts of organic solvents for extraction can be avoided (Rouessac & Rouessac, Citation2007). This is important due to three reasons – medical, environmental and economic.
Figure 37. Solid phase extraction.
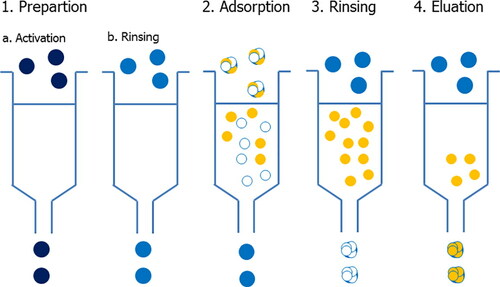
Typical solid phase extraction involves several steps (Rouessac & Rouessac, Citation2007) ():
activation and rinsing of the sorbent before using it – performed by passing a certain volume of solvent similar polarity as well as samples that will be loaded to the cartridge;
adsorption of the analyte by loading of known volume of sample;
elimination of all interfering compounds by rinsing cartridge with adequate solvent;
desorption of an analyte by percolation of cartridge.
The solid phase in cartridge is made of similar materials like solid phase in LC-columns depending of type of analyte. A number of sorbents may be used such as silica gel, cellulose, aluminum oxide, polyamide and bonded silica gels (Milojković-Opsenica et al., 2015). Polar compounds are isolated from cartridge with non-polar matrix. If the analyzed sample contains non-polar components, they can be isolated from cartridge with polar matrix made of C-18 derivatized silica gel. This gel has attached a hydrocarbonic C18-chain which increases its hydrophobicity. They were the first type of sorbents applied for SPE pre-concentration of phenolic compounds from water samples (Mußmann et al., Citation1994; Rodríguez et al., Citation2000; Tian et al., Citation2005). Interactions between phenolic compounds and this type of sorbent, based on Van der Waal’s forces, can be weak if phenols are in ionized states, so it is necessary to adjust the pH at the proper value. Also, since silica materials are sensitive on pH value, it is possible to substitute this type of sorbent with some other, more polar matrices such as modified polystyrene-divinylbenzene polymeric (XAD) resins (Fontanals et al., Citation2007; Li et al., Citation2002; Wissiak & Rosenberg, 2002). The procedure is similar to those applied for C-18 derivatized silica gel but adsorption area is larger and presence of some aromatic parts in polymeric structure made it more suitable for phenols extraction (Santana et al., Citation2009).
A typical cartridge SPE manifold can accommodate up to 24 cartridges. Most SPE manifolds are equipped with exit for connection to vacuum or water pump. Application of reduced pressure speeds up the extraction process by pulling the liquid sample through the stationary phase. The analytes are collected in sample tubes inside or below the manifold after they pass through the stationary phase. Before the loading on the cartridge samples are usually passed through a disk for extraction −0.5 mm thickness and 25 to 90 mm in diameter (Rouessac & Rouessac, Citation2007). It serves to remove the low quantity of organic substances which are possibly present in the tested aqueous solution.
7.2.3.1. Application of SPE for pre-concentration of phenolic compounds from pollen
The literature for pre-concentration of phenolic compounds from pollen by SPE is very limited (Di Paola-Naranjo et al., Citation2004). According to our laboratory practice and experience the following procedure for pre-concentration of phenolic compounds from pollen phenolic fraction prepared by general procedure can be proposed:
Condition and activate the SPE cartridge by passing 10 cm3 of methanol and 10 cm3 of 0.5% hydrochloric acid, successively. Do not allow air to enter the cartridge packing;
Load 2 cm3 of pollen phenolic fraction by passing slowly (no faster than one drop per second) into the cartridge. Do not allow air to enter in to the resin bed. Collect all cartridge effluent in clean tubes;
Wash the cartridge by passing 10 cm3 of 0.5% HCl (for purpose of elimination of potentially present sugars or some other polar substances). Collect all cartridge effluent in clean tubes;
Eluate the phenolic compounds by slowly passing (less than one drop per sec) of 5 cm3 of acidic solution of methanol (add 0.5% HCl). Do not allow air to enter into the resin bed. Collect phenolic solution in clean tubes;
Tap tubes and pack it into the refrigerator or freezer until further analysis.
7.3. LC and LC/MS techniques
7.3.1. LC techniques
High-performance liquid chromatography or high-pressure liquid chromatography (HPLC) is highly improved form of column chromatography. It is based on the principle of forcing solvent through column, packed with stationary phase consisting of small particles, under high pressures (up to 400 atmospheres). Nano-liquid chromatography method with UV-Vis detection is also developed for analysis of phenolic compounds in bee pollen (Fanali et al., Citation2013). The main advantages of this method are short analysis time and reduced costs due to the small dimensions of the column.
7.3.1.1. LC-DAD technique
The photodiode array detector has been extensively used for the detection of polyphenolics due to their absorption in the UV region (Robards & Antolovich, Citation1997). Detection is based on the absorptive measurement at characteristic wavelengths. Phenolic acids are usually detected at wavelengths between 210 and 320 nm, anthocyanidins and anthocyanins (glycosides or acylglycosides of anthocyanidins) between 500 and 530 nm, flavanols between 210 or 280 nm, flavanones at 280 nm, and possibly at 252, 285, 290 and 365 nm, flavones at 360 or 370 nm, flavonols and their glycosides at 270, 365, and 370 nm and isoflavones at 260 nm, and possibly between 230 and 280 nm. UV spectra of flavonoids, for example, have two absorption bands. Band I, with maximum absorption in the range of 300 to 550 nm, arises from the A aromatic ring and band II, with maximum absorption in the range of 240 to 285 nm, comes from the B ring. In LC-DAD system, polyphenolic standards are used to generate characteristic UV-Vis spectra and retention times. Identification of individual polyphenolic compounds is achieved by comparison with retention times and UV-Vis spectra of standards. Quantification of these compounds is performed from the peak areas by comparison to calibration curves obtained with standard solutions. As general procedure for determination of polyphenolic compounds from bee pollen extracts can be HPLC-DAD method developed by Campos et al. (Citation1997).
7.3.1.2. LC-MS, MS/MS techniques
Although HPLC-DAD method is the reference method for the analysis of phenolic compounds, certain problems, like co-elution and similar UV-Vis spectra of many compounds, can occur. As well, most glycosides and acyl residues are poor chromophores, so no further distinguishing can be achieved by means of DAD UV detection. In that case mass spectrometry (MS), more precisely, tandem mass spectrometry (MS/MS) detection is suggested for further characterization and identification of eluted compounds.
The MS principle consists in ionizing chemical compounds to generate charged molecules or molecule fragments and measuring their mass-to-charge ratios (Sparkman, Citation2000). LC-MS provides structural information about eluted compounds but is rarely used for full structure characterization. Using LC-MS/MS more fragmentation of the precursor and product ions is formed, providing additional structural information for the identification of phenolic compounds like details about the aglycone moiety, the types of carbohydrates (mono-, di-, tri- or tetrasaccharides and hexoses, deoxyhexoses or pentoses) or other substituents present, interglycosidic linkages, attachment points of the substituents to the aglycone, etc. Aforementioned useful structural information could be obtained directly and easily applying electrospray ionization (ESI) and atmospheric pressure chemical ionization (APCI) techniques, and so, many purification procedures can be circumvented. Both are the soft ionization techniques and the most widely used in analysis of polyphenolic compounds in bee pollen and other food. ESI is gentler method and is generally used for polar compounds that can be ionized in solution, while APCI is used for less polar molecules that can undergo acid-based reactions in the gas phase (Biesaga & Pyrzynska, Citation2009). Both positive and negative ionization are applied. Negative ion mode provides the highest sensitivity in flavonoid analysis and fragmentation is limited (Cuyckens & Claeys, Citation2002; de Rijke et al., Citation2003; Fabre et al., Citation2001; Wang et al., Citation2007), while mass spectrum in the positive ion mode shows different fragmentation pattern. Analyte responses can vary considerably so combined use of both EI and PI modes can prove complementary information’s which are helpful in the structure determination, especially for the minor compounds (Cuyckens & Claeys, Citation2004; de Rijke et al., Citation2006). The eluent system also has a distinct influence on the ionization efficiency and therefore on structural information. The most common additives are formic acid, trifluoroacetic acid, ammonium acetate and ammonium formate. They are volatile and thus compatible with LC-MS. Combination of methanol-ammonium formate at pH 4 gives the highest response in negative mode APCI (de Rijke et al., Citation2003), while the best sensitivity in ESI is achieved with acidic ammonium acetate buffer and organic component consisted of methanol and acetonitrile as mobile phase (Rauha et al., Citation2001). Formic acid has slight negative effects on the ionization efficiency but improves chromatographic separation and peak shapes (Prokudina et al., Citation2012). For trifluoroacetic acid is reported that suppresses the ionization due to ion-pairing and surface-tension effects (Costa et al., Citation2000).
Chromatographic retention times provide useful structural information. In reversed-phase HPLC separation of polyphenolics on the basis of their polarity, the elution order of polyphenolics may be predicted Glycosylation increases polarity of flavonoids and therefore their mobility in the reversed-phase system. Acylation and methylation have the opposite effect but their position have significant influence on the retention time (Greenham et al., Citation1995; Harborne & Boardley, Citation1984). In case of flavonoid glycosides rutinosides precede neohesperidosides, galactosides precede glucosides (Robards & Antolovich, Citation1997), glucosides precede arabinosides and arabinosides precede rhamnosides (Harborne & Boardley, Citation1984; Schieber et al., Citation2002). Linkage position can have an influence on the retention, too. The elution order for different classes of flavonoids is flavanones, flavonols and flavones, for compounds with equivalent substitution pattern. The elution order for hydroxycinnamic acids is caffeic acid, p-coumaric acid, sinapic acid, ferulic acid and cinnamic acid while for benzoic acids order is gallic acid, protocatechuic acid, vanillic acid and syringic acid (Rodríguez-Delgado et al., Citation2001).
Quality and reliability of analysis depend on the combination of the mass analyzer with the detector. Analyzers can belong to magnetic sector, time-of-flight (TOF) or Fourier transform (FT) generic type, depending on the physics of mass analysis. There are analyzers that can perform MS and MS/MS (MS2) analysis, sometimes to a high MSn stage or different analyzers could be combined together into one hybrid instrument. Mass analyzers used for analyzing polyphenolic compounds are usually quadrupole and ion-trap instruments. Ion-trap instruments can perform MSn experiments and that is its main advantage (de Rijke et al., Citation2003). Using ion-trap mass spectrometry Ferreres et al. (Citation2010) reported the presence of non-colored flavonoids in bee pollen from Echium plantagineum and Lv et al. (Citation2015) identified and quantified flavonoid aglycones in rape bee pollen collected from Qinghai-Tibetan Plateau. In order to optimize signals and to obtain maximal structural information from ion of interest, the different collision energy values should be applied. Methods based on low-energy collision induced dissociation permit the characterization of most structural features of flavonoid glycosides. High-energy CID methods provide additional structural information through more fragmentation processes. Collision energy directly affects abundance ratio of the various fragment ions. Optimum CE varies for different compounds. Gu et al. (Citation2012) showed that a CE of 70 eV is sufficient to cause abundant product ions for structural elucidation of flavonoids and 30 eV for generation characteristic fragment ions for chlorogenic acid (Gu et al., Citation2012). Recent publications on LC and LC/MS analysis of polyphenolic compounds from bee pollen samples are listed in .
Table 37. International data on the protein content (% D.M) of bee pollen.
In the past, fragmentation behavior of phenolic compounds, especially flavonoids, have been extensively investigated. A great number of rules for structural characterization of unknown compounds, even without the reference standards, were summarized (de Rijke et al., Citation2006). As experience shows, fragmentation pathways are largely independent of the ionization mode (ESI or APCI) and the type of instrument (triple quadrupole or ion trap) used (de Rijke et al., Citation2003; Rauha et al., Citation2001) so that rules can be applied for resolving spectral data obtained with modern instruments. Characteristic m/z values of fragment ions from mass spectral data used for identification of certain polyphenolic compounds from bee pollen are listed in .
Table 35. Mass spectral data of compounds detected in extracts of bee pollen.
Table 36. Primer Sequences with indexes SA501 – SB712 (adapted from Kozich et al., Citation2013).
7.3.2. UHPLC-HESI-MS/MS technique for determination of phenolic compounds
The LTQ-Orbitrap spectrometer supports a wide range of applications. Its MS/MS capabilities make this mass spectrometer extremely powerful, among other things, for unambiguous detection of polyphenolic compounds (Kečkeš et al., Citation2013; Natić et al., Citation2015; Pantelić et al., Citation2014; Ristivojević et al., 2014). Some chromatograms and mass spectra from our previous research are shown on . Instrumentation and conditions for determination of phenolic compounds using this method are as follows:
Figure 38. Base peak chromatograms of (a) cherry wine and (b) Cabernet Sauvignon-Central Serbia in positive ion mode. (Pantelić et al., Citation2014).
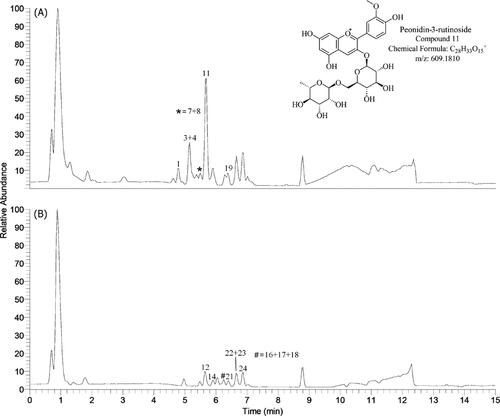
Figure 39. Extracted ion chromatograms and MS/MS spectra of cyanidin-3-rutinoside (Pantelić et al., Citation2014).
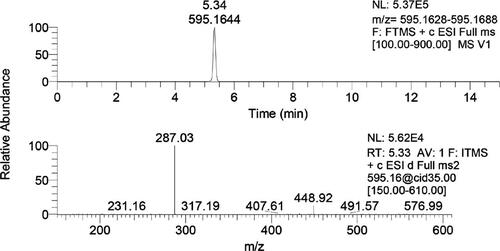
Pollen extracts (Section 7.2);
Thermo Scientific liquid chromatography system equipped with:
Quaternary Accela 600 pump;
Accela Autosampler;
Linear ion trap-Orbitrap hybrid mass spectrometer (LTQ OrbiTrap XL, Thermo Fisher Scientific, Bremen, Germany) with heated electrospray ionization (HESI);
Hypersil gold C18 column (50 × 2.1 mm, 1.9 µm) from Fisher Scientific.
Mobile phases:
water + 0.1% formic acid;
acetonitrile + 0.1% formic acid.
Linear gradient: 0–5 min from 5% to 95% (B), 5–6 min 95% (B) then 5% (B) for 3 min;
HESI-source parameters:
Source voltage 4 kV;
Capillary voltage −47 V;
Tube lens voltage −159.11 V;
Capillary temperature 275 °C;
Sheath and auxiliary gas flow (N2) 25 and 8 (arbitrary units);
100–1500 m/z;
Collision energy 35 eV.
Injection volume 5 µl;
Flow rate of 0.400 ml/min.
8. Standard method for identification of bee pollen mixtures through meta-barcoding
Pollen analysis is a central part of bee ecology research (Carvell et al., Citation2006; Danner et al., Citation2014; Köppler et al., Citation2007). Identification of plant species origin of bee collected pollen traditionally relies on light microscopy and discrimination based on morphological differences of pollen grains (Mullins & Emberlin, Citation1997). This is labor- and time-intensive (Galimberti et al., Citation2014), requires expert knowledge (Keller et al., Citation2015) and lacks discriminative power at lower taxonomic levels (Galimberti et al., Citation2014; Williams & Kremen, Citation2007), which means that pollen from closely related plant species often has to be analyzed at the family or genus level. Recently, meta-barcoding has emerged as a suitable alternative for pollen analysis (Keller et al., Citation2015; Kraaijeveld et al., Citation2015; Richardson et al., Citation2015; Valentini et al., Citation2010). However, due to a missing consensus on the best marker for plant species identification and the variety of DNA sequencing platforms available, different methods and protocols exist (e.g., Bruni et al., Citation2015; Galimberti et al., Citation2014; Keller et al., Citation2015; Kraaijeveld et al., Citation2015; Richardson et al., Citation2015), which makes it difficult to compare independent studies. We here present a detailed protocol of the method described recently (Sickel et al., Citation2015) as a research standard that is highly cost-efficient and overcomes those limitations. It is based on ITS2-meta-barcoding, which has been validated for plant barcoding (Chen et al., Citation2010) and for which a comprehensive database has been established (Ankenbrand, Citation2015). A variant of this method has been recently developed also for the rbcl gene, and analyzing both markers in parallel with this workflow is recommended for most applications (Bell et al., Citation2019). Beside the laboratory process, we also provide information on data processing and analysis.
8.1. Meta-barcoding protocol
8.1.1. Required materials
8.1.1.1. Reagents
DNA isolation kit suitable for pollen grains (e.g., Macherey-Nagel NucleoSpin Food, Düren, Germany); PCR grade water; Ethanol (96–100%); Primers as given in ; Polymerase with proof-reading ability including dNTPs, GC buffer and co-factors (e.g., 2 × Phusion Master Mix); Agarose, suitable buffer (e.g., TAE), intercalating dye (e.g., Midori Green Advance, Biozym Scientific GmbH, Hessisch Oldendorg, Germany), 6 × loading dye, DNA ladder (e.g., FastRuler Low Range DNA Ladder, Life Technologies, Carlsbad, CA, USA); SequalPrepTM Normalisation Kit 96 wells (Invitrogen, Carlsbad, CA, USA); Bioanalyzer High Sensitivity DNA Chip (Agilent Technologies, Santa Clara, CA, USA); dsDNA High Sensitivity Assay (Life Technologies, Carlsbad, CA, USA); MiSeq Reagent Kit v2 2 × 250 bp (Illumina Inc., San Diego, CA, USA); 1 N NaOH (stock solution); PhiX Sequencing Control v3 (Illumina Inc., San Diego, CA, USA)
8.1.1.2. Laboratory equipment
Microliter pipettes and tips; Microcentrifuge tubes; Electronic pestle; Bead mill; Incubator; Vortexer; Table centrifuge; 96 well PCR plates and PCR foils; 96 well plate cooling block; 96 well plate centrifuge; Thermal cycler; Agarose gel former; microwave, gel electrophoresis chamber; UV illuminator; Bioanalyzer, chip vortexer; Qubit Fluorometer; Access to an Illumina MiSeq desktop sequencer with MiSeq Control Software version 2.2 or later.
8.1.2. Pollen acquisition
Pollen sampling should be performed as described in the pollination chapter of the COLOSS BEEBOOK Vol. 1, chapters 3.1. and 4.1.1 (Delaplane et al., Citation2013). For long-term storage, we recommend lyophilization before freezing at −80 °C.
8.1.3. Laboratory workflow
8.1.3.1. DNA extraction
For the DNA extraction step, we recommend using the Macherey-Nagel (Düren, Germany) NucleoSpin Food Kit and following the supplementary guidelines for pollen samples, but equivalent extraction procedures may also be comparable. The DNA extraction steps are as follows:
Take 2 g of pollen and add 4 ml bidest H2O;
Homogenize the sample with an electronic pestle;
Take 200 µl (∼50 mg pollen) of the emulsion and grind it in a bead mill;
Add 400 µl Buffer CF (preheated to 65 °C) and 10 µl Proteinase K and mix carefully;
Incubate at 65 °C for 30 min;
Centrifuge the mixture for 10 min (>10,000 × g);
Transfer the supernatant into a new microcentrifuge tube and add 1 vol Buffer C4 and 1 vol ethanol;
Vortex for 30 s;
Pipette 700 µl mixture onto a NucleoSpin Food Column placed in a Collection Tube;
Centrifuge for 1 min at 11,000 × g;
Discard the flow-through;
Repeat steps 9-1;
Add 400 µl Buffer CQW onto the spin column;
Centrifuge for 1 min at 11,000 × g;
Discard the flow-through;
Add 700 µl Buffer C5 onto the spin column;
Centrifuge for 1 min at 11,000 × g.
Discard the flow-through;
Add 200 µl Buffer C5 onto the spin column;
Centrifuge for 2 min at 11,000 × g;
Place the spin column into a new 1.5 ml microcentrifuge tube;
Add 100 µl Elution Buffer CE (pre-heated to 70 °C) onto the membrane;
Incubate for 5 min at room temperature (18–25 °C);
Centrifuge for 1 min a 11,000 × g;
Proceed with amplification or keep frozen until further processing.
8.1.3.2. Amplification
This protocol utilizes a dual-indexing strategy (Kozich et al., Citation2013) amplifying the ITS2 region, using the primers ITS-S2F (Chen et al., Citation2010) and ITS4R (White et al., 1990), but can be adapted to amplify other markers (Bell et al., 2019). The primer sequences are as follows: forward: 5′-AATGATACGGCGACCACCGAGATCTACAC XXXXXXXX CCTGGTGCTG GT ATGCGATACTTGGTGTGAAT-3′; reverse: 5′-CAAGCAGAAGACGGCATACGAGAT XXXXXXXX AGTCAGTCAG CC TCCTCCGCTTATTGATATGC-3′, where XXXXXX indicates the variable index sequences (). The detailed protocol is described below:
Table 39. Protein content (%) using different distillation times.
Table 40. Protein content (%) analyzing different quantities of pollen.
Sample index combinations should be planned beforehand according to the scheme in ;
Prepare 3 × 10 µl reaction mixes for each sample containing (also see PCR sample design below for details):
a. 5 µl 2 × Phusion Master Mix (New England Biolabs, Ipswich, MA, USA) or equivalent;
b. 0.33 µM each of the forward and reverse primers (sample-specific combinations of forward and reverse index sequences);
c. 3.34 µl PCR grade water;
d. 1 µl DNA template.
Carry out the PCR with a program of:
95 °C for 4 min, then;
37 cycles of 95 °C for 40 sec;
49 °C for 40 sec;
72 °C for 40 sec. and
a final extension at 72 °C for 5 min.
Combine the triplicate PCR reactions of each sample and mix well.
For quality control purposes, successful amplification can be checked on a 1% agarose gel using 5 µl of the combined PCR product.
The design used in 96-well PCR sample is:
Design 1: Well-equipped laboratories with pipetting robots or 96-channel pipettes can directly fill each well with a different sample and generate three replicates of these. This will result in 4 × 3 replicate 96-well plates according to used for amplification. After amplification one can proceed with normalization.
Design 2: For laboratories with little equipment for automated pipetting, the workflow described above is impractical, since manual pipetting in that format is time-intensive and pipetting errors can be easily introduced. To facilitate the process, we recommend to work with all triplicates but only 24 samples on one 96 well plate (). This way, 16 PCR plates will be produced, but pipetting effort is minimized. PCR plate labeling is therefore of utter importance, for example with roman numbers, I – XVI to be able to map the samples back to the scheme in . The complete workflow is shown schematically in and described in the following:
Prepare two PCR master mixes, each containing one forward primer, corresponding to the samples you want to amplify; each master mix contains:
200 µl 2 × Phusion Master Mix (New England Biolabs, Ipswich, MA, USA) or equivalent.
13.2 µl forward primer (10 µM).
133.6 µl PCR grade water.
Place a new PCR plate into a cooling block;
Distribute 26 µl of the master mixes into row A (Master Mix 1) and F (Master Mix 2);
Add 1 µl of the correct reverse primer;
Add 3 µl of the correct DNA template;
Using a pipette set to 10 µl, pipette up and down to mix and distribute 10 µL each into the two rows below: from row A into rows B + C; from row F into rows G + H;
Seal with a foil, spin down briefly;
Perform PCR;
Prepare a 1% agarose gel;
After PCR, briefly spin down again;
Lift the foil carefully and combine the triplicate reactions, pipette up and down to mix;
For gel electrophoresis, add 1 µl of 6× loading buffer into the so far unused rows D + E;
Add 5 µl PCR product to the loading buffer;
Briefly spin down;
Load the gel, add a DNA ladder;
Run the gel (e.g., 25 min, 120 V);
Check under UV illuminator for successful PCR amplification;
Freeze PCR product until further processing;
Continue with normalization.
8.1.3.3. Normalisation
To ensure more equalized library sizes, DNA amounts in each PCR product are normalized using the SequalPrepTM Normalisation Kit (Invitrogen, Carlsbad, CA, USA). For 384 samples, four normalization plates are needed. After normalization, samples from each plate will be combined in “plate pools” for the following quality control.
Design 1: Pool the samples of all three replicates together by keeping the sample scheme. Transfer 25 µl of PCR products onto the normalization plates. Proceed with the normalization as described below.
Design 2: For normalization, PCR plates I – IV; V – VIII; IX – XII and XIII – XVI will be combined to normalization plates 1, 2, 3 and 4. The pipetting scheme is as follows:
Thaw the PCR plates.
Briefly spin down.
Use four normalization plates and add 25 µL of PCR product into the wells following this scheme.
Normalization Plate 1: PCR plates I –IV
PCR plate I: row A →row A; row F → row B
PCR plate II: row A →row C; row F → row D
PCR plate III: row A →row E; row F → row F
PCR plate IV: row A →row G; row F →row H
Repeat analogous for the other three normalization plates.
Proceed with the normalization as described below.
Design 1 & 2: Continue for both designs with the normalization:
Add 25 µl of Binding buffer;
Mix by pipetting up and down or seal the plate with foil tape, vortex to mix and briefly centrifuge the plate;
Incubate for 1 hour at room temperature; alternatively leave to incubate overnight;
Aspirate liquid from wells, do not scrape the well sides;
Add 50 µl Wash buffer, mix by pipetting up and down;
Completely aspirate the buffer from wells, you may need to invert and tap the plate on paper towels;
Add 20 µl of Elution buffer;
Mix by pipetting up and down or seal the plate with foil tape, vortex and briefly spin down;
Incubate for 5min at room temperature;
Combine 5 µl of each sample (plate-wise) in a new microcentrifuge tube, mix well;
Prepare 1:10 dilutions of each plate pool;
8.1.3.4. Quality control and quantification
Quality control is performed on a Bioanalyzer High Sensitivity DNA Chip (Agilent Technologies, Santa Clara, CA, USA) to ensure that the correct fragment size (peak at approximately 450 bp; target plus adapters) has been amplified. Additionally, libraries are quantified using the dsDNA High Sensitivity Assay on the Qubit fluorometer (both Life Technologies GmbH, Darmstadt, Germany) in order to combine the four plate pools equimolarly to the final sequencing library. We recommend preparing three independent concentration measurements per plate pool.
Bioanalyzer:
Prepare a Bioanalyzer Chip according to the protocol;
Allow all reagents to equilibrate to room temperature;
If not ready, prepare a gel-dye mix;
Add 15 µl of the dye concentrate (blue lid) to a gel matrix vial (red lid);
Vortex well and spin down, transfer to spin filter;
Centrifuge at 2240 × g for 10 min;
Protect solution from light, store at 4 °C, use within 6 weeks;
Put a new chip on the chip priming station;
Pipette 9 µl gel-dye mix into the well marked with a white “G”;
Close the chip priming station, with the plunger at position 1ml;
Press plunger until held by the clip;
Wait for 60 s then release clip;
After 5 s slowly pull back the plunger to the 1ml position;
Open the priming station, pipette 9 ml gel-dye mix in the wells marked with black ‘G’s;
Pipette 5 µl marker (green lid) into all sample wells and the ladder wells;
Pipette 1 µl of ladder (yellow lid) in the well-marked with a ladder symbol;
In each sample well, pipette 1 µl of sample (concentrated and diluted Plate pools) or 1 µl marker (unused wells);
Put the chip horizontally in the adapter and vortex for 1 min at 2400 rpm;
Run the chip within 5 min;
The samples are of sufficient quality, if the electropherograms show a single peak at approximately 450bp; this peak can be rather wide due to different lengths of the ITS2 region, a minor peak shortly after the lower marker is acceptable and corresponds to left-over primer dimers, which will not interfere with sequencing.
8.1.3.5. Quantification
Measure concentrations of plate pools with the dsDNA High Sensitivity Assay on the Qubit Fluorometer.
Mix 1 × n µl Qubit reagent with 199 × n µl Qubit buffer (working solution).
For each measurement, mix 180–199 µl working solution with 1–20 µl sample.
Vortex and incubate at room temperature for 2 min.
Combine plate pools to final library equimolarly, starting with the least concentrated library of which take 20 µl.
Quantify the final pool and dilute to 2 nM, if final pool contains less than 2 nM proceed without dilution.
8.1.4. Sequencing
Before sequencing, a sample sheet has to be prepared. This can be done at the MiSeq instrument using the Illumina Experiment Manager (IEM). However, due to the high number of samples, we recommend to prepare the sample sheet in advance, which can be done on a different computer with the IEM installed, and load it on to the MiSeq instrument when starting the sequencing procedure. Due to using custom index sequences, a new assay has to be added to the IEM, this is described in the Supplemental Material of Kozich et al. (Citation2013).
For library dilution, we follow the Illumina Sample Preparation Guide for a 2 nM library, with some modifications. In order to increase read quality, 5% PhiX control is added to the sample library. Additionally, the reagent cassette of the sequencing kit (e.g., Illumina MiSeq Reagent Kit v2 2 × 250 bp) is spiked with the custom Read1, Read2 and index primers (for primer sequences, see ).
8.1.4.1. Sample library
Remove Buffer HT1 from freezer.
Prepare a fresh dilution of 0.15 N NaOH (less than a week old).
Mix 5µl of the sample library with 5 µl of 0.15 N NaOH.
Vortex briefly and centrifuge at 280 × g for 1 min.
Incubate at room temperature for 5 min.
Add 990 µl Buffer HT1 (10 pM library).
Mix 480 µl of 10 pM library and 120 µl Buffer HT1 (8 pM library).
8.1.4.2. PhiX control
Thaw PhiX control at room temperature.
Mix 2 µl 10 nM PhiX control with 3 µl H2O (4 nM PhiX).
Add 5 µl 0.15 N NaOH.
Vortex briefly and centrifuge at 280 × g for 1 min.
Incubate at room temperature for 5 min.
Add 990 µl Buffer HT1 (20 pM PhiX).
Mix 375 µl of 20 pM PhiX and 225 µl Buffer HT1 (12.5 pM PhiX).
Mix 570 µl 8 pM library with 30 µl 12.5 pM PhiX.
8.1.4.3. Preparing reagent cassette and loading the sample
Remove the reagent cassette from the freezer.
Rename the sample sheet to match the barcode of the reagent cassette.
Place in water bath, do not fill higher than maximum water line.
Prepare 3 µl each of Read1, Read2 and index primers in new microcentrifuge tubes.
Remove cassette from water bath, dry with paper towel.
Invert the cassette several times to mix.
Inspect wells, make sure all reagents are thawed and there are no precipitates.
Gently tap the cassette on the bench to remove air bubbles.
With a 1000 µl pipette tip, break the foils over wells 12–14 and well 17.
With a 100 µl pipette set to 75 µl, transfer the read and index primers to the following wells of the reagent cartridge: Read1 → Well 12; Index → Well 13; Read2 → Well14, mix well by pipetting up and down.
Load 600 µl of the spiked library to well 17.
Load the cassette, PR2 bottle and flow cell as prompted by the instrument.
Sequence.
8.2. Bioinformatics
8.2.1. Required software
up to date Linux or Unix-based OS.
usearch, version v11 (Edgar, Citation2010), if necessary add location to your system PATH.
usearch additional python scripts, https://drive5.com/python
8.2.2. Classification
8.2.2.1. Reference databases
Reference database for direct classification
We recommend to first use a reference database that is most specific to your project design and limited in represented taxa. This helps strongly with the quality of the assignments. Examples for restrictions are species lists for the biogeographic region or specific taxonomy groups of interest. Such databases can be created with the BCdatabaser software (Keller et al., Citation2020). If you have unpublished sequences of your laboratory that should be considered as well, add them into this file.
Reference database for hierarchical classification
All remaining sequences not classified with the direct database can be additionally classified to a hierarchical taxonomic level as deep as possible. For this it is important to have a database that covers all taxonomic groups. One such database could be for ITS2 accessible under the DOI https://doi.org/10.5281/zenodo.3339028 which was also created with the BCdatabaser.
8.2.2.2. Preparation and classification of sequencing data
The sequence reads created in step 2.3.5 have to be joined, quality filtered and classified. For this purpose:
Copy all R1 and R2 fastq files and the reference database folders into a single folder.
Navigate on the command line shell to this folder.
Merge forward and reverse reads:
usearch -fastq_mergepairs *R1*.fastq \
-relabel @ \
-fastq_minmergelen 150 -fastq_maxmergelen 350 \
-fastqout analyse_merged.fq -fastq_maxdiffs 15
Quality filtering and format parsing:
usearch -fastq_filter analyse_merged.fq
-fastq_maxee 1 -fastaout reads.fa
sed "s/∧>\([a-zA-Z0-9-]*\)\.\([0-9]*\)/>1_\2;barcodelabel=\1;/g"\ reads.fa > reads_bc.fa
Cluster amplicon sequence variants:
usearch -fastx_uniques reads_bc.fa \
-sizeout -minuniquesize 3
-fastaout reads_bc.derep.fa
usearch -sortbysize reads_bc.derep.fa \
-fastaout reads_bc.derep.sort.fa
usearch -unoise3 reads_bc.derep.sort.fa \
-zotus reads_bc.zotus.fa \
-tabbedout unoise3.txt
Classify with direct reference database:
usearch -usearch_global reads_bc.zotus.fa \
-db PATH-TO-DIRECT-DB/sequences.tax.fa \
-id 0.97 -uc reads_bc.zotus_direct.uc -strand both
Classify remaining unclassified sequences with hierarchical reference database:
grep "∧N" reads_bc.zotus_manRefs.uc | cut -f 9 > nohits
SeqFilter reads_bc.zotus.fa - -ids nohits \
-o reads_bc.zotus.nohits.fa
usearch -sintax reads_bc.zotus.nohits.fa \
-db PATH-TO-HIERARCHICAL-DB/sequences.tax.fa \
-tabbedout reads_bc.zotus.sintax -strand plus \
-sintax_cutoff 0.8
Combine classifications:
cut -f1,4 reads_bc.zotus.sintax > reads_bc.zotus.sintax.cut
cat reads_bc.zotus.sintax.cut | \
sed -E -e "s/\_[0-9]+//g" -e "s/,s:.*$//" \
> reads_bc.zotus.sintax.cutx
cut -f 9,10 reads_bc.zotus_ direct.uc | \
grep -v "*" | sed "s/[A-Za-z0-9]*;tax=//" \
> reads_bc.zotus.cutx
echo ",kingdom,phylum,order,family,genus,species" > header.cutx
cat header.cutx reads_bc.zotus.cutx \
reads_bc.zotus.sintax.cutx > taxonomy.data
Count read abundance in the sample data:
usearch -usearch_global reads_bc.fa -strand plus \
-db reads_bc.zotus.fa -id 0.97 -uc zotus.uc
python2.7 PATH-TO-PYTHON-SCRIPTS/uc2otutab.py sample_zotus.uc \
> combined.txt
sed -e "s/OTUId//" combined.txt > combined.out
This procedure will end with the following final files used for further analyses:
(a) combined.out (the abundance of each taxonomic unit in the samples)
(b) taxonomy.data (taxonomy assignments)
These files can be loaded directly into R with the package phyloseq (McMurdie & Holmes, Citation2013). In addition, also the results of the intermediate steps are retained and can be used for troubleshooting, archiving or further analyses.
8.3. Data analysis
8.3.1. Required software
Up to date R distribution (R Core Team, Citation2014).
R package: phyloseq (McMurdie & Holmes, Citation2013); https://joey711.github.io/phyloseq
8.3.2. Prepare sample meta-data
Additionally, to the sequencing data, phyloseq is intended to read in a meta-data file. This can be a simple spreadsheet in csv format with any number of variables to be investigated. For example, continuous vectors like “altitude” or “temperature” or categorical factors as “bee species” or “site” can be used. For this, open the file with your preferred text-editor or spreadsheet application and add columns according to the sampling design. Save the file again in tab-separated format.
8.3.3. Importing data
The data generated above can be directly imported into R as a phyloseq class object. This allows a variety of analytical procedures and is recommended. However, other software tools handling community datasets may be equally well used for the task of analyses. The following are R scripts, which can be directly used on the console:
Load packages and data:
library(phyloseq) # load the package
setwd("<PATH-TO-DATA>") # data folder
tax <- tax_table(as.matrix(read.table("taxonomy.data", header = T,row.names = 1,fill = T,sep=",")))
otu <- otu_table(read.table("zotu_table.txt", header = T, row.names = 1), taxa_are_rows = T)
map <- sample_data(read.table("microbiome_DATA_SamBoff.csv", sep=",", header = T, row.names = 1,fill = T))
data <- merge_phyloseq(otu, tax, map) # create phyloseq object
Adjust for missing taxa names in hierarchical classification:
tax_table(data)[tax_table(data)[,"phylum"]=="","phylum"]<- paste(
tax_table(data)[tax_table(data)[,"phylum"]=="","kingdom"],
"_spc",sep="")
tax_table(data)[tax_table(data)[,"order"]=="","order"]<- paste(tax_table( data)[tax_table(data)[,"order"]=="","phylum"],
"_spc",sep="")
tax_table(data)[tax_table(data)[,"family"]=="","family"]<- paste(
tax_table(data)[tax_table(data)[,"family"]=="","order"],
"_spc",sep="")
tax_table(data)[tax_table(data)[,"genus"]=="","genus"]<- paste(
tax_table(data)[tax_table(data)[,"genus"]=="","family"],
"_spc",sep="")
Combine Amplicon Sequence Variants to species or genus level:
(data.genus <- tax_glom(dataset.comp, taxrank="genus"))
(data.species <- tax_glom(dataset.comp, taxrank="species"))
Transform to relative abundances and filter low abundance taxa:
data.genus.rel = transform_sample_counts(data.genus,
function(x) x/sum(x))
otu_table(data.genus.rel)[otu_table(data.genus.rel)<0.01 ]<-0
After completion of the tasks above, the dataset is in a condition where individual analyses can be started. The tutorials at the repository of phyloseq ((McMurdie & Holmes, Citation2013); https://joey711.github.io/phyloseq) provide a good starting point for this.
8.3.4. Recommended packages for further analysis
Whilst phyloseq provides basic tools suited for most purposes, the modularity of R packages allows a variety of more and deeper analyses. It is not possible to discuss all the features here, yet we provide a list some of the major packages relevant for community ecology and pollination studies:
vegan: comprehensive community ecology package;
picante: phylogenetic diversity indices;
bipartite: interaction network ecology;
edgeR: sequencing library size correction.
9. Standard method for the determination of protein content of pollen using the Kjeldahl method
9.1. Introduction
The knowledge of bee pollen chemical composition increases the commercial value of the product. Especially, among the chemical constituents of bee pollen, the proteins’ concentration has been the most studied (). There seems to be a considerable variation among the results regarding the protein concentration, probably because of the different number of the analyzed samples and whether the pollen samples are unifloral or polyfloral.
For the determination of the total protein content, the majority of authors use the Kjeldahl method modified for bee pollen analysis by Rabie et al. (Citation1983). However, the method of analysis has not been investigated. Regarding the calculation of the nitrogen content in this type of samples, several authors used different factors (6.25 or 5.60). Indeed, Rabie et al. (Citation1983), recommended the factor 5.60, while Serra-Bonvehí and Escolá Jordá (Citation1997) stated that the use of factor 6.25 would overestimate the protein content of analyzed samples. The follow methods elucidate the optimum conditions, in order to minimize the reagents’ consumption and the sample quantity.
9.2. Determination of protein content by Kjeldahl method
Weigh 1 g of bee pollen.
Heat the sample with 20 ml of sulfuric acid (95–97%) at the presence of a catalyst (potassium sulfate, copper sulfate) for about 4 h until the solution becomes clear and blue-green in color.
Neutralize the digested sample with 90 ml NaOH (30%) and distillate the solution for 2 min using for the trapping of NH3, 30 ml of H3BO3 solution (4%).
Titrate with HCl solution (0.1 M).
9.3. Development of the method
For the development and validation of the suggested method, bee pollen of Papaver rhoeas was used. In order to find the optimum conditions for the determination of the protein content of bee pollen tests were applied regarding the volumes of NaOH, and H3BO3 solutions, the quantity of sample and the distillation time.
9.3.1. Volume of NaOH solution
During the distillation, the NaOH solution converts any nitrogen in the bee pollen into NH3, while the appearance of the blue color demonstrates a sufficient volume of the solution for this formation. Volumes of 50 ml, 60 ml, 70 ml, 80 ml, 100 ml and 110 ml were tested. No change of color was observed in volumes of 50 ml to 80 ml, while in volume of 90 ml, the color turned from light green into dark blue indicating the end of the reaction. The volumes of 100 ml and 110 ml were rejected, to avoid the unnecessary consumption and to reduce the cost of the analysis. Thus, the suitable volume of the NaOH solution (30%) was determined at 90 ml.
9.3.2. Volume of H3BO3 solution
Boric acid is used for the capture of NH3, during distillation. Volumes of 30 ml and 40 ml were tested without statistically significant changes to be observed between the results (Duncan’s multiple range test, α = 0.05) (). Eventually, the volume of 30 ml of the H3BO3 solution (4%) was chosen for the analysis.
Table 38. Determination of the protein content (%) using different volumes of the H3BO3 solution.
9.3.3. Distillation time
Different distillation periods of time (2, 3, 4 min) were used in order to choose the most appropriate. In all cases, 1 g of sample, 90 ml NaOH and 30 ml H3BO3 were used. According to the statistical process of the results, no significant changes were observed in the protein content regarding to the distillation time (). For this reason, the shortest time of 2 min was chosen for the analysis.
9.4. Sample preparation
For the chemical analysis of bee pollen of a single plant, the pollen pellets should be separated from the mixture according to its color, shape and texture and this is a tedious and time consuming process. Consequently, the minimum amount of pollen for chemical analysis will reduce the needed time and facilitate the analysis.
Different quantities of pollen 0.5 g, 1 g and 2 g were tested with five replications in each case, maintaining the other parameters constant.
The volumes of 90 ml NaOH and 30 ml H3BO3 were used, while the distillation time was 2 min.
Statistically significant changes were observed regarding to the protein content (). The minimum quantity of 0.5 g gave significantly less amount of proteins, while no differences were found when one or two grams were used.
Table 43. Total lipid content (%) in pollen samples, by using different elution times (3 h, 5 h, 7 h).
After that, we propose the use of one gram sample for the analysis of proteins in bee pollen samples.
9.5. Validation of the method
For the determination of the repeatability of the method:
eight pollen samples of Papaver rhoeas of the same quantity (1 g) were analyzed;
samples were treated equally during the three steps of the Kjeldahl method, as described previously;
average protein content of Papaver rhoeas pollen was found 20.6%, while the low value of RSD (0.81%) indicated the very good repeatability of the method.
9.6. Application of the method
Pollen from different botanical species has different nutritional value for honey bees, affecting the development and the productivity of the bee colony. To investigate qualitative and quantitative differences on pollen composition we collected bee pollen samples from the apiary of Aristotle University in consecutive years during the full season and samples from beekeepers all over Greece. The samples were analyzed as a mixture or as separate pollen pellets that are classified according to their color, shape and texture. For the identification of the pollen microscopic method is applied. Monofloral and multifloral bee pollen samples were analyzed using the method described above. Some of the results regarding the differences based on plant origin are presented below, in . The lowest value was observed for Actinidia chinensis (9.7%) and the highest for Crocus sativa (26.1%). The range of 16.4%, confirms the large variation among pollen from different plants. The protein content of mixed bee pollen samples was also examined during the whole beekeeping season, in order to find out differences based on the harvesting period ().
Figure 40. (a) Extracted ion chromatograms of phenolic glyceride derivatives with their retention times and accurate masses; (b and c) mass spectra of two phenolic glyceride derivatives with the same accurate masses, m/z 413 (Ristivojević et al. 2014).
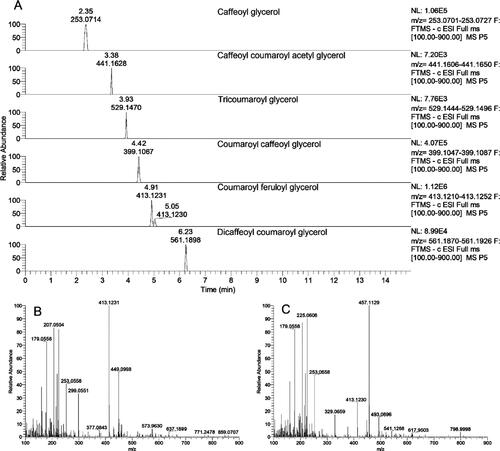
Figure 41. Planning scheme for samples and the corresponding index-combinations. Roman numbers indicate PCR plate numbers, bold Arabian numbers on 96 well plates indicate normalization plate number.
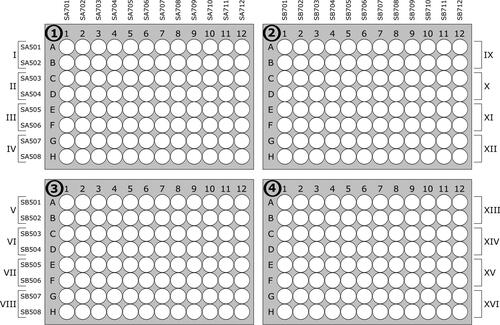
The mixed pollen samples collected from March till the middle of June indicated that the nutritional requirements of bees are very well met since the protein content ranged from 19.7% to 26.6%. Herbert (Citation1992) mentions that a protein content of 20–23% in pollen substitutes is ideal for the dietary requirements of honey bees. As opposed to that, pollen collected from the middle of June till the middle of September had average protein content below 20%, including the lowest observed value (14.8%) in the end of August. During autumn, the protein content of pollen increased again and exceeded 20%. According to these results, it is obvious that the protein content of mixed pollen ranges according to the season and this could affect the colony’s development and the quality of the bee product for sale.
10. Standard method for determination of lipid content of pollen using Soxhlet extraction
10.1. Introduction
The lipid fraction is one of the basic constituents of bee pollen and varies significantly among the different botanical species (Somerville, Citation2001; Yang et al., Citation2014). Several authors have studied the lipid concentration in pollen, whose results are referred in . The variations among the research observed, could be attributed to the different number of the analyzed samples and to variable botanical origin of the samples. The most common method for the determination of the total lipid content of foods is the extraction method described by Soxhlet. According to this procedure, oil and fat are extracted by repeated elution with an organic solvent (extraction cycle). Nevertheless, in case of the extraction of lipids in pollen, there is vagueness about the optimum methodology concerning the reagent’s consumption, the sample quantity and the elution time. The following methods clarify these parameters and provide experimental results that should be implemented to produce reliable analytical data on lipids analysis of pollen.
Table 41. International data on the lipid content (% DM) of bee pollen.
10.2. Methodology for total lipid content determination
The total lipid content is determined as crude fat from a solvent extract.
weigh 2 g of bee pollen and place in a porous cellulose thimble (25 × 100 mm).
place the thimble in an extraction chamber, which is suspend above a round bottom flask containing petroleum ether as solvent and below a condenser.
heat the flask – evaporate the solvent and move up into the condenser where it is converted into a liquid that trickle into the extraction chamber containing the sample. This extraction cycle is repeated many times for 5 hours. In order to remove the excess solvent.
fat residue is dried in an oven at 80 °C for 45 min until to constant weight.
place the flask for 15 minutes in a desiccator which contains CaCl2, in order to cool down without absorbing moisture.
estimate the fat content as the difference in weight of the flask before and after the extraction. Express as percent of dry matter.
10.3. Development of the method
For the development and validation of the previous method, pollen of Papaver rhoeas was chosen.
Pollen samples: collected from traps placed in bee hives (in this example they were located in the surrounding area of Thessaloniki). The specific plant taxon was chosen, because of its abundance in the area where the bee hives were located and its regular foraging by the bees. Moreover, its pollen loads possess a distinct black color, so they can be separated easily from mixed pollen samples.
Determination of the optimum quantities of the materials and the appropriate analysis’ conditions of the method – tests implemented regarding the pollen amount (1 g, 2 g, 3 g), extraction time (3 h, 5 h, 7 h) and the type of the solvent (acetone, petroleum ether, hexane). Statistically significant differences were found in total lipid content (Duncan’s multiple range test, α = 0.05), using different amounts of pollen () and different elution times (), while no significant differences were observed by using different solvents (). Note: Considering that the separation of pollen samples based on color is a tedious and time consuming process, the quantity of pollen should minimize as possible. As a consequence, according to the , the amount of 2 g was chosen for the analysis.
Table 42. Total lipid content (%) by using different amount of pollen for the analysis.
Table 44. Total lipid content (%) in pollen samples, by using different solvents (acetone, petroleum ether, hexane).
Elution time the period of 5 h was chosen. The time of 7 h was rejected in order to reduce the time consumption, while when 3 h elution was applied statistically significant differences were observed in the total lipid content.
Solvent extraction – no statistically significant differences were found among the solvents and petroleum ether is widely referred in bibliography for the extraction of the lipids in pollen this liquid was chosen as the appropriate solvent.
10.4. Validation of the method
For the determination of the repeatability of the method, Papaver rhoeas pollen was separated, homogenized and eight subsamples of 2 g analyzed under the same conditions (extraction time: 5 h, solvent: petroleum ether). The average liquid content of Papaver rhoeas was found 2.47%, while the relative standard deviation (RSD) was 4.66% indicating a satisfactory precision.
10.5. Application of the method
The method described above was applied in monofloral and polyfloral pollen samples collected from University apiary. Some of the results regarding the differences based on plant origin are presented in . The identification of pollen taxa was based on the microscopic characteristics (Lau et al., 2018; Louveaux et al., Citation1978). The lowest value was observed for Erica manipuliflora (0.40%) and the highest for Echinops ritro (13.60%). The average of the samples examined was 4.61% and the range was 13.2%.
Figure 42. Detailed workflow (schematic), suitable for laboratories with limited access to equipment for automated pipetting. Bold numbers indicated step number of Design 2 in Section 8.1.3.2.
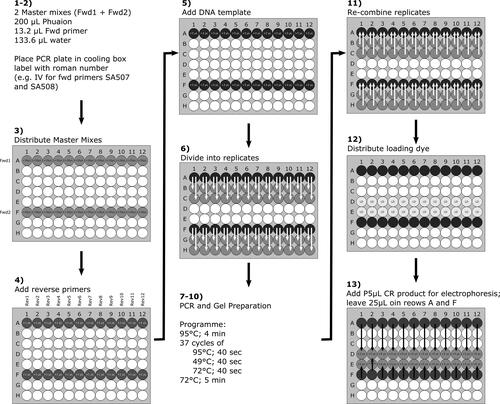
The lipid content of mixed pollen samples was also examined during the whole beekeeping season, in order to find differences based on the harvesting time (). The higher lipid content of mixed pollen samples was observed in samples collected between 19/9 until 15/10. Pollen collected early in autumn (13/9) has very low lipid content (2.15%) but after that, the lipid concentration increases considerably to reach the high level of 6.22% on the day 15/10. One factor that may contribute to this increase is the second period of blooming of Sisymbrium irio which is very reach in lipids (7.22%). The fluctuation of lipid curve of pollen mixtures collected in different period of year () indicates the effect of various blossoms to the final chemical composition of pollen.
Figure 43. Crude protein content (% D.M) of bee pollen from selected botanical origins.
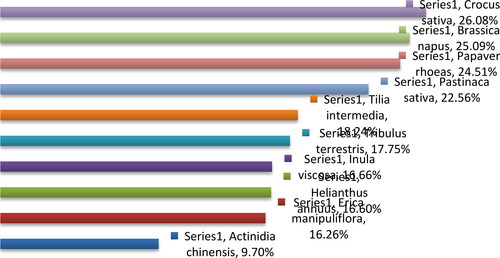
Figure 44. Protein content (% D.M) of mixed pollen samples harvested during the beekeeping season of 2011.
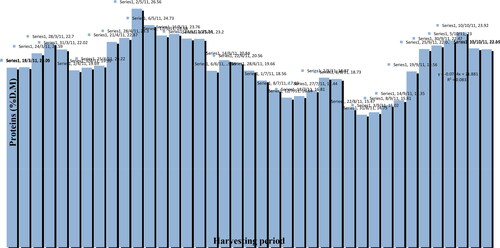
Figure 45. Crude lipid content (% D.M) of bee pollen from selected botanical origins.
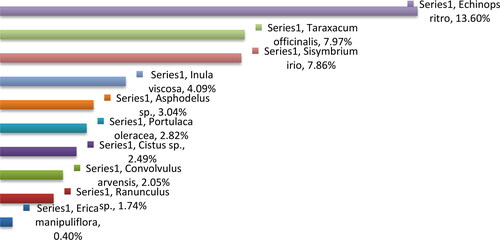
Figure 46. Lipid content (% D.M) of mixed pollen samples harvested during the beekeeping season of 2013.
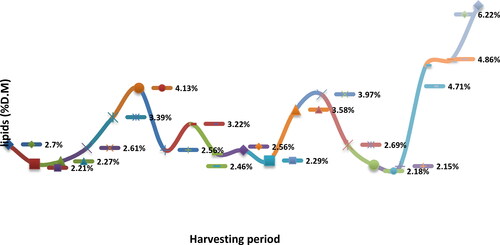
Figure 47. (a) Structure of PAs: Necinic acids are connected to the necine base by ester bond in position 1 and/or 7. Necinic acids can be connected to form a macrocyclic ester; (b) Example of PA free base and N-oxide macrocyclic esters (Hartmann & Witte, Citation1995).
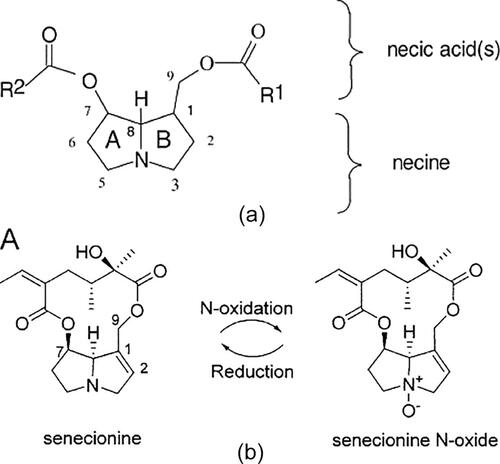
11. Determination of sugar content in pollen using HPLC-RID
11.1. Introduction
Carbohydrates are the sugars, dietary fiber, and starch which constitute the main fraction of pollen dry matter and represent important components from the nutritional and energy point of view. Collected pollen provides bees a valuable source of simple sugars and other carbohydrates which are essential for proper nutrition and advisable for certain physiological conditions. The generally accepted calculation for total carbohydrate content in pollen is: 100 – (g fat + g protein + g ash + g water) (Bogdanov, Citation2015; Feas et al., 2012; Human & Nicolson, Citation2006; Kostić et al., Citation2015; Nogueira et al., Citation2012; Yang et al., Citation2014) (). This calculation is much higher than results received through HPLC or GC methods because they do not determine such components as dietary fiber, starch, and cell wall material. Studies dealing with the composition of sugars in pollen were concerned with the total content of reducing and non-reducing sugars (Cirnu et al., Citation1969; Rosenthal et al., Citation1969; Solberg & Remedios, Citation1980; Szczęsna et al., Citation1995a, Citation1995b; Youssef et al., Citation1978).
Table 45. Literature data on the carbohydrate content of bee pollen calculated as: 100 – (g fat + g protein + g ash + g water) (g/100 g DM).
Advances in chromatographic techniques with different detections (TLC, HPLC-RID, HPTLC, HPLEC-PAD, HPLEC coupled to LC-ESI-MS, GC-FID; GC-MS) made it possible to analyze, in detail, the composition of sugars in bee pollen (Aratchi et al., 2018; Bobis et al., Citation2010; Echigo et al., Citation1986; Mărgăoan et al., Citation2012; Martins et al., Citation2011; Qian et al., Citation2008; Serra-Bonvehí et al., Citation1986; Serra-Bonvehí & Escolá Jordá, Citation1997; Szczęsna, Citation2007; Szczęsna et al., Citation2002; Taha, Citation2015). The quality and quantity composition of pollen sugars was found to be closely related to the plant species of origin as well as to the methods of analysis. Researchers identified fourteen different sugars in pollen of which fructose, glucose, and sucrose occurred in the greatest amounts, followed by maltose (). The following composition of basic sugars in bee pollen was determined to be: fructose 44–46%, glucose 35–37%, sucrose 8–30%,and maltose 5–10% of the total sugar content. Mono-, di- and trisaccharides furanose, arabinose, ribose, trehalose, isomaltose, turanose, kojibiose, gentiobiose, melibiose and melezitose accounted for about 1% (Aratchi et al., 2018; Serra-Bonvehí et al., Citation1986; Serra-Bonvehí & Escolá Jordá, Citation1997; Szczęsna, Citation2007; Szczęsna et al., Citation2002). The metabolome analysis of bee-collected pollen, especially myo-inositol (predominant physiologica form of six-carbon sugar alcohol) and pentose sugars (furanose) is useful in the study of plant-pollinators mutualism (Aratchi et al., 2018). Tetrasaccharide stachyose is also determined in pollen samples (Quian et al., 2008). The fructose-to-glucose ratio (F/G) of bee-collected pollen samples varies considerably from 1.01 in Brazil (Martins et al., Citation2011) to 2.51 in Poland (Szczęsna et al., Citation2002) (). The sugar content of pollen has not been normalized, and in fact only Poland, Switzerland and Argentina currently have a standard for it. The International Honey Commission proposes 4 g/100 g minimum sugar content for dried bee pollen (Campos et al., Citation2008). The HPLC technique with refractive index detection (RID) has generally been used for the determination of sugars in bee-collected pollen (Bobis et al., Citation2010; Mărgăoan et al., Citation2012; Martins et al., Citation2011; Szczęsna, Citation2007; Taha, Citation2015).
Table 46. Literature data on the content of sugars in bee pollen (g/100 g DM).
Table 47. Methods used to evaluate the vitamin content of bee pollen.
Table 48. Calibration curves obtained for echimidine, lycopsamine and intermedine.
11.2. Method for identification and quantification of sugars by HPLC-RID
11.2.1. Principle
This method is based on the procedure elaborated by Bogdanov et al. (Citation1997) for the determination of honey sugars and adopted by Szczęsna (Citation2007). Briefly, the sugars are extracted from pollen samples and then, determined by HPLC with a refractive index detector (RID) using a normal-phase column containing amine-modified silica gel with a 5–7 µm particle size. The analyzed sugars are: fructose, glucose, saccharose, maltose, turanose, trehalose, izomaltose, erlose, melezitose, and rafinose. The sugars are identified through the comparison of individual sugars' retention times of the reference and the analyzed solution. The quantitative assays are done by the external standard method comparing those sugars' peak surfaces.
11.2.2. Reagents
deionized water (18.3 MΩ).
methanol, acetonitrile for HPLC (J.T. Baker or comparable purity from another company).
analytical standards of: fructose, glucose, saccharose, maltose, turanose, trehalose, izomaltose, erlose, melezitose, rafinose (SIGMA-ALDRICH or comparable purity from another company).
Carrez solution I: 15 g of potassium hexacyanoferrate (II) trihydrate, K4Fe(CN)6 ·3H2O dissolved in 100 ml of deionized water.
Carrez solution II: 30 g of zinc acetate dihydrate, Zn(CH3COO)2·2H2O dissolved in 100 ml of deionized water.
11.2.3. Equipment
High Performance Liquid Chromatograph operated by computer software and equipped with: pump, degasser, autosampler, column-oven, and refractive index detector (RID).
amine-modified silica gel HPLC column with 5–7 µm particle size (250 × 4.6 mm × 5 µm) (Phenomenex or another company).
analytical balance.
mechanical shaker.
automatic dispenser.
analytical grade filter paper.
PVDF membrane filter, pore size 0.45 µm (Karl Roth or another company).
volumetric flask, 100 ml.
Eylenmeyer flask, 100 ml.
beaker, 50 ml.
autosampler vial.
11.2.4. Preparation of stock standard solution and working standard solutions of sugars
weigh each sugar to prepare a standard solution, with an accuracy of 0.001 g. Weights of individual sugars: (a) fructose: 1.000 g, (b) glucose: 0.750 g, (c) saccharose, maltose: 0.500 g, (d) turanose, trehalose, izomaltose, erlose, melezitose, rafinose: 0.075g.
dissolve the standard sugars in a small amount of deionized water and transferred quantitatively to a volumetric 100 ml flask. Add 25 ml of methanol with the use of an automatic dispenser, and poured into a volumetric flask up to the mark with deionized water.
filter the standard solution with 0.45 µm membrane filter and stored at −18 °C. A stock standard sugar solution kept at this temperature is stable for six months.
11.2.5. Sample preparation
weigh a pollen sample of 5 g ± 0.001 g and put into a 100 ml Eylenmeyer flask.
add about 40 ml of deionized water, 5 ml of Carrez solution I, and 5 ml of Carrez solution II and mix for 2 h at 30 °C using a mechanical shaker.
transfer the solution quantitatively to a 100 ml volumetric flask, add 25 ml of methanol and filled up to the notch, with deionized water.
filter the sample solution through qualitative filter paper into a beaker. The first 10 ml of the filtrate are discarded. The solution is passed through a 0.45 μm membrane filter into an autosampler vial and the filtrate injected in the HPLC-RID system.
11.2.6. HPLC-RID analysis
The HPLC system is run using computer software in the following conditions:
flow rate: 1.5 ml/min.
mobile phase: acetonitrile: water (80:20 V/V).
column and detector temperature: 30 °C.
injection volume: 20 µl.
After the HPLC System is stabilized, the working standard solutions of the sugars and then pollen sample are injected and analyzed under the same conditions. The external standard method is used to calculate the results using a calibration curve determine for three different concentrations of each sugar standard. The results are express as g/100 g to one decimal place.
11.3. Validation of the method
The method described above can be applied for routine analysis of fructose, glucose, saccharose, maltose, turanose, trehalose, izomaltose, erlose, melezitose, and rafinose in pollen samples. The detection limit, working range, linearity, repeatability and within-laboratory reproducibility were determined for this method. The detection limit was set at 0.2 g/100 g DM for fructose and glucose and at 0.5 g/100 g DM for saccharose, maltose, turanose, trehalose, izomaltose, erlose, melezitose, and rafinose. This procedure is used for the routine determination of sugars in pollen, in the range of: 5–40 g/100 g for fructose and glucose; 0.5–30 g/100 g for saccharose, maltose, trehalose, turanose, and isomaltose; 0.5–10 g/100 g for erlose, rafinose and melecytoze. The correlation coefficient of the linear dependence of sugar concentration and peak area in the working range, reached the value of over 0.995 for all the analyzed sugars. A series analysis for three pollen samples showed that the variation coefficient of the repeatability and the within-laboratory reproducibility of the elaborated method did not exceed 10% for fructose and glucose, and 20% for both other analyzed disaccharides (saccharose, maltose, turanose, trehalose, izomaltose) and trisaccharides (erloze, melezitose). Thus, sufficient accuracy and precision of the methods were demonstrated.
11.4. Application of the method
The results on the content of the sugars analyzed by the HPLC-RID method, in multifloral pollen samples originating from Poland, South Korea and China are presented Szczęsna, (Citation2007) in and show that the sugar content of pollen dry matter averages 40%. The fructose ranged from 9.74 to 22.06 DM, and the average was 15.94 g/100 g DM. The glucose content was lower by several g/100 g and ranged from 8.45 to 20.06 g/100 g; the average being 14.02 g/100 g DM. Of the tested disaccharides, saccharose occurred in the highest concentrations, ranging from 1.13 to 4.84 g/100 g DM; the average being 3.20 g/100 g DMmaltose followed ranging from 1.07 to 3.51 g/100 g DM; the average being 2.47 g/100 g DM. Those four sugars varied substantially within each of the samples. The variation was related to their botanical origin. In the majority of samples, the content of other such analyzed disaccharides as trehalose and turanose was at the detection limit of 0.2 g/100 g DM.
Bobis et al. (Citation2010), Martins et al. (Citation2011), Mărgăoan et al. (Citation2012) and Taha (Citation2015) used the same method as Szczęsna (Citation2007) to quantify the sugar content of sugars and confirmed the predominance of fructose followed by glucose in pollen samples (). Bobis et al. (Citation2010) found fructose and glucose to be on average at concentrations of 19.31 and 17.86 g/100 g, respectively. They investigated disaccharides were in similar quantities as those investigated by Szczęsna (Citation2007). Martins et al. (Citation2011) determined the fructose concentration to be ranged between12.59 and 23.62 g/100 g and the average 18.99 g/100 g, while the glucose concentration between 6.99 and 21.85 g/100 g and the average 14.89 g/100 g. According to Mărgăoan et al. (Citation2012), fructose content ranged between 8.44 and 15.39 g/100 g, and glucose content – between 4.37 and 16.14 g/100 g. The results received by Taha (Citation2015) for a few monofloral pollens (Cucurbita pepo Thunb, Phoenix dactylifera L., Helianthus annus L., Medicago sativa L., Brasica napus L.), showed that fructose content ranged from 17.13 g/100 g for rape (Brassica napus L.) pollen to 21.30 g/100 g for date palm pollen (Phoenix dacttylifera L.), and glucose content from 15.44 g/100 g for sunflower (Helianthus annus L.) pollen to 17.06 g/100 g for date palm (Phoenix dacttylifera L.) pollen.
With the above-described method, the Bee Products Quality Testing Laboratory, the Apiculture Division of the National Institute of Horticultural Research, Poland produced results for multifloral pollen samples were in the same range as the results received by the above-mentioned authors. Fructose content ranged between 15.40 and 22.54 g/100 g DM, 17.01 g/100 g DM, on average. Glucose content ranged between 10.42 and18.54 g/100 g DM, 14.01 g/100 g DM, on average. Saccharose content ranged between 2.80 and 7.40 g/100 g DM, with an average value of 5.70 g/100 g DM.
12. Standard method for vitamin analysis in bee pollen
12.1. Introduction
Bee pollen contains vitamins of B complex, vitamin C, E and carotenes with provitamin A function (alpha and beta-carotene) (Arruda et al., Citation2013a, Citation2013b; Melo et al., Citation2009; Melo & Almeida-Muradian, Citation2010; Oliveira et al., Citation2009; Sattler et al., 2015; Souza et al., Citation2018). Vitamins are classified in terms of solubility. The lipid-soluble vitamins (vitamins A, D, E and K) are a group of chemical substances with different structure which are soluble in organic solvents and are stored in the body fat, but can be toxic when consumed in excess. Water-soluble vitamins (vitamins B1, B2, B6, B12, folic acid, pantothenic acid, niacin, biotin and vitamin C) are not normally stored in significant amounts in the body, which leads to the need for a daily supply of these vitamins (Ball, Citation1998). Methods used to evaluate the vitamin content can be seen in .
12.2. B complex vitamins
12.2.1. Methods for B complex vitamins
Before vitamin analysis, it is necessary to determine the moisture content, so the results can be expressed in dry basis. From the current methods for moisture determination in dried bee pollen samples, the drying out process with infrared light at 85 °C and lyophilization is recommended (Melo & Almeida-Muradian, Citation2010, Citation2011). The following procedures are based mainly in the on the work of Arruda et al. (Citation2013a) and Arruda et al. (Citation2013b) and Souza et al. (Citation2018).
12.2.1.1. Simultaneous extraction of vitamins B1, B2, vitamers from vitamin B6 and niacin
For the simultaneous extraction of B vitamins, it is used an acid hydrolysis followed by enzymatic treatment with fungal diastase like this:
In an Erlenmeyer flask, approximately 5 g of dried bee pollen is mixed with 50 ml of HCl 0.1 mol/l and kept in boiling water bath for 30 min. After cooling to room temperature, the solutions have their pH adjusted to 4.6 with sodium acetate 2.5 M. After adding 0.5 g of the diastase (from fungi), the solutions are incubated for 2 h at 42 °C in a water bath. After the enzymatic treatment and cooling at room temperature, the solutions are transferred to 100 ml volumetric flasks; the volumes should be completed with deionized water, homogenized and filtered through filter paper and in 0.45-mm membrane for injection into the chromatographic system.
12.2.1.2. Chromatographic conditions for the analysis of the B complex vitamins in dried bee pollen
The chromatographic conditions vary for each vitamin. Vitamin B1 and B2 are analyzed under the same conditions, while vitamin B6 and PP are quantified in distinct conditions. Vitamins B2 and B6 are detected directly by fluorescence, while vitamins B1 and PP underwent pre- and post-column reaction, respectively, to be also detected by fluorescence.
12.2.1.3. Determination of thiamin (vitamin B1), with pre-column reaction
For the reaction of thiamin into thiochrome, 1 ml of standard solution is diluted from the sample extract is pipetted into 10 ml amber volumetric flasks, 2 ml of deionized water and 3 ml of freshly prepared alkaline potassium ferricyanide solution, [0.25% (w/v) in 15% NaOH]. The mixture is homogenized and put to rest for 2 min to allow the reaction. After this period, 450 ml of 85% orthophosphoric acid is added. The solution is then cooled, and the final volume is completed with deionized water. These solutions are filtered in a 0.45-mm membrane and injected into the chromatographic system immediately after preparation. For the separation, 20 ml is injected into a C18 reversed-phase column (RP-18 spherical 5 μmm/250 × 4.6 mm) with pre-column (5 μm/10 × 4.6 mm). The mobile phase is composed of phosphate buffer pH 7.2 (10 mM KH2PO4.3H2O) and dimethylformamide (85:15); flow rate: 1 ml/min and detection by fluorescence (Ex 368 nm; Em 440 nm).
12.2.1.4. Determination of riboflavin (vitamin B2)
20 ml is injected into C18 reversed-phase column (RP-18 spherical 5 μm/250 × 4.6 mm ) with pre-column μm/10 × 4.6 mm). The mobile phase is composed of phosphate buffer pH 7.2 (10 mM KH2PO4.3H2O) and dimethylformamide (85:15); flow rate of 1 ml/min and detection by fluorescence (Ex 450 nm; Em 530 nm).
12.2.1.5. Determination of vitamin PP through niacin and niacinamide vitamers
Vitamin PP is detected by fluorescence after reaction under ultraviolet (UV). For the separation, 20 ml is injected into C18 reversed-phase column (Luna C18, spherical 5 µm/250 × 4.6 mm) with pre-column (5 µm/2 × 8 mm). The mobile phase is composed of 0.07 M potassium dihydrogen phosphate, KH2PO4 solution (pH 4.5) of phosphate buffer of 75 mM hydrogen peroxide and 0.1% of 5 mM copper sulfate solution; flow: 1.5 ml/min; reactor composed of 12 m of tetrafluoroethylene (TFE) tuve (0.5 mm internal diameter, wrapped around a black lamp) that emits radiation from 300 to 400 nm; fluorescence detection (Ex 322 nm; Em 380 nm).
12.2.1.6. Determination of vitamin B6 through the vitamers pyridoxol, pyridoxal and pyridoxamine
For the separation, 20 ml is injected into a C18 reversed-phase column (LiChrospher1 100 RP-18 end-capped 5 µm/250 × 4.0 mm), with pre-column (5 µm/4 × 4 mm Lichrospher 100 RP-18). The mobile phase is composed of phosphate buffer pH 2.5 (39 mM KH2PO4) with ion pair (0.63 mM PIC 7) and acetonitrile (96:4); flow: 0.6 ml/min; detection by fluorescence (Ex 296 nm; Em 390 nm).
12.3. Methods recommended to analyze antioxidant vitamins of bee pollen
The following procedures are based mainly in the on the work of Melo and Almeida-Muradian (Citation2010, Citation2011) and Sattler et al. (Citation2013).
12.3.1. Determination of vitamin C
The method is a titrimetric method, based on the reduction of 2,6-dichlorophenol-indophenol (DCPIP) by ascorbic acid (also recommended by AOAC, Citation1995).
12.3.2. Determination of vitamin E
This vitamin is analyzed using high-performance liquid chromatography (HPLC) using silica column and fluorescence detector (Ex. 295; Em. 330); mobile phase: hexane/isopropyl alcohol (99:1); flow rate: 1.5 ml/min.
12.3.3. Determination of β-carotene (provitamin A)
This carotenoid, as well as other carotenoids can be analyzed using both open column chromatography (OCC) (Almeida-Muradian et al., Citation2005; Oliveira et al., Citation2009) or HPLC, using C18 column (25 cm, 5 um), diode array detection (450 nm); mobile phase: methanol, ethyl acetate, acetonitrile (70:20:10); flow rate: 1.2 ml/min.
12.4. Concluding remarks
Note that the dehydration process, which is favorable for the preservation of bee pollen and the increase of shelf life of the product, do not interfere in the content of complex B vitamins (p < 0.05). In general, it can be stated that the concentration of vitamins is dependent on storage time and not on the conditions in which the dry pollen is stored (p < 0.05). When stored at room temperature, vitamin C is rapidly lost, probably due to oscillations in temperature, and, after this initial sharp loss, it becomes quite stable during the storage process. In relation to vitamin E (Melo & Almeida-Muradian, Citation2010), the storage conditions do not account for drastic losses in its concentrations.
13. Standard methods for mineral and trace elements
13.1. Introduction
Insufficient data are available on the different composition and variability of minerals and trace elements in bee pollen between plant species. In each region, the collected bee pollen generally came from just a few spontaneous plant species and agricultural crops in each region play also an important role as pollen sources. Among the micronutrients vitamins, polyphenols and minerals are the more important for human well-being. Nevertheless, some minerals can be toxic if the intake is higher or over a long period, (e.g., Zn, Se, Mn and Mo). Others at excessive levels may exhibit high toxicity (Villanueva & Marquina, 2001; Serra-Bonvehí & Escolá Jordá, Citation1997; Yang et al, (Citation2014). According FAO (2001) the mineral elements can be classified as “nutritionally essential major elements” (e.g., Ca, Cl, K, Mg, N, Na, P and S), “nutritionally essential minor elements” (e.g., Fe, B, Br, I and Si) and those regarded as “toxic” at excessive levels and may exhibit toxicity (e.g., Zn, Se, Mn, Mo). Given the importance and variability of different minerals founded in bee pollen, Campos et al. (Citation2008) proposed the inclusion in label of bee pollen, for sale, additional information related to different constituents and also minerals, to complement the label and improve the value of the product.
13.2. Materials and methods
Usually the determination of mineral and trace elements on bee pollen is carried out on pollen ash, most frequently by atomic absorption. The main mineral is K (about 60% of total mineral content), Mg constitutes about 20%, and Na and Ca 10% (Szczęsna & Rybak-Chmielewska, Citation1998).
13.2.1. Sample preparation
According to the analytical method used, different sample preparations methodologies can be performed.
Method 1: for Flame and Electrothermal Atomic Absorption Spectrometry (Stanciu, Marghitas, Dezmirean and Campos, Citation2012).
weigh 2 g of pollen;
ash in a muffle furnace at 450 °C overnight;
digest by treating with hydrochloric acid 6 M (5 ml) and H2O2 (3 ml) and then evaporate;
dissolve with 25 ml nitric acid 0.1 M. A blank digest was also carried out;
Lanthanum nitrate [La(NO3)3x6H2O] were used as matrix modifier for the determination of potassium, calcium and magnesium.
Method 2: for flame atomic absorption spectrometry and analyzing honey and pollen (Grembecka & Szefer, Citation2013):
weigh 1 g (±0.0001 g);
treat with 9 ml 65% HNO3 and digest in an automatic microwave digestion system: 250 W, 48 s; 0 W, 48 s; 250W, 6 min 24 s; 400 W, 4 min; 650 W, 4 min;
cycle consists of five food samples and one blank sample (9 ml 65% HNO3);
every digested sample is dissolved in up to 10 ml deionized water.
Method 3 (Loper et al., Citation1980):
weigh 1g of pollen;
digest with alternate aliquots of concentrated nitric acid and hydrogen peroxide;
boil and dry at 130 °C until the residual ash will be white or light gray. Three cycles were sufficient;
taken up residues in dilute HCl and determine directly for Zn and Pb. For Mg, Ca and K analyses, samples are diluted 50–100 times to provide concentrations in the proper absorption range.
Method 4: for Inductively coupled argon plasma-atomic emission spectrometry (ICP-AES): Paulo et al. (Citation2012, Citation2014)
200 mg of dry bee pollen digest with a mixture of nitric acid (10% v/v) and hydrogen peroxide (30% v/v) at 100 °C in a block digestion system (Digiprep MS) until complete digestion (12 h).
final residue is dilute to 50 ml with nitric acid (10% v/v) and filter.
Method 5: Yang et al. (Citation2014)
1.0 g of digested bee pollen with 10 ml of concentrate nitric acid (65%) and 1 ml of hydrogen peroxide (30%) in a close polytetrafluoroethylene-stopper vessel for 8 h at 170 °C.
13.2.2. Methods of analysis
The methods that are usually used for mineral composition determination in food products were the Flame and Electrothermal Atomic Absorption Spectrometry and the inductively coupled plasma atomic emission spectroscopy with or without mass detector. However, some easier methods could be use if only the determination of calcium will be required. Kelina et al. (Citation2013) determine the concentration of calcium in bee pollen samples from Lambayeque – Peru using complexometric method. In this method 0.1 g of ash were used to adding a few drops of hydrochloric acid, the results being expressed as percentage on dry basis.
13.2.2.1. Flame and electrothermal atomic absorption spectrometry
Flame and Electrothermal Atomic Absorption Spectrometry is a very common method of food mineral analyses applied mostly for the determination of alkali and alkaline metals.
Equipment
(1) Device equipped with deuterium lamp for background correction and hallow-cathode lamps for each of the elements studied and air/acetylene flame (Stanciu et al., Citation2011, Citation2012). (2) Flame atomic spectrometric measurements (F-AES/AAS) using the optimal instrumental parameters for each element with the following wavelengths: 766.5 nm (K); 422.7 nm (Ca); 285.2 nm (Mg); 248.3 nm (Fe) and 213.9 nm (Zn). Good linearity for the method is observed and the calibration curves present a very good accuracy with an r2 ranged between 0.9990 and 0.9999.
Grembecka and Szefer (2013) analyzed the concentration of elements (Mg, Ca, K, Na, Zn, Cu, Fe, Cr, Co, Ni, Mn, Pb and Cd) in pollen and honey in an air–acetylene flame by AAS method using deuterium-background correction. These authors added Cs to samples, for Na and K determinations and standards as an ionization buffer at a concentration of 0.2%w/v. In the case of Ca and Mg measurements, La was used as a releasing agent at a concentration of 0.4%w/v.
13.2.2.2. Inductively coupled plasma atomic emission spectroscopy (ICP-AES) methods
Method I (Paulo et al., Citation2012, Citation2014):
All experiments were carried out using an inductively coupled plasma-optical emission spectrometry (ICP-OES- Activa M, Horiba Jobin Yvon), operating at 1000 W plasma power;
15 l min−1 plasma gas flow, 0.02 l min−1 nebulizer Air flow and 1.0 bar air pressure;
The analytical wavelengths (nm) were set of the following: Cd (228.802), Cr (205.571), Cu (327.395), Fe (259.940), Mn (257.611), Pb (283.305) and Zn (213.857);
Results expressed in mg.kg−1 on a dry weight basis.
Method II (Yang et al., Citation2014):
Plasma gas flow rate (Ar), 16 l.min−1;
auxiliary flux, 1.0 l.min−1;
nebulized pressure, 25 psi; sample flush time, 30 s; delay time, 30 s; solution uptake rate, 1.60 ml.min−1;
radio frequency, 27.12 MHz; power, 1.05 kW;
absorbance data for each element recorded at the following wavelengths: Al (λ = 308.2 nm), As (λ = 189.0 nm), Ca (λ = 317.9 nm), Cd (λ = 228.8 nm), Co (λ = 228.6 nm), Cr (λ = 283.5 nm), Cu (λ = 324.7 nm), Fe (λ = 259.9 nm), Ge (λ = 265.1 nm), Hg (λ = 184.9 nm), K (λ = 766.4 nm), Mg (λ = 279.5 nm), Mn (λ = 257.6 nm), Mo (λ = 202.0 nm), Na (λ = 589.5 nm), Ni (λ = 231.6 nm), P (λ =213.6 nm), Pb (λ = 220.3 nm), Se (λ = 196.0 nm) and Zn (λ = 213.8 nm);
Results expressed in micrograms per gram on a dry weight basis.
To be underlining that ICP-MS is a powerful, but expensive technique for determination of trace mineral. It is also used for other bee products too as honey, for example Caroli et al. (Citation1999), Madejczyk and Baralkiewicz (Citation2008) and Chudzinska and Baralkiewicz (Citation2011).
13.3. Concluding remarks
Some preliminary results from the composition of minerals in bee pollen can give a good idea of the amounts and the identification of the main of these compounds on this crude material. Still the information remains scarce relatively to different floral sources and in special correlating minerals and regions of the globe. The countries should do similar assays to collect the most data possible to validate the amounts and the contaminants as this content could be a bio-indicator of the environmental condition or pollutants.
The amount of minerals in bee pollen from the various data collected in the published papers can be found in . Stanciu et al. (Citation2012) analyzed pollen loads samples obtained by pollen traps installed in Apis mellifera (L.) hives located in the northwest and central counties of Transylvania area (Romania). These authors confirmed that the examined bee pollen is a natural source of nutritionally essential minerals and can contribute for a better balanced diet or for special therapeutic applications. In their work, the authors reported that the main macro elements were potassium (2483–7620 mg/kg), calcium (553–2798 mg/kg) and magnesium (3555–205 mg/kg), while the main microelements were iron (18.8–135 mg/kg) and zinc 18.8–60.5 mg.kg−1. Variations in the mineral levels of the analyzed monofloral bee pollens were due to differences in the floral origin.
Table 51. PAs which have not been previously reported from E. vulgare and E. cannabinum.
Table 50. MS/MS fragment ions for PA-N-oxides from E. vulgare or E. cannabinum.
Loper et al. (Citation1980) use similar methodology, with flame absorption spectrometry for mineral determination (e.g., Mg, Ca, K, Zn and Pb) in fresh pollen collected by hand from flowers, bee pollen removed from the bees’ legs and collected from the pollen traps from California. Potassium is the main compound in bee pollen. Highest values of potassium were reported by Stanciu et al. (Citation2011) in Salix sp. pollen (8686 mg/kg), in Helianthus annuus L. pollen (5421 mg/kg) and by Stanciu et al. (Citation2012) in Knautia arvensis (L.) (7619.57 mg/kg), in Onobrychis viciifolia Scop. (6748.72 mg/kg), Crataegus monogyna Jacq. (6224.17 mg/kg) and Inula helenium L. (6078.28 mg/kg), Taraxacum officinale Web. (2483.51 mg/kg), Carduus sp. (3865.27 mg/kg) and among others pollen samples analyzed.
Different authors reported different values for pollen potassium concentration, namely: 4000 mg/kg (Villanueva & Marquina, 2001), 5530 mg/kg (Somerville & Nicol, Citation2002), 2843–5976 mg/kg (Szczęsna, Citation2007) and 4950–5131 mg/kg (Salamanca et al., Citation2008) (). These results confirm the higher variability of pollen mineral composition related to the different origin of pollen. Calcium followed by magnesium were the next highest mineral content in pollen. All authors founded significant differences related to the higher concentration of potassium compared with the other minerals. Yang et al. (Citation2014) analyzed twelve common varieties of monofloral bee pollen collected from China’s main producing regions. On average the values obtained were the following: P 5946 mg/kg, K 5324 mg/kg, Ca 2068 mg/kg, Mg 1449 mg/kg, sodium 483 mg/kg, aluminum 129 mg/kg, iron 119 mg/kg, magnesium 70 mg/kg, zinc 45 mg/kg and cupper 17 mg/kg.
Paulo et al. (Citation2012) analyzing Cistus ladanifer L., Rubus ulmifolius Schott and Calluna vulgaris (L.) found different composition of micronutrients (Cu, Fe, Mn and Zn) in pollen related to different botanical origins but not from the same species in different region. These authors concluded that the determination of micronutrients could be suitable for the identification of botanical species. The contents of Cd, Pb, As and Hg were usually lower or not detected in pollen samples. In Campos et al. (Citation2008), the limits for this trace elements were Cd ≤ 0.1 mg/kg, Pb ≤ 0.5 mg/kg, As ≤ 0.5 mg/kg and Hg ≤ 0.03 mg/kg.
14. Standard methods for pyrrolizidine alkaloid profiling by UHPLC-HRMS
14.1. Introduction
Pyrrolizidine alkaloids (PAs) are secondary metabolites produced by some plants as defense mechanism against herbivores and phytophagous insects. They can occur as N-oxides or free-bases/tertiary PAs. In plants, the N-oxides are often found in higher concentrations as compared to the corresponding free-bases/tertiary PAs (Hartmann & Toppel, Citation1987; Hartmann & Witte, Citation1995). PA containing plant species mainly belong to the families of Boraginaceae (all genera), Asteraceae (mainly genera of Senecioneae and Eupatorieae), Fabaceae (mainly genus of Crotalaria) and Apocynaceae (Hartmann & Witte, Citation1995). PAs can get into bee products, such as honey and pollen, when bees collect nectar or pollen of PA containing plants. PAs have been detected in plant pollen (Boppré et al., Citation2005; Kempf et al., Citation2010). High concentrations of PAs have also previously been reported in bee collected pollen (Dübecke et al., Citation2011; Kempf et al., Citation2010) presenting a food safety concern for the consumers of pollen as a nutritional supplement. PAs are classified as esters of hydroxylated methyl pyrrolizidines, consisting of a necine base (1,2-saturated or unsaturated) and one or more necinic acids (Hartmann & Witte, Citation1995) (a,b). Esters of 1,2 unsaturated retronecine- and otonecine type PAs are toxic for humans and animals (Prakash et al., 1999; Rösemann et al., Citation2014). The structural diversity of more than 400 known PAs (Boppré, Citation2011; Kempf et al., Citation2011) represents an analytical challenge and no standardized method has been established so far to determine the PA content in bee products. Many PAs are difficult to quantify, due to the lack of standard materials.
Two main analytical approaches are commonly used: a sum parameter GC-MS method (Kempf et al., Citation2008, Citation2010, Citation2011) and a targeted LC-MS method allowing the individual identification of PAs and PA-N-oxides (Betteridge et al., Citation2005; Boppre et al., 2005; Kempf et al., Citation2011). The GC-MS method covers most PAs, except the otonecine-type PAs, but derivatization is required and structural information of the original PAs is lost. On the other hand, the targeted LC-MS method identifies individual PAs, but unknown PAs are not detected and the chromatographic separation of many PA isomers is also not easily obtained. To at least partially overcome these limitations, ultra-high pressure liquid chromatography coupled to high resolution mass spectrometry (UHPLC-HRMS) as a way to profile both known and unknown PAs can be used (Avula et al., Citation2015). Compared to conventional HPLC, UHPLC enables a more rapid separation with higher resolution and is more efficient at separating closely related molecules, e.g., positional isomers (Plumb et al., Citation2004). UHPLC relies on the use of smaller particles (sub-2µm) and instrumentations able to resist higher pressure, typically up to 1000 or 1500 bars. HRMS systems, such as time-of-flights (TOF) or electrostatic trap (OrbitrapTM) represent an attractive way to record data from UHPLC separation at high frequency and in a non-targeted manner. HRMS measures ions with high mass and spectral accuracies and allows for the determination of elemental compositions, which in turn may assist the identification of unknowns. Furthermore, recent instruments are fully compatible with quantitative or semi-quantitative analysis (Rochat, Citation2012). Here we describe a UHPLC-HRMS-based method for the profiling of PAs in plant pollen from Echium and Eupatorium species, which may be applied to other plant genera with minor adaptation.
14.2. Materials and methods
14.2.1. Equipment and chemicals
Steel-made forceps from A. Dumont (#0208-55-PO)
1.5 ml and 2 ml tubes from Eppendorf (#0030120086, #0030120094)
2 ml glass LC-MS tubes (screw top) from Kinesis (#KVP6112)
polystyrene Petri dishes (Ø 10 cm) from Greiner (#663102)
glass beads (Ø 2 mm) from Sigma-Aldrich
nitrile gloves (powder free) from Kimberly-Clark (#52003M)
Solvents: cyclohexane SupraSolv (#102817), methanol SupraSolv (#106011) and formic acid for Analysis Emsure (#100264) from Merck, Acetonitrile ULC/MS (#012041) and Water ULC/MS (#232141) from Biosolve
Standards: echimidine (CAS #520-68-3) and lycopsamine (CAS #10285-07-1) from Phytolab (#89553, #89726).
14.2.2. Collection of plant pollen from PA-containing plants
Two examples: collection of pollen from E. vulgare (Boraginaceae) and from E. cannabinum (Asteraceae).
14.2.2.1. Pollen collection from E. vulgare
Plant pollen from E. vulgare, located as blue/violet dust on the anthers of the flower can be collected using steel-made surgery forceps or using pure cyclohexane (a,b and ). Rainy days are not recommended for collection, since pollen can be washed out from the anthers.
Verify that most of the flowers are well developed and fully open.
Tightly bag the plants on the field with fine mesh nets to avoid the pollen harvest from insects (at least one day before the collection).
Spread a layer of paraffin around the lower part of the stem to avoid that non-flying insects are climbing the plant to collect pollen.
Plant pollen can be collected two days after bagging the plant and is stored at −20 °C until extraction. It is suggested to bring a cooler box container filled with dry ice on the field in order to place the freshly collected samples immediately on dry ice.
14.2.2.1.1. Collection with forceps
Wear nitrile gloves during the collection.
Using forceps, scratch the pollen from the surface of the anthers of the flowers, carefully avoiding PA contamination by the stamen tissues.
Collect the pollen using pre-weighed 1.5 ml tubes. Collect 1 mg of pollen in each tube.
Insert the forceps carefully inside the tube and release the pollen on the walls of the vial. Try to avoid any electrostatic charge of the tube that could compromise the collection.
14.2.2.1.2. Collection with cyclohexane
Remove the stamens from the flower.
Immerge the stamens in a pre-weighed LC-MS glass tube containing cyclohexane.
Shake the stamens delicately into the cyclohexane to release the pollen.
If possible, bring the tubes back to the laboratory to evaporate the cyclohexane under laminar-flow hood. Determine the weight of the dry pollen.
Store the dry pollen at −80 °C until extraction.
14.2.3. Pollen collection from E. cannabinum
Plant pollen from E. cannabinum ( and ), located along the stamens, can’t be collected using forceps due to the small dimensions of the tubular floral units (approximately 7 mm).
Figure 48. (a and b) Structure of a flower of E. vulgare.
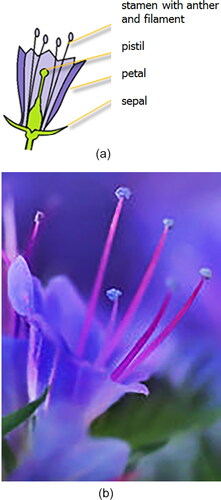
Figure 49. An E. vulgare plant bagged with a net and supported by a metal structure.
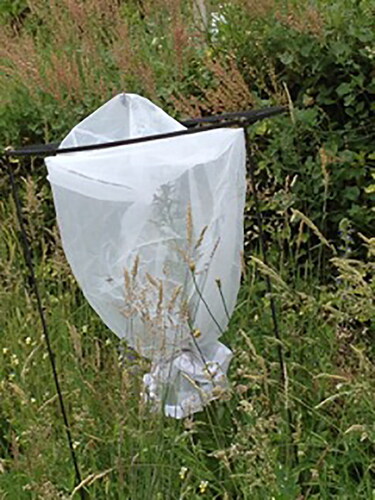
Figure 50. Structure of a floret and a floral head of E. cannabinum.
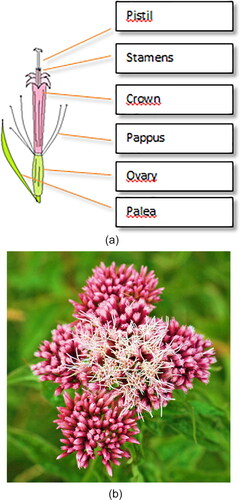
Figure 51. An E. cannabinum plant bagged with a net.
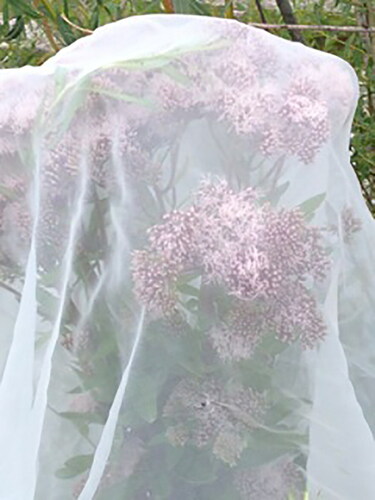
Figure 52. Extracted ion chromatograms of PAs identified in plant pollen of E. vulgare (A) and E. cannabinum (B). Peak numbers correspond to the PAs described in (1: echimidine-N-oxide; 2: vulgarine-N-oxide; 3: acetylechimidine-N-oxide; 4: acetylvulgarine-N-oxide; 5: echivulgarine-N-oxide; 6: lycopsamine; 7: intermedine; 8-9: lycopsamine-N-oxide or intermedine-N-oxide).
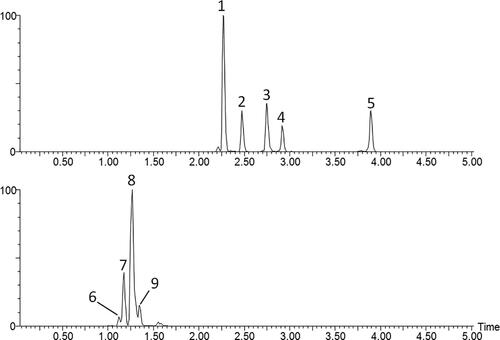
Collection on Petri dishes
Bag the plant and apply the paraffin layer on the lower part of E. cannabinum.
After two days, shake the entire floral head of E. cannabinum over a Petri dish in order to collect the pollen that is released by this procedure.
Remove the impurities from the dish using forceps.
Collect the pollen into a pre-weighted 1.5 ml tube.
Store the tube at −80 °C until extraction.
Pros: This method allows to collect rapidly a high amount of pollen from E. cannabinum.
14.3. Extraction of PAs from plant pollen
PAs are polar organic compounds with basic characteristics. They are soluble in polar organic solvents or in mixtures of solvents and acidified water.
Transfer 1 mg of plant pollen in a pre-weighed 2 ml microcentrifuge tube using a metal spatula.
Dissolve the pollen in 100 µl of extraction solvent consisting of 70% methanol, 29.5% ultra-pure water and 0.5% formic acid.
Add 4–8 glass beads to the tube.
Shake the tube at 30.0 Hz for 4 minutes.
Centrifuge the tube at 18,407 g for 4 minutes.
Collect the supernatant (extract) in a new tube.
Transfer with a pipette 5 µl of the extract and dilute 5–20 times with the extraction solvent into a glass LC-MS vial containing a conical glass insert.
Pros: This technique can be used for extracting plant pollen from many plant genera.
14.4. Profiling of PAs in plant pollen with UHPLC-HRMS
Non-targeted analysis using LC-HR-MS system allows the detection of alkaloids found in Echium vulgare (echimidine/-N-oxide, vulgarine/-N-oxide, acetyl-echimidine/-N-oxide, acetylvulgarine/-N-oxide and echivulgarine/-N-oxide) and alkaloids found in Eupatorium cannabinum (intermedine/-N-oxide, lycopsamine/-N-oxide). Separation of the alkaloids is performed using an Acquity UPLC (Waters). The UPLC system is coupled to a Synapt G2 QTOF mass spectrometer (Waters). An Acquity BEH C18 column (50 × 2.1 mm i.d., 1.7 µm particle size, Waters) fitted with guard column (5 × 2.1 mm) of identical phase is utilized. The column is maintained at 30 °C and a binary gradient of separation is performed at flow rate of 0.4 ml min−1. The mobile phase consists of 0.05% formic acid in water (solvent A) and 0.05% formic acid in acetonitrile (solvent B). The gradient program used is: 0–4 min 5–40% B, 4–6 min 40–100% B, 6–9 min 100% B, 9.1–10.5 min 5% B. Injection volume is 1 µl. The autosampler needle is washed with methanol/acetonitrile/isopropanol (1:1:1) followed by 0.05% formic acid in water between injections to eliminate carryover. The QTOF operates in electrospray positive mode over a mass range of 50–600 Da. MS conditions are: Capillary voltage +2800 V, cone voltage +30 V, source temperature 120 °C, desolvation gas temperature and flow 350 °C and 800 l/h, respectively, scan time 0.4 s. A leucine-enkephaline solution at 400 ng/ml is infused throughout the analysis to ensure high mass accuracy (<2 ppm). Fragmentation spectra are recorded in separate analyses in MSe mode using a collision energy ramp of 10–30 eV. Data are recorded using Masslynx 4.1 and PAs are identified on the basis of their retention times, exact mass fragmentation characteristics and comparison with the existing literature and databases containing information on PAs known in Echium and Eupatorium genus. External calibration for the quantification of the PAs is made using echimidine, intermedine and lycopsamine as standards. Five calibration points are made: 0.02, 0.1, 0.5, 2, and 10 µg/ml. Linear responses are obtained from 0.02 to 2 µg/ml (). The limit of detection (LOD) and limit of quantitation (LOQ) for echimidine, lycopsamine and intermedine are 1.5 ng/ml and 3 ng/ml, respectively. As only a limited number of reference standards are available, a number of other PAs and PA-N-oxides commonly found in Echium (echimidine-N-oxide, vulgarine/-N-oxide, acetyl-echimidine/-N-oxide, acetylvulgarine/-N-oxide, echivulgarine/-N-oxide) are indirectly quantified as echimidine equivalents. PAs and their PA-N-oxides and isomers in pollen of E. vulgare and E. cannabinum determined with LC-MS analysis are reported in . Two examples of extracted ion chromatograms of PAs are shown in .
Table 52. Frequency of each plant genus as predominant pollen, secondary pollen, important minor pollen and minor pollen in the 134 pollen samples mixture analyzed.
Table 49. Retention and mass characteristics of known Echium-type and Eupatorium-type PAs (free bases/-N-oxides and isomers).
Pollen samples of E. vulgare and E. cannabinum analyzed contain mainly PA-N-oxides while free bases were only present as traces. shows the MS/MS fragments of PA-N-oxides detected in pollen samples. In addition, PAs not previously reported to be present in pollen of E. vulgare and E. cannabinum can also be detected by UHPLC-HRMS. They are tentatively identified through the determination of their molecular formula based on high mass and spectral accuracy measurements by the high resolution QTOF mass spectrometer ().
14.5. Data processing
The following procedure is used for the detection and quantification of PAs. Provided that the identity of the PA is known, this procedure may also be applied to other types of alkaloids from other plant species.
To identify the different alkaloids, generate an extracted ion chromatogram (EIC) using a mass window of ± 0.01 Da around the values provided in .
Verify the mass accuracy of the ions compared to the theoretical values.
In the EICs integrate the peaks and calculate concentrations in ng/g or µg/g of pollen using your own calibration curves. Examples of equations are provided in .
In this study we obtained a total PA concentration of 7.43 (± 2.45) mg/g in pollen of E. vulgare and 5.32 (± 1.98) mg/g in pollen of E. cannabinum. Pollen samples were collected in Switzerland in 2013.
14.6. Concluding remarks
Liquid chromatography approaches are frequently chosen for the identification and quantification of PAs in plants and for food analysis, allowing the determination of individual PAs and PA-N-oxides. This is particularly important for determining the exact type of PAs which are present in a given plant species and also in food analysis, where the spectrum of PAs may help deduce the plant species that contribute to PA contamination. Additionally, the sample preparation is faster and does not need derivatization as required for gas chromatography analysis. However, many types of PAs are still not available on the market as reference substances. Therefore, a number of PAs are quantified using a reference substance that is closely related but not identical to the analyzed PAs. Hence, quantification may not be entirely accurate, since the response factor of the detector may differ between PAs, even when they are closely related to each other. Furthermore, positional isomers, such as lycopsamine and intermedine, are also not easy to separate. Finally, while some plant species have been relatively well characterized regarding their PA content (e.g., E. vulgare), little is known for many other PA-producing plant species. Recently, ultra-high performance liquid chromatography coupled with high resolution mass spectrometry has been described as a selective and sensitive method for the analysis of PAs in plants (Avula et al., Citation2015; Crews et al., Citation2009, Citation2010; Xiong et al., Citation2009). This method provides an accurate mass information based on which unknown PAs may also be detected in an untargeted manner without the need for reference standards for each PA, as has been shown in the present study. In the future we anticipate that UHPLC-HRMS will become the method of choice for the profiling of both known and unknown PAs in plants.
15. Standard methods for total phenolic compounds, total flavonoids and antioxidative capacity bee pollen evaluation by FTIR-ATR spectroscopy
15.1. Introduction
FTIR-ATR techniques have been applied in several different crud materials in order to simplify the analysis and have results quickly. Gok et al. (Citation2015) used FTIR-ATR spectroscopy in automated and highly sensitive botanical origin estimation of honey. According Anjos et al. (2017) FTIR-ATR spectroscopy technique in combination with partial least squares regression (PLS-R) can be used to evaluate the ability to quantify total phenolic compounds, total flavonoids, free radical scavenging (EC50) and antioxidant capacity (ABTS) in bee pollen. The method described in this chapter is based in this previously paper was PLS-Regression analysis was used to predicted for total phenolic compounds, total flavonoids, EC50 and ABTS. The calibrations model founded present a good accuracy for total phenolic compounds (r2 = 92.6%; RPD = 3.7), total flavonoids (r2 = 85.9%; RPD = 2.7); EC50 (r2 = 89.7%; RPD = 3.1) and ABTS (r2 = 91.3%; RPD = 3.4) of bee pollen).
15.2. Materials and methods
15.2.1. Sample characterization and preparation
The pollen samples are checked for the botanical origin based on the microscopic analysis, according the methodology described in Section 5.
For FTIR-ATR analysis a representative part of each samples are carefully homogenizing and reduce to a fine powder (). A small amount of sample is put in the apparatus with diamond solid ATR crystal properly mounter, and press against crystal (Anjos et al., 2017).
Figure 53. (a–d) Scheme of sample preparation for analysis in FTIR-ATR equipment.
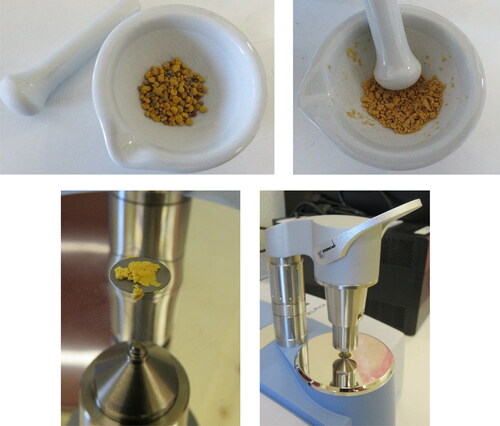
15.2.2. Reference analytical methods
15.2.2.1. Total phenolic and flavonoids content analysis
The total phenolic content of the extracts was determined using the Folin–Ciocalteu method as described by Moreira et al. (Citation2008). Total phenols content is expressed as mg of Galic Acid equivalents per g of bee pollen (GAEs).
For flavonoids contents the aluminum chloride method was used. Total flavonoids content is express as mg of catechin equivalents per g of bee pollen (CAEs).
15.2.2.2. Antioxidant activity analysis
The antioxidant activity was assessed by calculating the 2,2-diphenyl-1-picrylhydrazyl (DPPH*) free radical scavenging activity the trolox equivalent antioxidant capacity (ABTS) according the methodology proposed in Section 16.
The concentration of the extract that induced a 50% inhibition (EC50) was calculated from the graphic of the percentage effect of eliminating radicals as a function of the concentration of the sample extract solution.
For trolox results were expressed in millimol of equivalent trolox per gram of sample.
15.2.3. FTIR-ATR collection and data processing
The data acquisition and processing was described by Anjos et al. (2017). Pollen spectra are acquiring in a Bruker FTIR spectrometer with a resolution of 4 cm−1 in the wavelength region 4000–400 cm−1 (or similar) using a diamond single reflection attenuated total reflectance (ATR).
obtain a duplicate spectrum per sample, for example, with 32 scans per spectrum and calculate the average for each sample.
Note: A background measurement is made before each ten-sample analyzing using air. ATR crystal is carefully clean before and between each analysis with MilliQ water and isopropanol and the ATR crystal should be dried with soft tissue paper. All experiments are carried out at room temperature.
In a first screening all abnormal spectra are remove and if it was necessary a new sample spectra acquisition is performed.
PLS regression is done by using OPUS 7.5.18 BRUKER software. Firstly, the spectral data from the calibration samples are regress against the measured parameters and by means of full cross-validation with one sample omitted in order to obtain a significant number of PLS components (rank).
multiplicative scatter correction (MSC);
minimum maximum normalization (MinMax);
vector normalization (VecNor);
straight line subtraction (SLS);
constant offset elimination (ConOff);
first derivative (1stDer);
second derivative (2ndDer);
combination of the previously methods namely 1stDer + MSC, 1stDer + VecNor, 1stDer + SLS.
For PLS analysis models with no spectral data processing (None) are tested. All models can be calculated to a maximum rank of 10 and the results of the cross-validation test for the better values of coefficient of determination (r2), root mean square error of cross-validation (RMSECV) and ratios of performance to deviation (RPD) (Anjos et al., 2018).
15.3. Concluding remarks
These developed models have acceptable accuracy for the screening analysis for total phenolic compounds, total flavonoids and antioxidative capacity of bee pollen. They are fast and easy to handle and could give a good evaluation of the properties of bee pollen moisture available in the market. In the future is important produce more robust models with a higher number of samples, produced in different countries to have a better chemical characterization of the bee pollen to use in the labeling.
A total of 134 pollen samples mixture was analyzed and the frequency of each plant genus as predominant pollen, secondary pollen, important minor pollen and minor pollen is represented on . The variability of genus observed in all samples is given by the richness of floral resources of the region where the bee pollen samples were collected. In a higher amount of samples, the Cistus spp and Echium spp pollen were the predominant. As secondary pollen the Castanea spp pollen was the highest representative genus found in 34 samples, followed by the Cytisus spp, Eucalyptus spp, Cistus spp and Echium spp.
Castanea spp pollen was found in 60% of the samples from as Predominant pollen to minor pollen. The same distribution was observed for Cistus spp pollen that was presented in 61% of the analyzed samples.
The spectra for pollen are very similar, like it can be observed in , which shows the average spectrum of different types of analyzed samples. All the spectra analyses are characterized by bands between 1600 and 900 cm−1, which correspond to the signal characteristic of the phenols compounds and is due to the C-C and C-O vibration of phenolic and flavonoids compounds. An absorbance band appeared at 1632 cm−1, which could be assigned to the carboxyl group in asymmetric stretching, presented also in the honey samples (Anjos et al., Citation2015). The band from 3400 to 3000 cm−1 is usually associated to the water content in the samples because is due to OH groups but this groups are also important in the identification of phenolic compounds, alcohols and carboxylic groups and also the hydrogen vibration of amide N-H groups from olive wastewater samples (Droussi et al., Citation2009). The water content in this kind of samples usually varies between 6 and 8%. The other important bands that were observed in bee pollen samples are described in Anjos et al. (2017).
Figure 54. Average ATR spectrum of pollen samples.
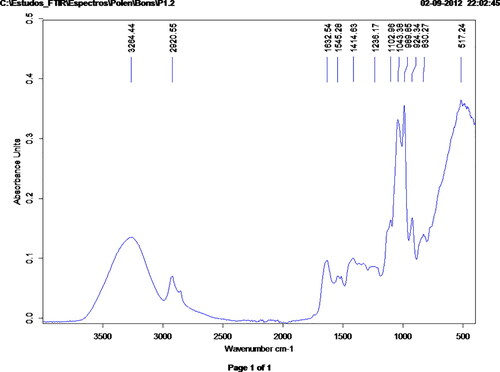
summarizes the statistical data for each parameter evaluated. The higher values of coefficient of variation denote the variability of data important for good model calibration. The samples data must be divided into two parts, one for calibration (30% to 50% of data) and the other for validation set (70% to 50% of data). PLS multivariate analysis was done with spectral data in order to obtain calibration models for each analyzed parameter in pollen samples. The calibration models determination of total phenolic compounds, total flavonoids and antioxidant capacity in pollen mixtures were developed based on the highest r2, lowest standard error of calibration and cross-validation, lower number of factors used in the calculation and higher residual prediction deviation. represents the results for optimal calibration established. Values of r2 for selected models were greater than 0.859 for calibration and greater than 0.72 for the Cross validation. The worst model founded was for the ABTS with a lower RPD for cross-validation. In calibration all models present values of RPD higher than 2.7. However, more accurate model could be obtained with more samples, from different regions and countries.
Table 53. Statistics of the 134 sample of bee pollen analyzed.
Table 54. Results for calibration and cross-validation.
16. Standard methods for determination of antioxidant bioactivity
16.1. Introduction
Bee pollen is considered as an important source of antioxidant flavonoids and phenolic acids for human consumption. Given the complex composition (view the first sections of this chapter), the natural variation of that composition, the storage conditions (Campos et al., Citation2003; Melo & Almeida-Muradian, Citation2010), the different ways to prepare the pollen extracts, and the different assay conditions to evaluate the antioxidant capacity, the determination and comparison of antioxidant capacity is difficult to assess. A great deal of methods for assessing the antioxidant capability of foods and beverages have been developed, and reviews on this topic have been published (Prior et al., Citation2005). In this section, a proposal for standardizing some methods to assess the antioxidant levels of bee pollen is done. As the antioxidant capacity varies with the type of oxidants, more than one assay is needed (Niki & Noguchi, Citation2000). - DPPH* free radical scavenging activity and the oxygen radical absorbance capacity (ORAC) methods are proposed for standardization of the routine assessment of bee pollen antioxidant capacity; the former because of its wide use in bee pollen, easiness of doing it, and good correlation with other assays like β-carotene bleaching (Morais et al., Citation2011) among others; and the second one because of it has been proposed to be considered for standardization for foods, botanicals, nutraceuticals, and other dietary supplements (Prior et al., Citation2005), and this would allow to compare this property between bee pollen and any other food.
16.2. Methods
16.2.1. 2,2-diphenyl-1-picrylhydrazyl (- DPPH*) free radical scavenging activity principle
- DPPH* is a stable organic nitrogen free radical. It has a spare electron, which being delocalized in the molecule, confers a deep violet color and makes the compound no capable to form dimers (Molyneux, Citation2004) neither reacts with oxygen (Ionita, Citation2005). In ethanolic or methanolic solutions, - DPPH* absorbs between 515 and 528 nm (Almaraz-Abarca et al., Citation2004; Molyneux, Citation2004; Sánchez-Moreno, Citation2002), but when it is mixture with a reducing substance, the reduced form of - DPPH* (- DPPH*-H, 2,2-diphenyl-1-picrylhydrazine) is formed (Ionita, Citation2005), then the deep purple color becomes to a pale purple and eventually, this becomes to a pale yellow. The wide range of maximum absorbance reported for the alcoholic - DPPH* solution indicates that the λmax must to be determined under a given set of particular conditions. Stoichiometric determinations have indicated that two moles of - DPPH* are reduced by one mole of water soluble vitamin E analogue (Trolox) (Leong & Shui, Citation2002), but the interaction of a potential antioxidant with - DPPH* depends on its structural conformation (Kaur & Kapoor, Citation2001). In a - DPPH* assay, this molecule represents the radical formed in a system suffering oxidation and the antioxidant to evaluate represents the reductant compound. Although the - DPPH* scavenging activity can be evaluated by electron spin resonance (Wasek et al., Citation2001; Yu, Citation2001), the evaluation of the absorbance reduction at 515 to 528 nm when in contact with a hydrogen donator compound by using visible spectroscopy, is the most common manner of evaluation. A quantitative estimation of the activity using visible spectroscopy is based on the registration of the differences between the initial concentration of - DPPH* in the reaction medium and its diminution with increased amounts of antioxidant.
The - DPPH* scavenging activity of one sample can be expressed as the percentage of - DPPH* free radical scavenging remaining in the reaction (EquationEquation (1)(1)
(1) ).
(1)
(1)
That manner has been used to express the - DPPH* scavenging activity in around 65.6% of reports concerning bee pollen. However, this activity can also be expressed in terms of the efficient concentration at 50% (EC50), defined as the amount of antioxidant needed for reducing by 50% the initial concentration of - DPPH*, the larger the EC50 the less efficient the antioxidant.
Sánchez-Moreno et al. (Citation1998) have proposed that besides the concentration of antioxidant, the reaction time to reach the plateau of the scavenging reaction should be taken in account for estimating this activity, according to EquationEquation (2)(2)
(2) . Results from quercetin evaluations suggest that the increasing in the reductor compound do not affect the time to reach the plateau (Campos, Citation1997).
(2)
(2)
where AE means the antiradical efficiency, EC50 the efficient concentration at 50% and TEC50 the time needed to reach the steady state with EC50.
As both - DPPH* and phenols are highly soluble in methanol and ethanol, the antiradical activity is evaluated in either of those solvents without apparent interference with the reaction; other solvents, like water and acetone seem to under estimate the extent of reduction (Guo et al., Citation2020). The use of buffered methanolic solutions has been reported for the evaluation of antiradical activity of bee pollen (Wang et al., Citation2010); that solvent can affect the estimation of IC50 in methanol and buffered methanol for antioxidants like BHT, but the effect is lower for phenolic antioxidants like propyl gallato, which bears several hydroxyl groups, being the IC50 values comparable in both kinds of solvents (Sharma & Bhat, Citation2009).
A great variation in the initial concentration of - DPPH* solution can be found in many reports of the antiradical activity. According to Molyneux (Citation2004), that concentration should be in the range of 50 to 100 µM in order to get solutions giving absorbance values less than 1, thus, observing the normal practice in spectrophotometry to reach accurate measurements. The range given by Sharma and Bhat (Citation2009) was 25 to 70 µM.
Concerning the stability of the - DPPH* solution, its spectrum (200 to 700 nm) did not reveal neither molecular nor quantitative alterations after eight hours in light (Campos, Citation1997). For longer periods, the free radical activity of the - DPPH* solution is reduced about 2 to 4% per week (Molyneux, Citation2004).
Among the disadvantage of - DPPH* assay are the reversibility of the initial step of the reaction (Bondet et al., Citation1997) and the fact of some substance, like proteins, most likely present in total extracts of plants, can precipitate in the alcoholic reaction medium (Sánchez-Moreno, Citation2002). Prior et al. (Citation2005) informed about the following three disadvantages of this assay, the not easy interpretation when the test compounds have spectra overlapping - DPPH* λmax; the overestimation of the activity for small molecules, having better access to the radical site (steric accessibility); and the inaccurate interpretation of the antioxidant activity for a given sample because - DPPH* solutions are decolorized by both reducing and hydrogen atom transfers. Contrary, among the advantage of the - DPPH* free radical scavenging activity are that it is a rapid method, does not have to be generated previously to the proper radical scavenging as in other assays, the compound is commercially available, the method is accurate and reproducible, and needs only a UV-Vis spectrophotometer or a colorimeter to perform. Also, - DPPH* assay is independent of sample polarity (Koleva et al., Citation2002). Besides, good correlations between this assay and TEAC (Mărghitaş et al., Citation2009) and with β-carotene bleaching assay (Morais et al., Citation2011) have been reported, meaning that - DPPH* test may represent a good approaching to evaluate the antioxidant activity for complex samples like bee pollen extracts.
There is a high correlation between the decreasing of DPPH* concentration and the increasing of flavonoid or phenolics concentration in the reaction medium (Almaraz-Abarca et al., Citation2004, Citation2006, Citation2008; Barriada-Bernal et al., Citation2014). However, a clear correlation between the DPPH* scavenging activity and the flavonoid or phenol concentration in different samples has not been found in all systems (Morais et al., Citation2011; Negri et al., Citation2011). This suggests that the types of phenolics present in a particular combination in a given sample are involved in the manifestation of the antioxidant properties.
Sánchez-Moreno (Citation2002) informed about a long list of compounds from different sources analyzed with the - DPPH* assay, which could be update with the reports concerning the bee pollen activity.
16.2.1.1. Variations in the - DPPH* assay for bee pollen
The main variations of the - DPPH* assay found in the several reports concerning bee pollen refer to the - DPPH* concentration of the solution used to carry out the analysis, reaction time, and the proportion of volume of - DPPH* solution related to volume of extract or sample to analyze (). Differences are also found in the form of expression of the activity. Under this situation important difficulties are to be faced when comparisons of scavenging activity of different bee pollen samples are done. Thus, the expression of the antiradical activity in terms of IC50 would represent a more accurate activity than the expression in terms of % activity, which is estimated at one extract concentration selected in an arbitrary manner and mentioned in the reports only in few cases.
Table 55. Condition variations of the DPPH* assay on bee pollen according to different authors.
16.2.1.2. Material and methods for - DPPH* assay
Prepare a solution of - DPPH* in ethanol or methanol (depending on the solubility of the compounds to be tested), and calculate the UV-Vis absorption that should be close to 1 (Absorption Unities – AU). The concentration of the free radical depends according to the method choose (see ).
Prepare a test solution with the sample. For bee pollen a ratio of 10 mg/ml of solvent can be used as a start point. After a preliminary assay, if needed, different concentration of the simple solution can be done.
Measure 1 or up to 4 ml of - DPPH* according to the method choose (see ) for at least 5 test tubes.
Add to each different concentration of the sample solutions and adjust with solvent for an equal final volume in each test tube. Example: 1 ml of - DPPH* solution + (50 µl extract + 950 µl of solvent), to complete a final volume of 1 ml.
Wait the time necessary for the complete reaction, according to the method choose (see )
Measure the absorption at 517 nm in the visible range with a spectrophotometric system.
Do a chart with the concentration of the sample and the respective consume of - DPPH*. Example: O µg of sample + 1 ml of - DPPH* correspond to 0.96 AU. These values correspond to zero activity. When the concentration of the sample increase (if active) the - DPPH* solution absorption decreases and then is possible to determine the concentration of the sample necessary to decrease this AU to 50% corresponding to the EC50.
Proceed as above utilizing a standard (ascorbic acid, trolox, various flavonoids or other polyphenols, depending of the simple under evaluation) for comparison of the results and to validate the accuracy of the assay.
16.2.2. Antioxidant capacity using ORAC (oxygen radical absorbance capacity) assay principle
The ORAC method measures the sequestrating capability of an antioxidant against the induced radical 2,2′-azobis(2-amidinopropane)dihydrochloride (AAPH) in reactions which are temperature sensitive; 37 °C is the most frequent temperature of assay. The radical reacts with a fluorescent compound forming a nonfluorescent product. The protector effect of antioxidant is estimated by calculating the area under a fluorescence decreasing curve over time, comparing with a reference substance, which is not an antioxidant. ORAC method was developed by Glazer (Citation1990), using phycoerythrin, but currently fluorescein and dichlorofluorescein are preferred because of their stability and less reactiveness (Prior et al., Citation2005). At present, ORAC assay is highly automated. Special plates of fluorometers are used. Arruda (Citation2013) used plate wells for 300 μl, and it was used for the external ones 300 μl of distilled water. Other holes were filled with 25 μl of phosphate buffer (blank) and the others with 25 μl of the extract dilutions. Then it was injected 150 μl of fluoresceine, waits for 30 minutes, and then injected 25 μl of the AAPH solution to initiate the reaction of peroxyl radical with the fluorescein (oxygen radical absorbance capacity). ORAC values are usually expressed as Trolox equivalents/g sample, then a standard curve using three to five concentrations of Trolox® (25 μl) vs. the fluorescence intensity is constructed. ORAC unit is equivalent of a protection against oxidation offered by a 1 µmol of Trolox. The fluorescence must be monitored every minute, using as work temperature 37 °C. It is used extinction wavelength at 493 nm (485/20 filter) and at 515 nm (filer 528/20) of emission. For calculation, it is used the sample area under the curve of the testing compounds minus the area of the blank. The same calculation is made for the Trolox curve. The area under the curve (AUC) is calculated after 30 minutes, when it is injected 25 μl of the AAPH solution to start the reaction, this delay in the starting of reaction avoids underestimation of antioxidant activity due to effects of secondary potential antioxidant products (Prior et al., Citation2005).
The area under the curve (AUC) is calculated using EquationEquation (3)(3)
(3) .
where fo = initial fluoresence at time zero; fi = fluorescence registration after i
At the beginning of the reaction kinetics there is a time in which the fluorescence is maintained, this is the lag phase, in it there is no consume of peroxide by fluorescent probe due to the presence of the antioxidants and consequently enhance the area under the curve. Prior et al. (Citation2005) consider that methods like ORAC, which measures the antioxidant capacity by AUC, take in account both inhibition time and degree; this gives a more accurate estimation of the action of an antioxidant than the methods which are based on the evaluation at a fixed time or inhibition degree.
16.2.2.1. Material and methods for antioxidant activity (ORAC) assay
The ORAC procedure recommended use an automated plate reader (Synergi HT, Bio TeK, USA) with 96-well plates (Arruda et al., Citation2013; Ou et al., Citation2001), as follows:
Conduct all the analyses in a pH 7.4 (75 mM) phosphate buffer at 37 °C under condition with a blank sample in parallel.
Dilute the extracts with sodium phosphate buffer (75 mM, pH 7.4). Peroxyl radical will generated using 2, 2′-azobis (2-amino-propane) dihydrochoride aqueous solution – that will be prepared for each run (153 mM). Fluorescein will be used as substrate (40 nM).
Program the ORAC analyzer to record the fluorescence of FL every minute after addition of AAPH. All fluorescent measurements express relatively to the initial reading. Fluorescence analysis conditions are performed as follows: excitation at 493 nm (filter 485/20) and 515 nm (filter 528/20). The standard curve must be linear between 6.25 and 100 µM Trolox®.
Calculate the final results using the differences of areas under the FL decay curves between the blank and a sample and express as µM TE/g bee pollen.
16.3. Concluding remarks
The great diversity of bee pollen that can be found worldwide, varying in the antioxidant capabilities, encourages to propose standard evaluations for this property, allowing a comparison among bee pollens from different geographical and botanical origins. Standards evaluations also would be useful for understanding the effects of several environmental factors on the antioxidant properties, and for monitoring bee pollen quality.
17. Standard methods for anti-inflammatory activities in bee pollen
17.1. Introduction
The inflammation process has been defined by several pathologists with different approach. Most pathologists would probably agree that inflammation represents a response of living tissue to local injury; that it leads to the local accumulation of blood cells and fluid (Ryan & Majno, 1977). Briefly, inflammation is a physiological response to the damage of tissues or cells that is caused by physical or biological agents and also free radicals involving different reactions intended to remove the cause and repair the damage (Bogdanov, Citation2015). Paulino et al. (2008) defined the inflammation as the process that involves production and/or release of mediators from neurons or damaged tissues, which are responsible for different responses including pain.
For determination of standard methods on anti-inflammatory activities much methodology in vitro and in vivo has been developed by several researchers worldwide. Recently Pascoal et al. (Citation2014) following the methodologies in vitro described by da Silva et al. (Citation2012), present a method based on the measurement of the inhibitory effect of bee pollen (BP) on the reactions catalyzed by hyaluronidase was evaluated.
17.2. Determination of standard methods
17.2.1. Anti-inflammatory activities of BP in vitro
17.2.1.1. BP extract preparation
For BP extract preparation the procedures described by Pascoal et al. (Citation2014) are described below regarding to the procedures.
17.2.1.1.1. Materials and reagents
BP sample(s).
Methanol (CH3OH).
Whatman filter paper No. 4.
Flasks.
Rotary vacuum evaporator.
17.2.1.1.2. Procedure
Note: The sample concentration and diluents used varies from the author to other:
BP and Methanol (MeOH) were mixed (1:2) (w/v).
Macerate for 72 h at room temperature.
Then, the solution was filtered by Whatman filter paper No. 4.
The solid residue was re-extracted.
Mix the two filtered into a flask, thus obtaining the methanol extracts of bee pollen.
Evaporate the extracts on a rotary evaporator at 45 °C for approximately 1h.
Finally, the dried extract of pollen was stored in the dark at room temperature, for further analysis.
17.2.1.2. BP sample preparation
17.2.1.2.1. Materials and reagents
BP extract.
Hyaluronidase enzyme (Type IV-S: bovine testes).
Calcium chloride (CaCl2).
Hyaluronic acid sodium salt.
Potassium tetraborate (K2B4O7·4H2O).
Water-bath.
p-dimethylaminebenzaldehyde (DMSO).
Spectrophotometer.
17.2.1.2.2. Procedure
Prepare BP extract concentrations [5mg/ml – 25 mg/ml] using dimethyl sulfoxide (DMSO) as solvent.
Prepare a mixture of 50 μl of BP’ extract and 50 μl (350 units) of hyaluronidase enzyme (Type IV-S: bovine testes).
Incubate at 37 ºC for 20 min.
Add 1.2 μl of calcium chloride (2.5 × 10⁻³ M/l) to activate the enzyme.
Incubate at 37 ºC for 20 min.
Add 0.5 ml of hyaluronic acid sodium salt (0.1 M/l) to start the reaction.
Incubate the mixture at 37 °C for 40 minutes.
Then add 0.1 ml of potassium tetraborate 0.8 M.
Incubate in boiling water bath for 3 minutes.
Place the mixture at 10 °C.
Add 3 ml of (DMSO).
Afterwards incubate at 37 °C for 20 minutes.
Measured the absorbance at 585 nm using water as control.
17.2.2. Anti-inflammatory activities of BP in vivo
17.2.2.1. BP extract preparation
For BP extract preparation the procedures described by Maruyama et al. (Citation2010) are suggest.
17.2.2.1.1. Materials and reagents
BP sample(s)
Ethanol (EtOH) and others.
17.2.2.1.2. Procedure
BP (200 g) extracted with water (Water BP) or 95% ethanol (EtOH BP).
Stir for 4 h at 60 °C (Water BP) or stir for 16 h (EtOH BP) at room temperature.
Take the filtrate to dryness and powdered.
The yields are stored for further use.
17.2.3. Animals
For the animal experimental protocol procedures, the Guide for the Care and Use of Laboratory Animals Eighth Edition (Citation2011) is suggested.
17.3. Concluding remarks
The high anti-inflammatory effects of BP compared to such nonsteroidal anti-inflammatory drugs as naproxen, analgin, phenylbutazone, or indomethacin also has been reported (Pascoal et al., Citation2014). The mechanism of the inflammatory effect is about inhibiting the activity of enzymes (cyclooxygenase and lipoxygenase) which are responsible for turning arachidonic acid into such toxic compounds as prostaglandin and leukotrienes, inducing acute and chronic inflammatory conditions in tissues. Flavonoids and phenolic acids are mainly responsible for such actions, but fatty acids and phytosterols also take part in this process (Akkol et al., Citation2010; Choi, Citation2007; Komosinska-Vassev et al., Citation2015; Pascoal et al., Citation2014). Kaempferol it is a compound present in BP and has been attributed ability to inhibit the activity of two enzymes: hyaluronidase, which is the enzyme catalyzing depolymerization of hyaluronic acid, and elastase, which hydrolyzes elastin, strengthens the connective tissue and seals blood vessels. This results in decreased transudates, inflammatory reactions and swellings. Blood circulations in the vessels improve and, therefore, skin becomes moistened and tight. Quercetin another flavonoid compound with several bioactivities as anti-inflammatory, antiedematous and analgesic action, may result by inhibiting the activity of histidine decarboxylase, lowers the histamine level in the organism (Kanashiro et al., 2007; Lee et al., Citation2009; Sahin et al., Citation2011). Studies done by Lee et al., Citation2009 in order to elucidated the anti-inflammatory activities of several subclass flavonoids such as the antioxidant property, inhibition of NO production, and inhibition of inflammatory enzymes (hyaluronidase, collagenase, LOX, and COXs), found that Kaempferol, quercetin, myricetin, and rutin inhibited hyaluronidase reaction, while apigenin, baicalin, and baicalein showed specific inhibition to collagenase reaction and catechin, which is flavon-3-ols-subclass, had suppressed both hyaluronidase and collagenase reaction. The degradation of the hyaluronic acid by the hyaluronidase enzyme may cause bone loss, inflammation and pain. As consequence, the determination of the hyaluronidase enzyme is an indirect way to assess the anti-inflammatory activity (da Silva et al., Citation2012). Choi (Citation2007) evaluated the antinociceptive and anti-inflammatory activity of pine (Pinus densiflora) pollen in mice. The antinociceptive activity was determined using acetic acid-induced abdominal constriction and formalin-induced licking, and the hot plate test and anti-inflammatory effects were evaluated using carrageenan and formalin-induced paw edema, and arachidonic acid-induced ear edema. The obtained results showed that ethanol extract of pine pollen (100 and 200 mg/kg) produced a significant inhibition of both phases of the formalin pain test in mice. Also, the pine pollen extract produced a significant inhibition of carrageenan and formalin-induced paw edema as well as arachidonic acid-induced ear edema in mice. These activities could be due to different polyphenols found in pine pollen related with antinociceptive and anti-inflammatory actions. Among other flavonoids, Chrysin has been reported as to possess anti-inflammatory activity, antioxidant properties and promotes cell death by perturbing cell cycle progression (Pichichero et al., Citation2011). Another studies developed by Maruyama et al. (Citation2010) in order to investigate the anti-inflammatory effect of bee pollen from Cistus sp. of Spanish origin by a method of carrageenan-induced paw edema in rats, and to investigate the mechanism of anti-inflammatory, found that the ethanol extract of bee pollen show a potent anti-inflammatory activity and its effect acts via the inhibition of nitric oxide (NO) production, besides the inhibitory activity of COX-2. Maruyama et al. (Citation2010) and, reported that some flavonoids found in plant foods included also in BP may partly participate in some of the anti-inflammatory action. Therefore, the anti-inflammatory effects of BP may be due to their flavonoids compounds as Kaempferol, quercetin, myricetin, and rutin that inhibit the inflammatory enzymes such as hyaluronidase, collagenase, LOX, and COXs, helping the retardation of inflammatory responses.
18. Standard methods for antimicrobial activities in bee pollen
18.1. Introduction
In order to investigate new antimicrobial agents from extracts of plants and other natural products to be used in pharmaceutical and cosmetic products, several methods have been developed by several researchers for evaluate the antibacterial and antifungal activity of the plant extracts. Nowadays, the most known assays have been based on diffusion in agar, macro and microdilution methods (Ostrosky et al., Citation2008). shows the advantages and disadvantages of these methods with references. Microdilution methods have been reported as the most widely used testing methods that use commercially marketed materials and devices, and the manual methods that provide flexibility and possible cost savings include the disk diffusion and gradient diffusion methods (Jorgensen & Ferraro, Citation2009). Some methods provide quantitative results and all provide qualitative assessments using the categories susceptible, intermediate or resistant. Also, it’s important to highlight that all of these methods have strengths and weaknesses, including organisms that may be accurately tested by the method; but in general way, these current testing methods provide accurate detection of common antimicrobial resistance mechanisms (Jorgensen & Ferraro, Citation2009).
Table 56. Advantages and disadvantages of some techniques and methods used for anti-microbial analysis.
Table 57. Summary of some antimicrobial effects of bee pollen.
According to the information available the diffusion in agar technique is widely used but problems associated with this have been reported. However, the Micro-dilution technique in microtiter plate (96 wells) has been proved to be quick provides reproducible results and was useful in screening plants for antimicrobial activity. All of these methods have been reported that each of them has strengths and weaknesses. Also, it is important to highlight that those methods are widely used in the worldwide by several researchers for antimicrobial activities determinations but sometimes suffer minor modifications (Estevinho et al., Citation2008).
18.2. Materials and methods
18.2.1. BP sample collection
Accordingly, with Morais et al. (Citation2011), for getting BP samples from beekeepers, the selected beehives were equipped with bottom-fitted pollen traps. After dried the BP, the samples were delivered to the Microbiology Lab, where they were stored in a dark place at room temperature (−20 °C) for further analysis.
18.2.2. Extract preparation of BP for antimicrobial analysis
Nowadays, many experiments in vitro and in vivo are performed with Pollen Methanolic Extracts (PME) and Pollen Ethanolic Extracts (PEE) to confirm its antimicrobial activity. According to the revised bibliography, once the pollen is received in the laboratories from beekeepers the methods for samples preparation commonly used are based on Methanol (MeOH) (Graikou et al., Citation2011; Kacániová et al., Citation2012; Pascoal et al., Citation2014) and Ethanol (EtOH) (Eswaran & Bhargava, Citation2014; Hleba et al., Citation2013; Kacániová et al., 2014) pollen extracts. In dependence of the final concentration desired, amounts of BP are weighted and dissolved in methanol or ethanol aqueous solutions. These methodologies have been used by several researchers with some modifications. The BP extracts could be prepared accordingly with Pascoal et al. (Citation2014) as described below regarding to the procedures:
The sample concentration and diluents used varies from the author to other.
Place the mixture under magnetic stirring at 150 rpm for 1h.
Filtration using Whatman No. 4 paper.
Repeat this procedure once more.
Mix the two filtered into a flask, thus obtaining the methanol extracts of BP.
Evaporate the extracts on a rotary evaporator at 45 °C for approximately 1h.
Keep extracts in dark and in refrigeration until their further use.
Preparing different sample concentrations using dimethyl sulfoxide (DMSO) as solvent.
18.2.3. Antimicrobial analysis by agar disk diffusion
18.2.3.1. Preparation of inoculum suspension
The preparation of inoculum could be accordingly with Matuschek et al. (Citation2014) with bit modifications as described below regarding to the procedures:
Inoculate the bacteria in broth of Muller Hinton Agar or Brain Heart Infusion Broth (BHIA); and Sabouraud dextrose Agar or potato dextrose agar for yeast.
Incubate for 18 to 24 hours for bacteria and 48 h for yeast.
Inoculate 3 to 4 colonies of bacteria in 5 ml Tryptic Soy Broth (TSB) and use Yeast Extract Peptone Dextrose (YPD) for yeasts.
Incubate at 37 °C for bacteria and 25 ºC for yeast until to reach an optical density 0.5 of Marc Farland standard, which is equivalent approximately from 1–2 × 10⁸ CFU/ml for bacteria and 1–5 × 10⁶ UFC/ml for yeasts.
Note: Alternatively, may prepare directly from the culture medium with agar 18 to 24 hours for bacteria and 48 hours for yeast, suspending the colony in saline or sterile nutrient broth until an optical density of 0.5 Marc Farland standard, to perform this step properly, either a photometric device should be used or, if done visually, adequate light is needed to visually compare the inoculum tube and the 0.5 Marc Farland standard against a card with a white background and contrasting black lines. For 0.5 Marc Farland standard preparations, see Cavalieri et al. (Citation2005) on page 220.
5. With swab, remove a small portion of inoculum is evenly spread on plates containing Muller-Hinton broth by passing the swab over the entire surface in three directions.
6. Let dry for 5 minutes.
7. Apply 10 µl of the antimicrobial solution on filter paper disks of 6 mm in diameter, at different concentrations to be tested.
8. Place the antibiotic disks on the agar surface using sterile forceps, by pressing the agar.
9. Let the plates 15 minutes at room temperature, in order to initiate diffusion of antibiotics.
10. Incubate the plate upside down at 37 °C for 18 to 24 hours.
11. Measure the diameter of the inhibition zones with a ruler. To facilitate the measurement, the plates should be placed in a dark background surface. shows the inhibition zone around the disk.
Figure 55. Inhibition zones around the disks.
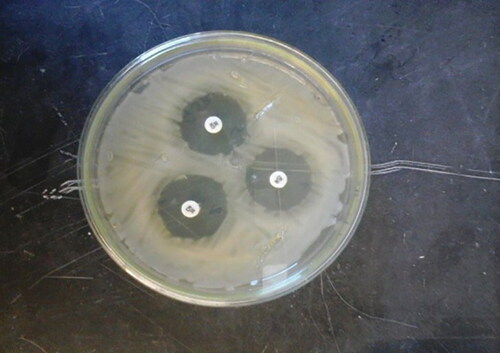
18.2.4. Antimicrobial analysis by agar well diffusion
18.2.4.1. Preparation of inoculum suspension
The preparation of inoculum could be accordingly with (Clinical and Laboratory Standards Institute (CLSI), Citation2012) with bit modifications as described below regarding to the procedures:
Please, see proceedings described in points 1 to 6 regarding to agar Disk diffusion, then, follow the next step.
Forming wells in the culture medium previously inoculated from 6 to 8 mm, with the aid of stainless-steel cylinders.
Fill the wells with 100 µl of the substances to be analyzed.
Incubate the plate upside down at 37 °C for 18 to 24 hours for bacteria and yeast to 25 °C for 48 h.
Measure the diameter of the inhibition zones with a ruler. To facilitate the measurement, the plates should be placed in a dark background surface.
Note: Use a positive control (may be an antibiotic) and a negative control (solvent used for dissolving the dry extract in different concentrations); The disks are positioned at 15 mm plate edge and widely separated from each other, so there is no overlap of zones of inhibition (approximately 20 mm). The pH of the culture medium should be between 7.2 and 7.4, and the recommended depth is approximately 4 mm (Barry & Thornsberry, Citation1991). shows the inhibition zone around the well diffusion.
Figure 56. Inhibition zone around the well diffusion.
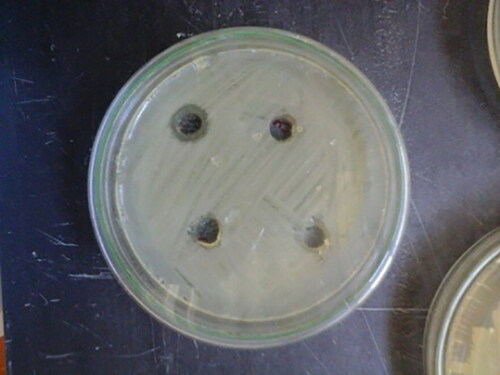
18.2.5. Antimicrobial analysis by micro-dilution in microtiter plate (96 wells)
18.2.5.1. Preparation of inoculum suspension
The preparation of inoculum could be accordingly with Cavalieri et al. (Citation2005) in Manual of Antimicrobial Susceptibility Testing, with bit modifications as described below.
Procedure
In sterile 96 well microplate, placing 200 µl of the sample (pollen extract) in the wells of the first column.
In wells 2 to 8 and 11 to 12 put 100 µl medium (nutrient broth), the wells 11 and 12 being the positive control.
In wells 9, 10 (negative control), putting 200 µl of medium.
Perform serial dilutions until the well 8.
Please, see proceedings described in points 1 to 4 regarding to agar Disk diffusion, then, follow the next step.
Then, within 15 minutes of adjusting the inoculum to the 0.5 Marc Farland turbidity standard, mix the suspension and dilute it so that the final concentration in each well is 5 x 10⁵ CFU/ml. Deliver 2.0 ml of the original suspension into 38 ml of water (1:20 dilution). From 1:20 dilution, prepare another 1:10 dilution that will be the inoculum.
Add 100 µl of inoculum in each well except for the columns 1, 9 and 10. Inoculate MIC panel carefully to avoid splashing from one well to another. Failure to adjust the inoculum and to dilute it within 15 minutes may adversely affect the concentration of organisms and test results.
Cover the microplate with a breathable film.
Incubate the yeast to 48 hours at 25 °C and the bacteria at 37 °C for 24 hours.
After this period, all wells except the first column, add 20 µL of TTC (2, 3, 5-triphenyl tetrazolium chloride) at 1%.
Incubate plates again for another 3 hours at 37 °C and 25 °C for bacteria and yeast, respectively.
Reading: See the color change (red/pink), indicating the reduction of TTC by microorganisms. The minimum inhibitory concentration (MIC) is defined as the lowest concentration of pollen extract that is capable of inhibiting visible growth, as indicated by TTC staining. shows the color change indicating the reduction of TTC by microorganisms in the wells of microplates.
Figure 57. Microtiter plate (96 wells), showing the color change indicating the reduction of TTC by microorganisms.
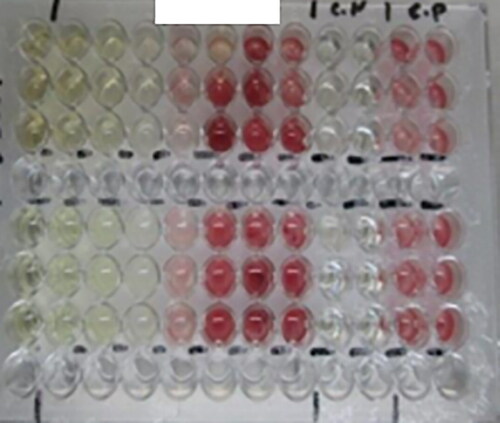
18.2.5.2. Calculating the lethal concentrations
After reading the microplates at 48 hours.
Seeding in plates (Mueller-Hinton agar for bacteria and Sabouraud for yeasts) in duplicate 20 µl of each of the wells in which there has been no microbial growth and the last in which growth was obtained.
Then mix thoroughly the contents of each well.
Once homogenized, inoculate 20 µl of each well in duplicate plates in their respective medium.
Incubate during 24 and 48 hours for bacteria and yeast respectively.
Then make counts.
If they are <10 or >10 CFU means that the substance has bactericidal and bacteriostatic activity, respectively.
18.3. Concluding remarks
The Agar well diffusion techniques () are used widely, problems associated with this technique are reported in ). Therefore, Morais et al. (Citation2011), Graikou et al. (Citation2011) and Pascoal et al. (Citation2014) used a Micro-dilution technique because is quick, worked well with Staphylococcus aureus, Enterococcus faecalis, Pseudomonas aeruginosa (P. aeruginosa), and Escherichia coli (E. coli) also this method gave reproducible results; provided a permanent record of the results and was useful in screening plants for antimicrobial activity (Eloff, Citation1998). Although BP has antimicrobial properties, it is important to highlight that these properties are depending on the type of pollen, concentrations applied and the inhibitions can occur against different species of bacteria and inhibition ratios can also vary (Carpes et al., Citation2007; Erkmen & Ozcan, Citation2008). For elucidate these affirmations, Campos et al. (1998) and Erkmen and Ozcan (Citation2008) in their studies when investigated the antibacterial activities of BP on some bacteria, yeasts and molds, the obtained results showed that, the used concentrations had no antimicrobial effect on the bacteria and fungi. Carpes et al. (Citation2007) in their studies found similar results as previously mentioned researchers. In general way the results obtained by all of cited researchers even if the methodologies applied were different showed that the Gram-negative bacteria were more resistant to the BP action than the Gram-positive bacteria, what may be related with the additional outer layer membrane, impermeable to most molecules, that consists of phospholipids, proteins and lipopolysaccharides (Silici & Kutluca, Citation2005).
19. Determination of standard methods for anti-mutagenic activities in bee pollen
19.1. Introduction
Some published studies, reported the beneficial effects of BP to human health such as the prevention of prostate problems (Shoskes, Citation2002) and tumors (Zhang et al., Citation1995). The increase of the of the large number of mutagens that has widespread in the world, led to researchers to investigate and discovering anti-mutagenic materials that limit and stop the harmful effects of mutations on the physiology of the organism. The most important of these materials has been reported as a plant extracts (Jaiswal et al., Citation2014). Over the past decade, some studies have lauded the anti-mutagenic properties of diverse beekeeping products, such as BP, propolis, honey mixtures and royal jelly, against the influence of some chemical and physical mutagens (Bariliak et al., Citation1996). Recently, studies done by Abdella et al. (Citation2009) and Tohamy et al. (Citation2014) when studied the protective efficiency of Egyptian BP extracts and propolis, treated mice with cisplatin [cis-diammine-dichloro-platinum(II)] (CDDP), observed that BP extracts presented potential chemoprotective against CDDP induced genotoxicity in mice by another side found that the chemoprotective frequency of BP extracts was much greater than propolis. Cisplatin (CDDP) is known as an inorganic platinum compound with a broad spectrum anti-neoplastic activity against different types of human tumors as testicular, ovarian, breast, lung, bladder, head and neck cancer (Khynriam & Prasad, Citation2003; Pabla et al., Citation2008; Siddik, Citation2003). The genotoxicity action of CDDP is due to its ability to bind with DNA, block and prolong the cell division in the G2 phase that is related to the inhibition of chromatin condensation (Aly et al., Citation2003). Bariliak et al. (Citation1996) when studied apiculture products (propolis, beebread, honey and queen bee milk) observed a chemoprotective effect of these beehive products against the influence of some chemical and physical mutagens. BP was able to reduce the chromosome damage induced by the three cancer drugs used, thus supporting their use as a chemoprotective agent (Shi et al., Citation2010).
19.2. Determination of standard methods for anti-mutagenic activities in BP
19.2.1. Preparation of BP extracts
Different methods for preparations of BP extracts have been reported (Carpes et al., Citation2007; Kaur et al., Citation2015; Pascoal et al., Citation2014; Pinto et al., Citation2010).
Procedure (according with Kaur et al., Citation2015).
The sample concentration and diluents used varies from the author to other.
Milling 1 g of pollen grains.
Homogenize with the help of needle in Petri dish.
Add 7.5 ml of 70% ethanol to the pollen mixture.
Keep at 70 °C for 1 h with agitation of 1 min after every 10 min interval.
Separate the supernatant.
Re-extract solid residue with 70% ethanol.
Repeat the process 3–4 times.
Group supernatants in a 25 ml conical flask.
The collected supernatant is considered as 100% extract.
Store these extracts at 5 °C till further analysis.
Prepare different concentrations viz., 25%, 50%, 75% and 100% of pollen extracts using double distilled water.
19.2.2. Anti-mutagenic activities in vitro
19.2.2.1. Materials and reagents
BP.
Ethyl methanesulfonate (EMS) and other chemicals.
Methanol (CH3OH) and ethanol (CH3CH2OH).
Folin–Ciocalteu reagent chloroform (CHCl3).
Sodium carbonate (Na2CO3).
Gentaminice and fluconazole.
Gallic acid and (+)-catechin.
The bovine testicular hyaluronidase (350 units).
Potassium salt of human umbilical cord hyaluronic acid.
The culture mediums.
The TTC solution (235-Triphenyl-2H-tetrazolium chloride).
High purity water (18 MX cm) and other chemicals.
19.2.2.2. Procedure
Yeast cells (D7 diploid strain of Saccharomyces cerevisiae ATCC 201137), according Pascoal et al. (Citation2014).
Prior to each experiment the S. cerevisiae D7 strain must be tested for the frequency of spontaneous convertants at the tryptophan (trp) locus and revertants at the isoleucine (ilv) locus.
Cells from a culture with low spontaneous gene conversion and reverse point mutation frequencies were grown in a liquid medium at 28 °C until they reached the stationary growth phase.
Yeast cells pelleted and re-suspended in a volume of 0.1 M sterile potassium phosphate buffer, pH 7.4, to obtain a final mixture of 2 × 10⁸ cell/ml.
The mixture (4 ml) contain 1 ml of cell suspension, potassium phosphate buffer and methanolic extracts of BP, in order to reach final concentrations of 0.00, 0.25, 0.50 and 0.75 mg/L.
Incubate the mixture under shaking for 2 h at 37 °C.
Cells are plated in complete and selective media to ascertain survival, trp convertants and ilv revertants.
Ethyl methanesulfonate (EMS), a mutagenic compound, is used as control.
19.2.3. Anti-mutagenic activities of BP in vivo
19.2.3.1. Materials and reagents
BP.
Cis-platin (CDDP) (cis-diamminedicholorplatinum).
Ethyl methanesulfonate (EMS) and other chemicals.
19.2.3.2. Experimental animals
For animal experimentation, we recommend to proceed according to the Guide for the Care and Use of Laboratory Animals Eighth Edition (Citation2011) in order to perform as per international ethical standards. The used animals are usually mice (Abdella et al., Citation2009; Tohamy et al., Citation2014).
19.2.3.3. Preparation of BP extracts
The preparation of BP extract can be according with Orsolić et al. (Citation2005), Yamaguchi et al. (Citation2007), Abdella et al. (Citation2009) and Tohamy et al. (Citation2014).
Procedure
BP (280 mg) was suspended in 10 ml of distilled water.
Mix vigorously.
Keep the suspension overnight in dark.
Centrifuge at 10,000 rpm in a cooling centrifuge for 45 minutes at 10 °C.
Collect and filtrate the supernatant fraction.
Keep the filtrated in freeze condition at −20 °C until use.
19.3. Concluding remarks on anti-mutagenic effects of BP
Studies published by Pinto et al. (Citation2010) suggest that some BP preparations could be employed as future chemoprotective and/or chemopreventive agents, especially for mammary or other estrogen-dependent cancers because in their studies found that at least one preparation of both species showed a marked anti-genotoxic effect against the action of tested anticancer drug. These anti-mutagenic properties of BP have been attributed to their composition rich in phenolic compounds that justify the higher protection (Pinto et al., Citation2010). This author also reported that the most effective species of BP from Salix alba in inducing inhibitory activity of E2 (17β-estradiol) and protected against the three mutagenic drugs and these results could be due its higher flavonoid content. Some of two studied samples were rich in luteolin, quercetin, chrysin, and kaempferol compounds that have been previously demonstrated to be antiestrogenic (Oh & Chung, Citation2006; Pinto et al., Citation2008; van Meeuwen et al., Citation2007), also exhibit anti-mutagenic and genotoxic activity (Lautraite et al., Citation2002; Nagy et al., Citation2009) whereas Galangin, pinocembrin and chrysin, as well as isorhamnetin 3-O-neohesperidoside, a derivative of isorhamnetin were proven to effectively contrast the DNA-damaging activity of several mutagens/carcinogens without exhibiting any genotoxic activity (Heo et al., Citation2001; Snyder & Gillies, Citation2002). Similar studies revealed that phenolic and flavonoids compounds as luteolin, chrysin, quercetin and taxifolin showed anti-mutagenic and genotoxic activity (Benkovic et al., Citation2008; Dutta et al., Citation2007; Makena et al., Citation2009; Uhl et al., Citation2003). Therefore, the anti-mutagenic effects, can be affected by total phenolic compound content as well as variation in their composition, and the higher phenolic compound content found in S. alba would justify the higher protection elicited toward the mutagenic drugs (Pinto et al., Citation2010).
The specific mechanism of protection of the BP extract is reported to involve the scavenging of potentially toxic and mutagenic electrophiles and free radicals and the modification of antioxidant pathways (Ohta et al., Citation2007). By another side, Nagy et al. (Citation2009) referred that the anti-mutagenic effect of most phenolic compounds could be clearly ascribed to their - DPPH* (1,1-diphenyl-2-picrylhydrazyl) scavenging activity, substitution patterns and lipophilicity. Barzin et al. (Citation2011) in their studies evaluated the anti-mutagenic effects of pollen grams of Phoenix dactylifera using Ames assay and found that had 46% anti-mutagenic response. According to Ames et al. (Citation1973, 1976) when the percent (46% of anti-mutagenic response), is more than 40, mutagenesis effect of the test sample is strong. Also, Bariliak et al. (Citation1996) observed the ability of apiculture products to decrease the mutagenic effects of some chemical and physical mutagens. In general way, the bioactivity of the pollens has been reported to be due to presence of compounds such as proteins, carbohydrates, amino acids, lipids, vitamins carotenoids, steroids, terpenes, flavonoids and polyphenols (Leja et al., Citation2007; Kao et al., Citation2020; Kroyer & Hegedus, Citation2001).
Acknowledgements
The COLOSS (Prevention of honey bee COlony LOSSes) Association aims to explain and prevent massive honey bee colony losses. It was funded through the COST Action FA0803. COST (European Cooperation in Science and Technology) is a unique means for European researchers to jointly develop their own ideas and new initiatives across all scientific disciplines through trans-European networking of nationally funded research activities. Based on a pan-European intergovernmental framework for cooperation in science and technology, COST has contributed since its creation more than 40 years ago to closing the gap between science, policy makers and society throughout Europe and beyond. COST is supported by the EU Seventh Framework Program for research, technological development and demonstration activities (Official Journal L 412, 30 December 2006). The European Science Foundation as implementing agent of COST provides the COST Office through an EC Grant Agreement. The Council of the European Union provides the COST Secretariat. The COLOSS network is now supported by the Ricola Foundation – Nature & Culture. are reproduced from Sawyer (Citation1981) with the permission of the publishers University College Cardiff Press and Northern Bee Books. Lidia Barreto and J Nordi wish to thank the Apiculture Research Center of Taubate University (UNITAU-SP/Brazil) and Agriculture Secretary of Bahia State (SEAGRI-BA/BRAZIL). Maria Campos wishes to thank (UI0204): UIDB/00313/2020, Center of Chemistry from Faculty of Sciences and Technology of University of Coimbra, Portugal. Ofélia Anjos wishes to thank to Forest Research Centre, a research unit funded by Fundação para a Ciência e a Tecnologia I.P. (FCT), Portugal (UIDB/00239/2020), and to Centro de Biotecnologia de Plantas da Beira Interior for the OPUS software availability. Norma Almaraz Abarca thanks to the Instituto Politecnico Nacional for financial and logistic support. Manuel Chica and Pascual Campoy wish to thank the APIFRESH project. APIFRESH has been co-funded by the European Commission under the R4SMEs 7th Framework Program. Olena Lokutova thanks the Austrian Institute of beekeeping, Dr H Pehhacker and the same members of the Institute H Hagel and E Hüttinger for conducting photo-microscopic studies and pollen analysis Ukrainian samples of pollen loads, which were the basis of the atlas of pollen “honey plants” of Ukraine. Olena is grateful also to Polish colleagues Z Warakomska (Department of Botany University of Lublin) and D Teper (Polish Institute of beekeeping) for their professionalism and consultations to determine the botanical origin of some Ukrainian honey. Also thanks to their scientific advisers’ academician G Bogdanov (National Academy of Agrarian Sciences of Ukraine), Prof. V Polishuk (Department of beekeeping National University of Life and Environmental Sciences of Ukraine) and O Martynyuk (M.G. Kholodny Institute of Botany, Kiev, Ukraine) for his helpful co-operation in the field of beekeeping and palinology. Janka Nozkova wishes to thank the Operational Program Research and Development of the European Regional Development Fund in the frame of the project “Support of technologies innovation for special bio-food products for human healthy nutrition” (ITMS 26220220115) and also by the Excellence Center for Agrobiodiversity Conservation and Benefit – project implemented under the Operational Program Research and Development financed by European Fund for Regional Development ITMS 26220120015 (Slovak Republic) and all colleagues from Institute of Biodiversity and Biosafety, Slovak University of Agriculture in Nitra for their help with image analysis. Ananias Pascoal, Georgina Tolentino and Letícia Estevinho would like to thank Fundação para a Ciência e Tecnologia (FCT), Programa Operacional Pontencial Humano (POPH) and European Union (EU) for his Postdoctoral grant SFRH/BPD/91380/2012. Wiebke Sickel, Markus Ankenbrand, Gudrun Grimmer, Frank Förster, Ingolf Steffan-Dewenter and Alexander Keller thank the financial support by the DFG Collaborative Research Center 1047, Insect Timing. MJA was further supported by a grant of the German Excellence Initiative to the Graduate School of Life Sciences of the University of Würzburg. They are grateful to the members of the Departments of Animal Ecology and Tropical Biology; Bioinformatics; and Human Genetics, University of Würzburg, for constructive input on the design of the workflow. Additionally thank to the Department of Human Genetics, especially S. Rost, for granting access to the Illumina MiSeq device. Živoslav Tešić, Mirjana Mosić, Aleksandar Kostić, Mirjana Pešić, Dušanka Milojković-Opsenica thank the Ministry of Education, Science and Technological Development of Serbia, Grants 172017 and TR 31069. Gina Tolentino would like to thank the Mountain Research Center (CIMO), Agricultural College of Bragança, Polytechnic Institute of Bragança for his research grant in the project titled " Development of new bee products in biological production way.”
Disclosure statement
No potential conflict of interest was reported by the authors.
References
- Abdella, E. M., Tohamy, A., & Ahmad, R.R. (2009). Antimutagenic activity of Egyptian propolis and bee pollen water extracts against cisplatin-induced chromosomal abnormalities in bone marrow cells of mice. Iranian Journal of Cancer Prevention, 2(4), 175–181.
- Abouda, Z., Zerdani, I., Kalalou, I., Faid, M., & Ahami, M. T. (2011). The antibacterial activity of Moroccan bee bread and bee-pollen (fresh and dried) against pathogenic bacteria. Research Journal of Microbiology, 6(4), 376. https://doi.org/http://dx.doi.org/10.3923/jm.2011.376.384
- Akkol, E. K., Orhan, D. D., Gurbuz, I., & Yesilada, E. (2010). In vivo activity assessment of a "honey-bee pollen mix" formulation. Pharmaceutical Biology, 48(3), 253–259. https://doi.org/https://doi.org/10.3109/13880200903085482
- Allen, G. (2006). An automated pollen recognition system [Master’s thesis]. Institute of information Sciences and Technology, Massey University.
- Almaraz-Abarca, N., Campos, M. d. G., Ávila-Reyes, J. A., Naranjo-Jimenez, N., Herrera-Corral, J., & Gonzalez, V. L. S. (2004). Variability of antioxidant activity among honey bee-collected pollen of different botanical origin. Interciencia, 29(10), 574–578. doi: 0378-1844/04/10/574-05.
- Almaraz-Abarca, N., Campos, M. D. G., Delgado-Alvarado, A., Ávila-Reyes, J. A., Naranjo-Jiménez, J. A., & Herrera Corral, H. (2006). Variación intrapoblacional en el Perfil Fenolico del polen de Stenocactus multicostatus subsp. zacatecasensis (Cactaceae). Boletín Nakari, 17(3), 59–64.
- Almaraz-Abarca, N., Campos, M. G., Ávila-Reyes, J. A., Naranjo-Jiménez, N., Herrera Corral, J., & González-Valdez, L. S. (2007). Antioxidant activity of polyphenolic extract of monofloral honey bee – collected pollen from mesquite (Prosopis juliflora, Leguminosae). Journal of Food Composition and Analysis, 20(2), 119–124. https://doi.org/https://doi.org/10.1016/j.jfca.2006.08.001
- Almaraz-Abarca, N., Campos, M. G., Delgado-Alvarado, A., Ávila-Reyes, J. A., Naranjo-Jiménez, N., Herrera Corral, J., Tomatas, A. F., Almeida, A. J., & Vieira, A. (2007). Fenoles del polen de Stenocactus, Echinocereus y Mammillaria (Cactaceae). Polibotanica, 23, 37–55. http://www.herbario.encb.ipn.mx/pb/pdf/pb23/3Fenoles.pdf
- Almaraz-Abarca, N., Campos, M. G., Delgado-Alvarado, E. A., Ávila-Reyes, J. A., Herrera-Corral, J., González-Valdez, L. S., Naranjo-Jiménez, N., Frigerio, C., Tomatas, A. F., Almeida, A. J., Vieira, A., & Uribe-Soto, J. N. (2008). Pollen flavonoid/phenolic acid composition of four species of Cactaceae and its taxonomic significance. American Journal of Agricultural and Biological Science, 3(3), 534–543. https://doi.org/https://doi.org/10.3844/ajabssp.2008.534.543
- Almaraz-Abarca, N., González-Elizondo, M. S., Campos, M. G., Ávila-Sevilla, Z. E., Delgado-Alvarado, E. A., & Ávila, R. J. A. (2013). Variability of the foliar phenol profiles of Agave victoriae-reginae complex (Agavaceae). Botanical Sciences, 91(3), 295–306. https://doi.org/https://doi.org/10.17129/botsci.9
- Almaraz-Abarca, N., Rivera-Rodríguez, D. M., Arráez-Román, D., Segura-Carretero, A., Sánchez-González, J. J., Delgado-Alvarado, A., Ávila-Reyes, J. A. (2013). Los fenoles del polen del género Zea. Acta Botanica Mexicana, 105, 59–85. http://www.ibiologia.unam.mx/sociedad/www/pdf/BSBM91_3/Almaraz-Abarca_91_3_295-306.pdf
- Almeida-Muradian, L. B., Arruda, V. A. S., & Barreto, L. M. R. C. (2012). Manual de Controle de Qualidade do Pólen Apícola (p. 28). APACAME.
- Almeida-Muradian, L. B., Pamplona, L. C., Coimbra, S., & Barth, O. M. (2005). Chemical composition and botanical evaluation of dried bee pollen pellets. Journal of Food Composition and Analysis, 18(1), 105–111. https://doi.org/https://doi.org/10.1016/j.jfca.2003.10.008
- Aly, M. S., Ashour, M. B., EL-Nahas, S. M., & Abo Zeid, M. A. F. (2003). Genotoxicity and cytotoxicity of the anticancer drugs gemcitabine and cisplatin, separately and in comination: in vivo studies. Journal of Biological Sciences, 3(11), 961–972. https://doi.org/https://doi.org/10.3923/jbs.2003.961.972[Mismatch] .
- Ambruster, L., & Oenike, G. (1929). Die pollenformen als mittel zur honig herkunftsbestimmung (p. 116). Wachholtz.
- Ames, B. N., Durston, W. E., Yamasaki, E., & Lee, F. D. (1973). Carcinogens are mutagens: A simple test system combining liver homogenates for activation and bacteria for detection. Proceedings of the National Academy of Sciences of the United States of America, 70(8), 2281–2285. https://doi.org/https://doi.org/10.1128/AAC.04918-14.
- Andrada, A. C., & Telleria, M. C. (2005). Pollen collected by honey bees (Apis mellifera L.) from south of Caldén district (Argentina): Botanical origin and protein content. Grana, 44(2), 115–122. https://doi.org/https://doi.org/10.1080/00173130510010459
- Anjos, O., Campos, M. G., Ruiz, P. C., & Antunes, P. (2015). Application of FTIR-ATR spectroscopy to the quantification of sugar in honey. Food Chemistry, 169, 218–223. https://doi.org/https://doi.org/10.1016/j.foodchem.2014.07.138
- Anjos, O., Santos, A. J. A., Dias, T., Estevinho, L. M. (2017). Application of FTIR-ATR Spectroscopy on the bee pollen characterization. Journal of Apicultural Research, 56(3), 210–218. https://doi.org/https://doi.org/10.1080/00218839.2017.1289657
- Anjos, O., Santos, A. F. A., Paixão, V., Estevinho, M. L. (2018). Physicochemical Parameters of Lavandula spp. honey accessed by FT-RAMAN. Talanta, 178, 43–48. https://doi.org/https://doi.org/10.1016/j.talanta.2017.08.099
- Ankenbrand, M. J. (2015). The ITS2 Database V – Twice as much. Molecular Biology and Evolution, 32, 3030–3032.
- AOAC. (1995). Official methods of analysis (16th Ed.). Association of Official Analytical Chemists.
- Arroyo, J., Devesa, J. A., Herrera, P., Ortiz, P. L., & Lozano, S. T. (1986). Resumen del proyecto de investigación: La flora melitófila en Andalucía occidental. Vida Apícola, 18, 33–39.
- Arruda, V. A. S. (2013). Dried bee pollen: Physicochemical, microbiological quality, phenolic and flavonoid compounds, antioxidant activity and botanical origin [PhD thesis]. Pharmaceutical Science School, University of São Paulo.
- Arruda, V. A. S., Freitas, A. S., B., O. M., Estevinho, L. M., & Almeida-Muradian, L. B. (2013). Propriedades biológicas do pólen apícola de coqueiro, coletado na Região Nordeste do Brasil. Magistra, 25, 1–6.
- Arruda, V. A. S., Santos Pereira, A. A., de Freitas, A. S., Barth, O. M., & de Almeida-Muradian, L. B. (2013b). Dried bee pollen: B complex vitamins, physicochemical and botanical composition. Journal of Food Composition and Analysis, 29(2), 100–105. https://doi.org/https://doi.org/10.1016/j.jfca.2012.11.004
- Arruda, V. A. S., Santos Pereira, A. A., Estevinho, L. M., & de Almeida-Muradian, L. B. (2013a). Presence and stability of B complex vitamins in bee pollen using different storage conditions. Food and Chemical Toxicology, 51, 143–148. https://doi.org/https://doi.org/10.1016/j.fct.2012.09.019
- Avula, B., Satyanarayanaraju, S., Wang, Y., Zweigenbaum, J., Wang, M., & Khan, I. A. (2015). Characterization and screening of pyrrolizidine alkaloids and N-oxides from botanicals and dietary supplements using UHPLC-high resolution mass spectrometry. Food Chemistry, 178, 136–148. https://doi.org/https://doi.org/10.1016/j.foodchem.2015.01.053
- Balkanska, R. G., Ignatova, M. M. (2012). Chemical composition of multifloral bee pollen from Bulgaria. In Proceedings of 6th Central European Congress on Food, CE Food 2012 (pp. 375–378).
- Ball, G. (1998). Bioavailability and analysis of vitamins in foods. Chapman & Hall.
- Baltrušaitytė, V., Venskutonis, P. R., & Čeksterytė, V. (2007b). Radical scavenging activity of different floral origin honey and beebread phenolic extracts. Food Chemistry, 101(2), 502–514. https://doi.org/https://doi.org/10.1016/j.foodchem.2006.02.007
- Barbosa, S. I. T. R., Silvestre, A. J. D., Simões, M. M. Q., & Estevinho, M. L. (2006). Composition and antibacterial activity of the lipophilic fraction of honey bee pollen from native species of Montesinho Natural Park. International Journal of Agricultural Research, 1(5), 471–749.
- Bariliak, I. R., Berdyshev, G. D., & Dugan, A. M. (1996). The antimutagenic action of apiculture products. The Journal of Cytology and Genetics, 30, 48–55.
- Barreto, L. M. R. C. (2004). Pólen Apícola: beneficiamento, armazenamento e legislação. Botucatu, 2004, 150 (Tese Doutorado) – Faculdade de Medicina Veterinária e Zootecnia – Universidade Estadual Paulista.
- Barreto, L. M. R. C., Dib, A. P. S., & Peão, G. F. R. (2006). Higienização e Sanitização da Produção Apícola (p. 150). Cabral Editora e Livraria Universitária.
- Barreto, L. M. R. C., Funari, S. R. C., Orsi, R. O., & Dib, A. P. S. (2006). Produção de Pólen no Brasil (p. 100). Cabral Editora e Livraria Universitária.
- Barriada-Bernal, L. G., Almaraz-Abarca, N., Delgado-Alvarado, E. A., Gallardo-Velázquez, T., Ávila-Reyes, J. A., Torres-Morán, M. I., González-Elizondo, M. d. S., & Herrera-Arrieta, Y. (2014). Flavonoid composition and antioxidant capacity of the edible flowers of Agave durangensis (Agavaceae). Cyta – Journal of Food, 12(2), 105–114. https://doi.org/https://doi.org/10.1080/19476337.2013.801037
- Barry, A. L., & Thornsberry, C. (1991). Susceptibility tests: Diffusion test procedures. In A. Balows, W. J. Hauser, K. L. Hermann, H. D. Isenberg, & H. J. Shamody (Eds.), Manual of clinical microbiology (Vol. 5, pp. 1117–1125). American Society for Microbiology.
- Barth, O. M. (2004). Melissopalynology in Brazil: A review of pollen analysis of honeys, propolis and pollen loads of bees. Scientia Agricola, 61(3), 342–350. https://doi.org/https://doi.org/10.1590/S0103-90162004000300018
- Barth, O. M., Freitas, A. S., Oliveira, E. S., Silva, R. A., Maester, F. M., Andrella, R. R., & Cardozo, G. M. (2010). Evaluation of the botanical origin of commercial dry bee pollen load batches using pollen analysis: A proposal for technical standardization. Anais da Academia Brasileira de Ciencias, 82(4), 893–902. https://doi.org/https://doi.org/10.1590/s0001-37652010000400011
- Barzin, G., Entezari, M., Hashemi, M., Hajiali, S., Ghafoori., & Gholami, M. (2011). Survey of Antimutagenicity and Anticancer effect of Phoenix dactylifera pollen grains. Advances in Environmental Biology, 5(12), 3716–3718.
- Basim, E., Basim, H., & Ozcan, M. (2006). Antibacterial activities of Turkish pollen and propolis extracts against plant bacterial pathogens. Journal of Food Engineering, 77(4), 992–996. https://doi.org/https://doi.org/10.1016/j.jfoodeng.2005.08.027
- Bassi, E. A. (2000). Programa de qualidade total na produção de mel. In: Congresso brasileiro de apicultura, 13, 2000. Sonopress. 1CD.
- Basuny, A. M., Arafat, S. M., & Soliman, H. M. (2013). Chemical analysis of olive and palm pollen: Antioxidant and antimicrobial activation properties. Herald Journal of Agriculture and Food Science Research, 2(3), 091–097.
- Bell, K. L., Burgess, K. S., Botsch, J. C., Dobbs, E. K., Read, T. D., & Brosi, B. J. (2019). Quantitative and qualitative assessment of pollen DNA metabarcoding using constructed species mixtures. Molecular Ecology, 28, 431–455. https://doi.org/https://doi.org/10.1111/mec.14840.
- Benkovic, V., Knezevic, A. H., Dikic, D., Lisicic, D., Orsolic, N., Basic, I., Kosalec, I., & Kopjar, N. (2008). Radioprotective effects of propolis and quercetin in gamma-irradiated mice evaluated by the alkaline comet assay. Phytomedicine, 15(10), 851–858. https://doi.org/https://doi.org/10.1016/j.phymed.2008.02.010
- Bertoncelj, J., Polak, T., Kropf, U., Korošec, M., & Golob, T. (2011). LC-DAD-ESI/MS analysis of flavonoids and abscisic acid with chemometric approach for the classification of Slovenian honey. Food Chemistry, 127(1), 296–302. https://doi.org/https://doi.org/10.1016/j.foodchem.2011.01.003
- Bessonov, V. N. (1992). Status of pollen as an indicator of pollution by heavy metals. Ecology. – Ekaterinburg, 1992(3), 45–50. (Article in Russian).
- Betteridge, K., Cao, Y., & Colegate, S. M. (2005). Improved method for extraction and LC-MS analysis of pyrrolizidine alkaloids and their N-oxides in honey: Application to Echium vulgare honeys. Journal of Agricultural and Food Chemistry, 53(6), 1894–1902. https://doi.org/https://doi.org/10.1021/jf0480952
- Biesaga, M., & Pyrzynska, K. (2009). Liquid chromatography/tandem mass spectrometry studies of the phenolic compounds in honey. Journal of Chromatography. A, 1216(38), 6620–6626. https://doi.org/https://doi.org/10.1016/j.chroma.2009.07.066
- Biodiversity International. (2007). Guidelines for the development of crop descriptor lists. Biodiversity Technical Bulletin Series (xii + 72 pp.). Biodiversity International.
- Bobis, O., Marghitas, L., Al, Dezmirean, D., Morar, O., Bonta, V., & Chirila, F. (2010). Quality parameters and nutritional value of different commercial bee products. Bulletin UASVM Animal Science and Biotechnologies, 67(1-2), 91–96.
- Bogdanov, S. (2015). Pollen: Production, nutrition and health: A review. Bee Product Science. www.bee-hexagon.net
- Bogdanov, S., Martin, P., & Lüllmann, C. (1997). Harmonized methods of the European Honey Commission. Determination of sugars by HPLC. Apidologie, 28, 42–44.
- Bondet, V., Brand-Williams, W., & Berset, C. (1997). Kinetics and mechanisms of antioxidant activity using the DPPH* free radical method. LWT – Food Science and Technology, 30(6), 609–615. https://doi.org/https://doi.org/10.1006/fstl.1997.0240
- Boppré, M. (2011). The ecological context of pyrrolizidine alkaloids in food, feed and forage: An overview. Food Additives & Contaminants. Part A, Chemistry, Analysis, Control, Exposure & Risk Assessment, 28(3), 260–281. https://doi.org/https://doi.org/10.1080/19440049.2011.555085
- Boppré, M., Colegate, S. M., & Edgar, J. A. (2005). Pyrrolizidine alkaloids of Echium vulgare honey found in pure pollen. Journal of Agricultural and Food Chemistry, 53(3), 594–600. https://doi.org/https://doi.org/10.1021/jf0484531
- Boucher, A., Hidalgo, P. J., Thonnat, M., Belmonte, J., Galan, C., Bonton, P., & Tomczak, R. (2002). Development of a semi-automatic system for pollen recognition. Aerobiologia, 18(3/4), 195–201. https://doi.org/https://doi.org/10.1023/A:1021322813565
- Boudet, A. M. (2007). Evolution and current status of research in phenolic compounds. Phytochemistry, 68(22-24), 2722–2735. https://doi.org/https://doi.org/10.1016/j.phytochem.2007.06.012
- Brasil. (1997). Ministério da Agricultura e do Abastecimento. Portaria no 368, de 4 de setembro de 1997. Regulamento Técnico sobre as Condições Higiênico-Sanitárias e de Boas Práticas de Elaboração para Estabelecimentos Elaboradores/Industrializadores de Alimentos. Diário Oficial da União da Republica Federativa do Brasil, Brasília.
- Brasil. (2001). Instrução Normativa do Ministério da Agricultura nº 3, de 19 de janeiro de 2001. (DOU – 23/01/01, Secção I, pg. 18-23) Regulamentos técnicos de identidade e qualidade de apitoxina, cera de abelhas, geléia real, geléia real Liofilizada, pólen apícola, própolis e extrato de própolis. Diário Ofícial (DO), Brasília, DF.
- Brindza, J., & Brovarskyi, V. (2014). Pollen and bee pollen of some plant species (p. 138). Kyiv: Korsunskiy vidavnichiy dim Vsesvit.
- Bruni, I., Galimberti, A., Caridi, L., Scaccabarozzi, D., De Mattia, F., Casiraghi, M., & Labra, M. (2015). A DNA barcoding approach to identify plant species in multiflower honey. Food Chemistry, 170, 308–315. https://doi.org/https://doi.org/10.1016/j.foodchem.2014.08.060
- Bucher, E., Rjfler, V., Vorwoht, G., & Zieger, E. (2004). Das pollebild der sudtiroler honige (p. 676). Biologischer labor.
- Burmistrov, N., & Nikitina, V. A. (1990). Honey plants and their pollen (p. 192). Rosagropromizdat. (Book on Russian).
- Cabrera, C., & Montenegro, G. (2013). Pathogen control using a natural Chilean bee pollen extract of known botanical origin. Ciencia e Investigación Agraria, 40(1), 223–230. https://doi.org/https://doi.org/10.4067/S0718-16202013000100020
- Campos, M. G. (1997). Caracterização do pólen apícola pelo seu perfil em compostos fenólicos e pesquisa de algumas actividades biologicas [PhD thesis]. Faculty of Pharmacy, University of Coimbra.
- Campos, M. G., Bogdanov, S., Almeida-Muradian, L. B., Szczesna, T., Mancebo, Y., Frigerio, C., & Ferreira, F. (2008). Pollen composition and standardization of analytical methods. Journal of Apicultural Research, 47(2), 154–161. https://doi.org/https://doi.org/10.3896/IBRA.1.47.2.12
- Campos, M. G., Frigerio, C., Lopes, J., & Bogdanov, S. (2010). What is the future of bee pollen? Journal of ApiProduct and ApiMedical Science, 2(4), 131–144. https://doi.org/https://doi.org/10.3896/IBRA.4.02.4.01
- Campos, M. G., & Markham, K. R. (2007). Structure information from HPLC and on-line measured absorption spectra: Flavones, flavonols and phenolic acids. Imprensa da Universidade de Coimbra. https://doi.org/https://doi.org/10.14195/978-989-26-0480-0
- Campos, M. G., Markham, K. R., Mitchell, K. A, & da Cunha, A. P. d. (1997). An approach to the characterization of bee pollens via their flavonoid/phenolic profiles. Phytochemical Analysis, 8(4), 181–185. https://doi.org/https://doi.org/10.1002/(SICI)1099-1565(199707)8:4 < 181::AID-PCA359 > 3.0.CO;2-A
- Campos, M. G., Markham, K., & Proença da Cunha, A. (1996). Quality assessment of bee-pollens using flavonoid/phenolic profiles. Bull. Groupe Polyphenols, 18, 54–55.
- Campos, M. G., Mitchel, K., Cunha, A., & Markham, K. R. (1997). A systematic approach to the characterization of bee pollens via their flavonoid/phenolic profiles. Phytochemical Analysis, 8(4), 181–185. 2-A https://doi.org/https://doi.org/10.1002/(SICI)1099-1565(199707)8:4 < 181::AID-PCA359 > 3.0.CO
- Campos, M. G., Webby, R. F., Markham, K. R., Mitchell, K. A., & da Cunha, A. P. (2003). Age-induced diminution of free radical scavenging capacity in bee pollens and the contribution of constituent flavonoids. Journal of Agricultural and Food Chemistry, 51(3), 742–745. https://doi.org/https://doi.org/10.1021/jf0206466
- Caroli, S., Forte, G., Iamiceli, A. L., & Galoppi, B. (1999). Determination of essential and potentially toxic trace elements in honey by inductively coupled plasma-based techniques. Talanta, 50(2), 327–336. https://doi.org/https://doi.org/10.1016/S0039-9140(99)00025-9
- Carpes, S. T., Begnini, R., DE Alencar, S. M., & Masson, M. L. (2007). Study of preparations of bee pollen extracts, antioxidant and antibacterial activity. Ciência e Agrotecnologia, 31(6), 1818–1825. https://doi.org/https://doi.org/10.1590/S1413-70542007000600032
- Carpes, S. T., Prado, A. P., Moreno, I. A. M., Mourão, G. B., DE Alencar, S. M., & Masson, M. L. (2008). Avaliação do potencial antioxidante do pólen apícola producido na região sul do Brasil. Química Nova, 31(7), 1660–1664. https://doi.org/https://doi.org/10.1590/S0100-40422008000700011
- Carrión, P., Cernadas, E., Gálvez, J. F., & Díaz-Losada, E. (2003). Determine the composition of honey bee pollen by texture classification. In F. J. Perales (Ed.), IbPRIA 2003, LNCS 2652 (pp. 158–167). https://doi.org/https://doi.org/10.1007/978-3-540-44871-6_19
- Carvell, C., Westrich, P., Meek, W. R., Pywell, R. F., & Nowakowski, M. (2006). Assessing the value of annual and perennial forage mixtures for bumble bees by direct observation and pollen analysis. Apidologie, 37(3), 326–340. https://doi.org/https://doi.org/10.1051/apido:2006002
- Cavalieri, S. J., Harbeck, R. J., Mccarter, Y. S., Ortez, J. H., Rankin, I. D., Sautter, R. L., Sharp, S. E., & Spiegel, C. A. (2005). Manual of antimicrobial susceptibility testing. In M. B. Coyle (Ed.), American Society for Microbiology © 2005 (pp. 1–236). American Society for Microbiology.
- Chandola, V., Banerjee, A., & Kumar, V. (2009). Anomaly detection: A survey. ACM Computing Surveys, 41(3), 1–15. 58. https://doi.org/https://doi.org/10.1145/1541880.1541882
- Chantarudee, A., Phuwapraisirian, P., Kimura, K., Okuyama, M., Mori, H., Kimura, A., & Chanchao, C. (2012). Chemical constituents and free radical scavenging activity of corn pollen collected from Apis mellifera hives compared to floral corn pollen at Nam, Thailand. BMC Complementary & Alternative Medicine, 12, 45.
- Chaturvedi, M. (1973). An analysis of honey bee pollen loads from Banthra, Lucknow, India. Grana, 13(3), 139–144. https://doi.org/https://doi.org/10.1080/00173137309429890
- Chen, S., Yao, H., Han, J., Liu, C., Song, J., Shi, L., Zhu, Y., Ma, X., Gao, T., Pang, X., Luo, K., Li, Y., Li, X., Jia, X., Lin, Y., & Leon, C. (2010). Validation of the ITS2 region as a novel DNA barcode for identifying medicinal plant species. PLoS One, 5(1), e8613. https://doi.org/https://doi.org/10.1371/journal.pone.0008613
- Chica, M., & Campoy, P. (2012). Discernment of bee pollen loads using computer vision and one-class classification techniques. Journal of Food Engineering, 112(1-2), 50–59. https://doi.org/https://doi.org/10.1016/j.jfoodeng.2012.03.028
- Choi, E. (2007). Antinociceptive and antiinflammatory activities of pine (Pinus densiflora) pollen extract. Phytotherapy Research, 21(5), 471–475. https://doi.org/https://doi.org/10.1002/ptr.2103
- Chudzinska, M., & Baralkiewicz, D. (2011). Application of ICP-MS method of determination of 15 elements in honey with chemometric approach for the verification of their authenticity. Food and Chemical Toxicology, 49(11), 2741–2749. https://doi.org/https://doi.org/10.1016/j.fct.2011.08.014
- Cirnu, I., Slusanschi, N., Maronescu, R., Filipescu, H., & Grosu, E. (1969). Compozitia chimică a polenului de porumb (Zea mays L.) si floarea-soarelui (Helianthus annuus L.) recoltat la diferite epoci, in cardul amestecului furajer-melifer. Apicultura, 22(8), 22–25.
- Clinical and Laboratory Standards Institute (CLSI). (2009). Performance standards for antimicrobial disk susceptibility tests; approved standard-tenth edition M02-A10. National Committee for Clinical Laboratory Standards, 29. 76 pp
- Clinical and Laboratory Standards Institute (CLSI). (2012). Methods for dilution antimicrobial susceptibility tests for bacteria that grow aerobically; approved standard – Ninth Edition M07 – A9. National Committee for Clinical Laboratory Standards, 32(2), 1–64.
- Comaniciu, D., & Meer, P. (2002). Mean shift: A robust approach toward feature space analysis. IEEE Transactions on Pattern Analysis and Machine Intelligence, 24(5), 603–619. https://doi.org/https://doi.org/10.1109/34.1000236
- Costa, C. T., Dalluge, J. J., Welch, M. J., Coxon, B., Margolis, S. A., & Horton, D. (2000). Characterization of prenylated xanthones and flavanones by liquid chromatography/atmospheric pressure chemical ionization mass spectrometry. Journal of Mass Spectrometry, 35(4), 540–549. https://doi.org/https://doi.org/10.1002/(SICI)1096-9888(200004)35:4 < 540::AID-JMS966 > 3.0.CO;2-Y
- Crane, E. E. (1990). Bees and beekeeping: Science, practice and world resources (p. 593). Cornstock Publ.
- Crews, C., Berthiller, F., & Krska, R. (2010). Update on analytical methods for toxic pyrrolizidine alkaloids. Analytical and Bioanalytical Chemistry, 396(1), 327–338. https://doi.org/https://doi.org/10.1007/s00216-009-3092-2
- Crews, C., Driffield, M., Berthiller, F., & Krska, R. (2009). Loss of pyrrolizidine alkaloids on decomposition of ragwort (Senecio jacobaea) as measured by LC-TOF-MS. Journal of Agricultural and Food Chemistry, 57(9), 3669–3673. https://doi.org/https://doi.org/10.1021/jf900226c
- Cuyckens, F., & Claeys, M. (2002). Optimization of a liquid chromatography method based on simultaneous electrospray ionization mass spectrometric and ultraviolet photodiode array detection for analysis of flavonoid glycosides. Rapid Communications in Mass Spectrometry, 16(24), 2341–2348. https://doi.org/https://doi.org/10.1002/rcm.861
- Cuyckens, F., & Claeys, M. (2004). Mass spectrometry in the structural analysis of flavonoids. Journal of Mass Spectrometry, 39(1), 1–15. https://doi.org/https://doi.org/10.1002/jms.585
- Danner, N., Härtel, S., & Steffan-Dewenter, I. (2014). Maize pollen foraging by honey bees in relation to crop area and landscape context. Basic and Applied Ecology, 15(8), 677–684. https://doi.org/https://doi.org/10.1016/j.baae.2014.08.010
- Dasarathy, B. (1991). Nearest Neighbor (NN) norms: Nearest neighbor pattern classification techniques. IEEE Computational Society.
- de Rijke, E., Out, P., Niessen, W. M. A., Ariese, F., Gooijer, C., & Brinkman, U. A. (2006). Analytical separation and detection methods for flavonoids. Journal of Chromatography. A, 1112(1-2), 31–63. https://doi.org/https://doi.org/10.1016/j.chroma.2006.01.019
- de Rijke, E., Zappey, H., Ariese, F., Gooijer, C., & Brinkman, U. A. (2003). Liquid chromatography with atmospheric pressure chemical ionization and electrospray ionization mass spectrometry of flavonoids with triple quadrupole and ion-trap instruments. Journal of Chromatography. A, 984(1), 45–58. https://doi.org/https://doi.org/10.1016/S0021-9673(02)01868-X
- Delaplane, K. S., Dag, A., Danka, R. G., Freitas, B. M., Garibaldi, L. A., Goodwin, R. M., & Hormaza, J. I. (2013). Standard methods for pollination research with Apis mellifera. In V. Dietemann, J. D. Ellis, & P. Neumann (Eds.), The COLOSS BEEBOOK, Volume I: standard methods for Apis mellifera research. Journal of Apicultural Research, 52(4). https://doi.org/https://doi.org/10.3896/IBRA.1.52.4.12.
- Di Paola-Naranjo, R. D., Sánchez, S. J., Paramás, A. M. G., & Rivas Gonzalo, J. C. (2004). Liquid chromatographic-mass spectrometric analysis of anthocyanin composition of dark blue bee pollen from Echium plantagineum. Journal of Chromatography. A, 1054(1-2), 205–210. https://doi.org/https://doi.org/10.1016/j.chroma.2004.05.023
- Droussi, Z., D'orazio, V., Provenzano, M. R., Hafidi, M., & Ouatmane, A. (2009). Study of the biodegradation and transformation of olive-mill residues during composting using FTIR spectroscopy and differential scanning calorimetry. Journal of Hazardous Materials, 164(2-3), 1281–1285. https://doi.org/https://doi.org/10.1016/j.jhazmat.2008.09.081
- Dübecke, A., Beckh, G., & Lüllmann, C. (2011). Pyrrolizidine alkaloids in honey and bee pollen. Food Additives & Contaminants. Part A, Chemistry, Analysis, Control, Exposure & Risk Assessment, 28(3), 348–358. https://doi.org/https://doi.org/10.1080/19440049.2010.541594
- Dustman, J. H. (1992). Honey, quality and its control. Abstracts of the 8th International Palynological Congress. France, p. 40.
- Dutkiewicz, S. (1996). Usefulness of Cernilton in the treatment of benign prostatic hyperplasia. International Urology and Nephrology, 28(1), 49–53. https://doi.org/https://doi.org/10.1007/BF02550137
- Dutta, D., Devi, S. S., Krishnamurthi, K., Kumar, K., Vyas, P., Muthal, P. L., Naoghare, P., & Chakrabarti, T. (2007). Modulatory effect of distillate of Ocimum sanctum leaf extract (Tulsi) on human lymphocytes against genotoxicants. Biomedical and Environmental Sciences, 20(3), 226–234.
- Dzyuba, O. F. (2006). Palinoindikatsiya environmental quality. SPb.: Publishing House "Nedra", 198 p. (Article in Russian).
- Dzyuba, O. F. (2007). Teratomorfnye pollen grains in a modern and paleopalinologicheskih pollen spectra and some problems. Palynostratigraphy/OF Dziuba//Oil and Gas Technologies: Theory and Practice, 2007(2), 1–22. (Article in Russian).
- Dzyuba, O. F., & Tarasovich, V. F. (2001). The morphological features of pollen grains of Tilia Cordata Mill. In the modern metropolis. International Workshop: Pollen as an indicator of environmental and paleoecological reconstruction – St. Petersburg, pp. 79–90. (Article in Russian).
- Echigo, T., Takenaka, T., & Yatsunami, K. (1986). Comparative studies on chemical composition of honey, royal jelly and pollen loads. Bulletin of the Faculty of Agriculture Tamagawa University, 26, 1–8.
- Edgar, R. C. (2010). Search and clustering orders of magnitude faster than BLAST. Bioinformatics, 26(19), 2460–2461. https://doi.org/https://doi.org/10.1093/bioinformatics/btq461
- Eloff, J. N. (1998). A sensitive and quick microplate method to determine the minimal inhibitory concentration of plant extracts for bacteria. Planta Medica, 64(8), 711–713. https://doi.org/https://doi.org/10.1055/s-2006-957563
- Eraslan, G., Kanbur, M., & Silici, S. (2009). Effect of carbaryl on some biochemical changes in rats: The ameliorative effect of bee pollen. Food and Chemical Toxicology, 47(1), 86–91. https://doi.org/https://doi.org/10.1016/j.fct.2008.10.013
- Eraslan, G., Kanbur, M., Silici, S., Liman, B., Altinordulu, S., & Sarica, Z. S. (2009). Evaluation of protective effect of bee pollen against propoxur toxicity in rat. Ecotoxicology and Environmental Safety, 72(3), 931–937. https://doi.org/https://doi.org/10.1016/j.ecoenv.2008.06.008
- Erkmen, O., & Ozcan, M. M. (2008). Antimicrobial effects of Turkish propolis, pollen, and laurel on spoilage and pathogenic food-related microorganisms. Journal of Medicinal Food, 11(3), 587–592. https://doi.org/https://doi.org/10.1089/jmf.2007.0038
- Estevinho, L. M., Pereira, A. P., Moreira, L., Dias, L. G., & Pereira, E. (2008). Antioxidant and antimicrobial effects of phenolic compounds extracts of Northeast Portugal honey. Food and Chemical Toxicology, 46(12), 3774–3779. https://doi.org/https://doi.org/10.1016/j.fct.2008.09.062
- Eswaran, V. U., & Bhargava, H. R. (2014). Chemical analysis and anti-microbial activity of Karnataka bee bread of Apis species. World Applied Sciences Journal, 32(3), 379–385. https://doi.org/https://doi.org/10.5829/idosi.wasj.2014.32.03.1006
- Evans, J. D., Schwarz, R. S., Chen, Y.-P., Budge, G., Cornman, R. S., De La Rua, P., De Miranda, J. R., Foret, S., Foster, L., Gauthier, L., Genersch, E., Gisder, S., Jarosch, A., Kucharski, R., Lopez, D., Lun, C. M., Moritz, R. F. A., Maleszka, R., Muñoz, I., & Pinto, M. A. (2013). Standard methodologies for molecular research in Apis mellifera. In V. Dietemann, J. D. Ellis & P. Neumann (Eds), The COLOSS BEEBOOK, Volume I: standard methods for Apis mellifera research. Journal of Apicultural Research, 52(4), https://doi.org/https://doi.org/10.3896/IBRA.1.52.4.11
- Fabre, N., Rustan, I., Hoffmann, E., & Quetin-Leclercq, J. (2001). Determination of flavone, flavonol and flavanone aglycones by negative ion LC–ES ion trap mass spectrometry. Journal of the American Society for Mass Spectrometry, 12(6), 707–715. https://doi.org/https://doi.org/10.1016/S1044-0305(01)00226-4
- Faegri, K., Kaland P, E., & Krzywinski, K. (1993). Bestimmungsschlussel fur die nordwesteuropaische pollenflora (p. 85). G. Fischer.
- Fanali, C., Dugo, L., & Rocco, A. (2013). Nano-liquid chromatography in nutraceutical analysis: determination of polyphenols in bee pollen. Journal of Chromatography. A, 1313, 270–274. https://doi.org/https://doi.org/10.1016/j.chroma.2013.06.055
- FAO/IPGRI. (2001). Multi-crop passport descriptors. http://www.bioversityinternational.org/fileadmin/bioversity/publications/pdfs/124.pdf
- Fatrcová-Šramková, K., Nȏžková, J., Kačániová, M., Máriassyová, M., & Kropková, Z. (2010). Microbial properties, nutritional composition and antioxidant activity of Brassica napus subsp. napus L. bee pollen used in human nutrition. Ecological Chemistry and Engineering A, 17(1), 45–54.
- Fatrcová-Šramková, K., Nôžková, J., Kačániová, M., & Mariássyová, M. (2011). Antioxidant and antimicrobial properties of monofloral bee pollen usable in human nutrition. In Chemické Listy, 105(Suppl), 1005–1006. https://doi.org/https://doi.org/10.1080/03601234.2013.727664
- Fatrcová-Šramková, K., Nôžková, J., Kačániová, M., Máriássyová, M., Rovná, K., & Stričík, M. (2013). Antioxidant and antimicrobial properties of monofloral bee pollen. Journal of Environmental Science and Health. Part. B, Pesticides, Food Contaminants, and Agricultural Wastes, 48(2), 133–138. https://doi.org/https://doi.org/10.1080/03601234.2013.727664
- Feás, X., Vázquez-Tato, M. P., Estevinho, L., Seijas, J. A., & Iglesias, A. (2012). Organic bee pollen: Botanical origin, nutritional value, bioactive compounds, antioxidant activity and microbiological quality. Molecules, 17(7), 8359–8377. https://doi.org/http://dx.doi.org/10.3390/molecules17078359
- Forcone, A., Aloisi, P. V., Ruppel, S., & Munoz, M. (2011). Botanical composition and protein content of pollen collected by Apis mellifera L. in the north-west of Santa Cruz (Argentinean Patagonia). Grana, 50(1), 30–39. https://doi.org/https://doi.org/10.1080/00173134.2011.552191
- Ferreres, F., Pereira, D. M., Valentão, P., & Andrade, P. B. (2010). First report of non-coloured flavonoids in Echium plantagineum bee pollen: Differentiation of isomers by liquid chromatography/ion trap mass spectrometry. Rapid Communications in Mass Spectrometry, 24(6), 801–806. https://doi.org/https://doi.org/10.1002/rcm.4454
- Fogle, H. W. (1977). Identification of tree fruit species by pollen ultrastructure. Journal – American Society for Horticultural Science, 102(5), 548–551.
- Fontanals, N., Marcé, R. M., & Borrull, F. (2007). New materials in sorptive extraction techniques for polar compounds. Journal of Chromatography. A, 1152(1-2), 14–31. https://doi.org/https://doi.org/10.1016/j.chroma.2006.11.077
- Forcone, A., Aloisi, P. V., Ruppel, S., & Munoz, M. (2011). Botanical composition and protein content of pollen collected by Apis mellifera L. in the north-west of Santa Cruz (Argentinean Patagonia). Grana, 50(1), 30–39. https://doi.org/https://doi.org/10.1080/00173134.2011.552191
- Fossel, A.-M., & Pechhacker, H. (2001). Bienen and blumen (p. 676). Institut fur Bienenkunde.
- Franco, B. D. G. M. (2002). Fatores intrínsecos e extrínsecos que controlam o desenvolvimento microbiano nos alimentos. In B. D. G. M. Franco & M. Landgraf (Eds.), Microbiologia dos Alimentos (pp. 13–26). Atheneu.
- Fukunaga, K., & Hostetler, L. (1975). The estimation of the gradient of a density function, with applications in pattern recognition. IEEE Transactions on Information Theory, 21(1), 32–40. https://doi.org/https://doi.org/10.1109/TIT.1975.1055330
- Galimberti, A., De Mattia, F., Bruni, I., Scaccabarozzi, D., Sandionigi, A., Barbuto, M., Casiraghi, M., & Labra, M. (2014). A DNA barcoding approach to characterize pollen collected by honeybees. PLoS One, 9(10), e109363. https://doi.org/https://doi.org/10.1371/journal.pone.0109363
- Gašić, U., Kečkeš, S., Dabić, D., Trifković, J., Milojković-Opsenica, D., Natić, M., & Tešić, Z. (2014b). Phenolic profile and antioxidant activity of Serbian polyfloral honeys. Food Chemistry, 145, 599–607. https://doi.org/https://doi.org/10.1016/j.foodchem.2013.08.088
- Gašić, U., Šikoparija, B., Tosti, T., Trifković, J., Milojković-Opsenica, D., Natić, M., & Tešić, Ž. Ž (2014a). Phytochemical fingerprints of lime honey collected in Serbia. Journal of AOAC International, 97(5), 1259–1267. https://doi.org/https://doi.org/10.5740/jaoacint.SGEGasic
- Germano, M. I. S., Germano, P. M. L., Kamei, C. A. K., Abreu, E. S. d., Ribeiro, E. R., Silva, K. C. d., Lamardo, L. C. A., Rocha, M. F. G., Vieira, V. K. I., & Kawasaki, V. M. (2000). Manipuladores de alimentos: capacita? É preciso! Regulamentar? Será preciso? HigieneAlimentar, 14(78/79), 18–22.
- Gilber, M. D., & Lisk, D. J. (1978). Honey as an environmental indicator of radionuclide contamination. Bulletin of Environmental Contamination and Toxicology, 19(1), 32–34. https://doi.org/https://doi.org/10.1007/BF01685763
- Gilliam, M., Prest, D. B., & Lorenz, B. J. (1989). Microbiology of pollen and bee bread: taxonomy and enzimology of molds. Apidologie, 20(1), 53–68. https://doi.org/https://doi.org/10.1051/apido:19890106
- Glazer, A. N. (1990). Phycoerythrin fluorescence-based assay for reactive oxygen species . Methods in Enzymology, 186, 161–168. https://doi.org/https://doi.org/10.1016/0076-6879(90)86106-6
- Glazunov, K. P. (2001 Pollen as an indicator of negative environmental factors: embryological aspect [Paper presentation]. International Seminar: Pollen as an Indicator of Environmental and Paleoecological Reconstruction, pp. 61–63. (Article in Russian).
- Goh, K., Chang, E., & Cheng, K. (2001). SVM binary classifier ensembles for image classification [Paper presentation]. Proceedings of the ACM Conference Information and Knowledge Management, New York, pp. 395–402. https://doi.org/https://doi.org/10.1145/502585.502652
- Goh, K., Chang, E., & Li, B. (2005). Using one-class and two-class SVMs for multiclass image annotation. IEEE Transactions on Knowledge and Data Engineering, 17(10), 1333–1346. https://doi.org/https://doi.org/10.1109/TKDE.2005.170
- Gok, S., Severcan, M., Goormaghtigh, E., Kandemir, I., & Severcan, F. (2015). Differentiation of Anatolian honey samples from different botanical origins by ATR-FTIR spectroscopy using multivariate analysis. Food Chemistry, 170, 234–240. https://doi.org/https://doi.org/10.1016/j.foodchem.2014.08.040
- Gonzalez, R. C., & Woods, R. E. (2008). Digital image processing (3rd ed.). Prentice Hall.
- Graikou, K., Kapeta, S., Aligiannis, N., Sotiroudis, G., Chondrogianni, N., Gonos, E., & Chinou, I. (2011). Chemical analysis of Greek pollen – Antioxidant, antimicrobial and proteasome activation properties. Chemistry Central Journal, 5(1), 33–39. https://doi.org/https://doi.org/10.1186/1752-153X-5-33
- Greenham, J., Williams, C., & Harborne, J. B. (1995). Identification of lipophilic flavonols by a combination of chromatographic and spectral techniques. Phytochemical Analysis, 6(4), 211–217. https://doi.org/https://doi.org/10.1002/pca.2800060407
- Grembecka, M., & Szefer, P. (2013). Evaluation of honeys and bee products quality based on their mineral composition using multivariate techniques. Environmental Monitoring and Assessment, 185(5), 4033–4047. https://doi.org/https://doi.org/10.1007/s10661-012-2847-y
- Gu, D., Yang, Y., Abdulla, R., & Aisa, H. A. (2012). Characterization and identification of chemical compositions in the extract of Artemisia rupestris L. by liquid chromatography coupled to quadrupole time-of-flight tandem mass spectrometry. Rapid Communications in Mass Spectrometry, 26(1), 83–100. https://doi.org/https://doi.org/10.1002/rcm.5289
- Guide for the Care and Use of Laboratory Animals Eighth Edition. (2011). The National Academies Press 500 Fifth Street, NW Washington, DC 20001. www.national-academies.org
- Guo, J. T., Lee, H. L., Chiang, S. H., Lin, F. I., & Chang, C. Y. (2020). Antioxidant properties of the extracts from different parts of broccoli in Taiwan. Journal of Food and Drug Analysis, 9(2), 96–101. https://doi.org/https://doi.org/10.38212/2224-6614.2795
- Harborne, J. B., & Boardley, M. (1984). Use of high performance liquid chromatography in the separation of flavonol glycosides and flavonol sulphates. Journal of Chromatography A, 299(2), 377–385. https://doi.org/https://doi.org/10.1016/S0021-9673(01)97853-7
- Hartmann, T., & Toppel, G. (1987). Senecionine n-oxide. The primary product of pyrrolizidine alkaloid biosynthesis in root cultures of Senecio vulgaris. Phytochemistry, 26(6), 1639–1643. https://doi.org/https://doi.org/10.1016/S0031-9422(00)82261-X
- Hartmann, T., & Witte, L. (1995). Chemistry, biology and chemoecology of the pyrrolizidine alkaloids. In S. W. Pelletier (Ed.), Alkaloids: Chemical and biological perspectives (Vol. 9, pp. 155–233). Pergamon Press. https://doi.org/https://doi.org/10.1016/b978-0-08-042089-9.50011-5
- Haussmann, B. I. G., & Parzies, H. K. (2009). Methodologies for generating variability: Part 1: Use of genetic resources in plant breeding. In S. Ceccarelli (Ed.), Plant breeding and farmer participation (pp. 107–128). FAO of the UN.
- Heo, M. Y., Sohn, S. J., & Au, W. W. (2001). Anti-genotoxicity of galangin as a cancer chemopreventive agent candidate. Mutation Research, 488(2), 135–150. https://doi.org/https://doi.org/10.1016/S1383-5742(01)00054-0 http://www.mercola.com/article/diet/bee_pollen.htm.
- Herbert, E. W. J. (1992). Honey bee nutrition. In J. E. Graham (Ed.), The hive and the honey bee (pp. 197–233). Dadant & Sons Inc.
- Herbert, E. W. J., & Shimanuki, H. (1978). Chemical composition and nutritive value of bee-collected and bee-stored pollen. Apidologie, 9(1), 33–40. https://doi.org/https://doi.org/10.1051/apido:19780103
- Hewitt, W., & Vincent, S. (1989). Theory and application of microbiological assay. Academic Press.
- Hleba, L., Pochop, J., Felšöciová, S., Petrová, J., Čuboň, J., Pavelková, A., & Kačániová, M. (2013). Antimicrobial effect of bee collected pollen extract to Enterobacteriaceae Genera after application of bee collected pollen in their feeding. Animal Science and Biotechnologies, 46(2), 108–113.
- Hleba, L., Pochop, J., Felšöciová, S., Petrová, J., Čuboň, J. & Pavelková, A. (2013). Characterization of chemical composition of bee pollen in China. Food Chemistry, 61(3), 708–718. https://doi.org/https://doi.org/10.1021/jf304056b
- Hodges, D. (1952). The pollen loads of the honey bee (p. 154). Bee Research Association.
- Human, H., Brodschneider, R., Dietemann, V., Dively, G., Ellis, J. D., Forsgren, E., Fries, I., Hatjina, F., Hu, F.-L., Jaffé, R., Jensen, A. B., Köhler, A., Magyar, J., Özikrim, A., Pirk, C. W. W., Rose, R., Strauss, U., Tanner, G., Tarpy, D. R., van der Steen, J. J. M., Vaudo, A., Vejsnaes, F., Wilde, J., Williams, G. R., & Zheng, H.-Q. (2013). Miscellaneous standard methods for Apis mellifera research. In V. Dietemann, J. D. Ellis & P. Neumann (Eds), The COLOSS BEEBOOK, Volume I: standard methods for Apis mellifera research. Journal of Apicultural Research, 52(4), https://doi.org/https://doi.org/10.3896/IBRA.1.52.4.10
- Human, H., & Nicolson, S., W. (2006). Nutritional content of fresh, bee-collected and stored pollen of Aloe greatheadii var. davyana (Assphodelaceae). Phytochemistry, 67(14), 1486–1492. https://doi.org/https://doi.org/10.1016/j.phytochem.2006.05.023
- Ibrahim, A., & Spivak, M. (2006). The relationship between hygienic behavior and suppression of mite reproduction as honey bee (Apis mellifera) mechanisms of resistance to Varroa destructor. Apidologie, 37(1), 31–40. https://doi.org/https://doi.org/10.1051/apido:2005052
- Ionita, P. (2005). Is DPPH stable free radical a good scavenger for oxygen active species? Chemical Papers, 50(1), 11–16.
- Jaiswal, S., Mansa, N., Prasad, M. S., Jena, B. S., & Negi, P. S. (2014). Antibacterial and antimutagenic activities of (Dillenia indica) extracts. Food Bioscience, 5, 47–53. https://doi.org/https://doi.org/10.1016/j.fbio.2013.11.005
- Jakobek, L. (2015). Interactions of polyphenols with carbohydrates, lipids and proteins. Food Chemistry, 175, 556–567. https://doi.org/https://doi.org/10.1016/j.foodchem.2014.12.013
- Jiang, L. (2011). Comparison of disk diffusion, agar dilution, and broth microdilution for antimicrobial susceptibility testing of five chitosans [Thesis in Master of Science]. Faculty of the Louisiana State University and Agricultural and Mechanical College, Department of Food Science.
- Jorgensen, J. H., & Ferraro, M. J. (2009). Antimicrobial susceptibility testing: A review of general principles and contemporary practices. Clinical Infectious Diseases, 49(11), 1749–1755. https://doi.org/https://doi.org/10.1086/647952
- Kacániová, M., Vuković, N., Chlebo, R., Haščík, P., Rovná, K., Cubon, J., Džugan, M., & Pasternakiewicz, A. (2012). The antimicrobial activity of honey, bee pollen loads and beeswax from Slovakia. Archives of Biological Sciences, 64(3), 927–934. https://doi.org/https://doi.org/10.2298/ABS1203927K
- Kacániová, M., Terentjeva, M., Petrová, J., Hleba, L., Shevtsova, T., Kluz, M., Rožek, P., & Vukovič, N. (2014). Antimicrobial activity of non-traditional plant pollen against different species of microorganisms. Journal of Microbiology Biotechnology and Food Science, 4(1), 80–82. https://doi.org/http://dx.doi.org/10.15414/jmbfs.2014.4.1.80-82
- Kao, Y. T., Lu, M. J., & Chen, C. (2020). Preliminary analysis of phenolic compounds and antioxidant activities in tea pollen extracts. Journal of Food and Drug Analysis, 19(4), 470–477. https://doi.org/https://doi.org/10.38212/2224-6614.2177
- Kaur, C., & Kapoor, H. C. (2001). Antioxidants in fruits and vegetables-the millennium’s health. International Journal of Food Science and Technology, 36(7), 703–725. https://doi.org/https://doi.org/10.1046/j.1365-2621.2001.00513.x
- Kaur, R., Nagpal, A., & Katnoria, J. K. (2015). Exploration of antitumor properties of pollen grains of plant species belonging to Fabaceae family. Journal of Pharmaceutical Sciences and Research, 7(3), 127–129.
- Kečkeš, S., Gašić, U., Veličković, T. Ć., Milojković-Opsenica, D., Natić, M., & Tešić, Ž. (2013). The determination of phenolic profiles of Serbian unifloral honeys using ultra-high-performance liquid chromatography/high resolution accurate mass spectrometry. Food Chemistry, 138(1), 32–40. https://doi.org/https://doi.org/10.1016/j.foodchem.2012.10.025
- Kedves, M., Kocsicska, I., & Priskin, K. (2003). Transmission electron microscopy of the connectives of the pollen grains of Ginkgo biloba L. Plant Cell Biology and Development, Szeged, 15, 28–42.
- Kedves, M., Pardutz, A., & Horvath, A. (2002). Transmission electron microscopy of partially degraded pollen grains of Ambrosia artemisiifolia (ragweed). Plant Cell Biology and Development, Szeged, 14, 49–58.
- Kelina, I., Saavedra, C., Consuelo Rojas, I., Guillermo, E., & Delgado, P. (2013). Pollinic characteristics and chemical composition of bee pollen collected in Cayalti (Lambayeque – Peru). Revista Chilena de Nutricion, 40(1), 71–78.
- Keller, A., Danner, N., Grimmer, G., Ankenbrand, M., von der Ohe, K., von der Ohe, W., Rost, S., Härtel, S., & Steffan-Dewenter, I. (2015). Evaluating multiplexed next-generation sequencing as a method in palynology for mixed pollen samples. Plant Biology, 17(2), 558–566. https://doi.org/https://doi.org/10.1111/plb.12251
- Keller, A., Hohlfeld, S., Kolter, A., Schultz, J., Gemeinholzer, B., & Ankenbrand, M. J. (2020). BCdatabaser: On-the-fly reference database creation for (meta-)barcoding. Bioinformatics, 36(8), 2630–2631. https://doi.org/https://doi.org/10.1093/bioinformatics/btz960
- Keller, I., Fluri, P., & Imdorf, A. (2005). Pollen nutrition and colony development in honey bees: Part I. Bee World, 86(1), 3–10. https://doi.org/https://doi.org/10.1080/0005772X.2005.11099641
- Kempf, M., Beuerle, T., Bühringer, M., Denner, M., Trost, D., von der Ohe, K., Bhavanam, V. B. R., & Schreier, P. (2008). Pyrrolizidine alkaloids in honey: Risk analysis by gas chromatography-mass spectrometry. Molecular Nutrition & Food Research, 52(10), 1193–1200. https://doi.org/https://doi.org/10.1002/mnfr.200800051
- Kempf, M., Heil, S., Hasslauer, I., Schmidt, L., von der Ohe, K., Theuring, C., Reinhard, A., Schreier, P., & Beuerle, T. (2010). Pyrrolizidine alkaloids in pollen and pollen products. Molecular Nutrition & Food Research, 54(2), 292–300. https://doi.org/https://doi.org/10.1002/mnfr.200900289
- Kempf, M., Wittig, M., Reinhard, A., von der Ohe, K., Blacquière, T., Raezke, K.-P., Michel, R., Schreier, P., & Beuerle, T. (2011). Pyrrolizidine alkaloids in honey: Comparison of analytical methods. Food Additives & Contaminants. Part A, Chemistry, Analysis, Control, Exposure & Risk Assessment, 28(3), 332–347. https://doi.org/https://doi.org/10.1080/19440049.2010.521772
- Khynriam, D., & Prasad, S. B. (2003). Changes in glutathione-related enzymes in tumor-bearing mice after cisplatin treatment. Cell Biology and Toxicology, 18(6), 1573–6822.
- Kirk, W. D. J. (1994). A color guide to pollen loads of the honey bee (p. 54). International Bee Research Association.
- Klancnik, A., Piskernik, S., Jersek, B., & Mozina, S. S. (2010). Evaluation of diffusion and dilution methods to determine the antibacterial activity of plant extracts. Journal of Microbiological Methods, 81(2), 121–126. https://doi.org/https://doi.org/10.1016/j.mimet.2010.02.004
- Klungness, L. M., & Peng, Y.-S. (1983). A scanning electron microscopic study of pollen loads collected and stored by honey bees. Journal of Apicultural Research, 22(4), 264–271. https://doi.org/https://doi.org/10.1080/00218839.1983.11100598
- Koleva, I. I., VAN Beek, T. A., Linssen, J. P. H., De Groot, A., & Evstatieva, L. N. (2002). Screening of plant extracts for antioxidant activity: A comparative study on three testing methods. Phytochemical Analysis, 13(1), 8–17. https://doi.org/https://doi.org/10.1002/pca.611
- Komosinska-Vassev, K., Olczyk, P., Kafmierczak, J., Mencner, L., & Olczyk, K. (2015) Bee pollen: Chemical composition and therapeutic application. Evidence-Based Complementary and Alternative Medicine, 2015, 1–6. https://doi.org/https://doi.org/10.1155/2015/297425.
- Köppler, K., Vorwohl, G., & Koeniger, N. (2007). Comparison of pollen spectra collected by four different subspecies of the honey bee Apis mellifera. Apidologie, 38(4), 341–353. https://doi.org/https://doi.org/10.1051/apido:2007020
- Kostić, A. Ž., Barać, M. B., Stanojević, S. P., Milojković-Opsenica, D. M., Tešić, Ž. L., Šikoparija, B., Radišić, P., Prentović, M., & Pešić, M. B. (2015). Physicochemical composition and techno-functional properties of bee pollen collected in Serbia. LWT – Food Science and Technology, 62(1), 301–309. https://doi.org/https://doi.org/10.1016/j.lwt.2015.01.0310023-6438
- Kozich, J. J., Westcott, S. L., Baxter, N. T., Highlander, S. K., & Schloss, P. D. (2013). Development of a dual-index sequencing strategy and curation pipeline for analyzing amplicon sequence data on the MiSeq Illumina sequencing platform. Applied and Environmental Microbiology, 79(17), 5112–5120. https://doi.org/https://doi.org/10.1128/AEM.01043-13
- Kraaijeveld, K., de Weger, L. A., Ventayol García, M., Buermans, H., Frank, J., Hiemstra, P. S., & den Dunnen, J. T. (2015). Efficient and sensitive identification and quantification of airborne pollen using next-generation DNA sequencing. Molecular Ecology Resources, 15(1), 8–16. https://doi.org/https://doi.org/10.1111/1755-0998.12288
- Kroyer, G., & Hegedus, N. (2001). Evaluation of bioactive properties of pollen extracts as functional dietary food supplement. Innovative Food Science & Emerging Technologies, 2(3), 171–174. https://doi.org/https://doi.org/10.1016/S1466-8564(01)00039-X
- Langford, M., Taylor, G., & Flenley, J. (1990). Computerized identification of pollen grains by texture analysis. Review of Palaeobotany and Palynology, 64(1-4), 197–203. https://doi.org/https://doi.org/10.1016/0034-6667(90)90133-4
- Lautraite, S., Musonda, A. C., Doehmer, J., Edwards, G. O., & Chipman, J. K. (2002). Flavonoids inhibit genetic toxicity produced by carcinogens in cells expressing CYP1A2 and CYP1A1. Mutagenesis, 17(1), 45–53. https://doi.org/https://doi.org/10.1093/mutage/17.1.45
- LeBlanc, B. W., Davis, O. K., Boue, S., DeLucca, A., & Deeby, T. (2009). Antioxidant activity of Sonoran Desert bee pollen. Food Chemistry, 115(4), 1299–1305. https://doi.org/https://doi.org/10.1016/j.foodchem.2009.01.055
- Lee, K.-H., Kim, A.-J., & Choi, E.-M. (2009). Antioxidant and anti-inflammatory activity of pine pollen extract in vitro. Phytotherapy Research, 23(1), 41–48. https://doi.org/https://doi.org/10.1002/ptr.2525
- Leja, M., Mareczek, A., Wyżgolik, G., Klepacz-Baniak, J., & Czekońska, K. (2007). Antioxidative properties of bee pollen in selected plant species. Food Chemistry, 100(1), 237–240. https://doi.org/https://doi.org/10.1016/j.foodchem.2005.09.047
- Leong, L. P., & Shui, G. (2002). An investigation of antioxidant capacity of fruits in Singapore market. Food Chemistry, 76(1), 69–75. https://doi.org/https://doi.org/10.1016/S0308-8146(01)00251-5
- Li, A., Zhang, Q., Zhang, G., Chen, J., Fei, Z., & Liu, F. (2002). Adsorption of phenolic compounds from aqueous solutions by a water-compatible hypercrosslinked polymeric adsorbent. Chemosphere, 47(9), 981–989. https://doi.org/https://doi.org/10.1016/S0045-6535(01)00222-3
- Li, P., & Flenley, J. R. (1999). Pollen texture identification using neural networks. Grana, 38(1), 59–64. In https://doi.org/https://doi.org/10.1080/001731300750044717
- Lindtner, P. (2014). Garden plants for honey bees (p. 389). Wicwas Press LLC.
- Liolios, V., Tananaki, C., Dimou, M., Kanelis, D., Goras, G., Karazafiris, E., Thrasyvoulou, A. (2014). Predict the chemical composition of pollen. In Proceedings of International Symposium on Bee Products, 3rd edition, September 28th – October 1st, p. 28.
- Lokutova, O. (2014). Quality of bee products in context of environmental safety. Zborník vedeckých prác a výsledkov z riešenia výskumného projektu Podpora inovácie technológií špeciálnych výrobkov biopotravín pre zdravú výživu ľudí – Slovenská poľnohospodárska univerzita v Nitre, pp. 182–188.
- Loper, G. M., Standifer, L. N., Thompson, M. J., & Gilliam, M. (1980). Biochemistry and microbiology of bee collected almond (Prumus dulcis) pollen and bee bread. I Fatty acids, vitamins and minerals. Apidologie, 11(1), 63–73. https://doi.org/https://doi.org/10.1051/apido:19800108
- Louveaux, J., Maurizio, A., & Vorwohl, G. (1978). Methods of melissopalynology. Bee World, 59(4), 139–157. https://doi.org/https://doi.org/10.1080/0005772X.1978.11097714
- Lucchese, L., Mitra, S. (2001). Color image segmentation: A state-of-the-art survey. In Proceedings of the Indian National Science Academy (INSA-A), pp. 207–221.
- Lv, H., Wang, X., He, Y., Wang, H., & Suo, Y. (2015). Identification and quantification of flavonoid aglycones in rape bee pollen from Qinghai-Tibetan Plateau by HPLC-DAD-APCI/MS. Journal of Food Composition and Analysis, 38, 49–54. https://doi.org/https://doi.org/10.1016/j.jfca.2014.10.011
- Madejczyk, M., & Baralkiewicz, D. (2008). Characterization of Polish rape and honeydew honey according to their mineral contents using ICP-MS and F-AAS/AES. Analytica Chimica Acta, 617(1-2), 11–17. https://doi.org/https://doi.org/10.1016/j.aca.2008.01.038
- Makena, P. S., Pierce, S. C., Chung, K. T., & Sinclair, S. E. (2009). Comparative mutagenic effects of structurally similar flavonoids quercetin and taxifolin on tester strains Salmonella typhimurium TA102 and Escherichia coli WP-2 uvrA. Environmental and Molecular Mutagenesis, 50(6), 451–459. https://doi.org/https://doi.org/10.1002/em.20487
- Mărgăoan, R., Mărghitas, L., Al, Dezmirean, D. S., Bobis, O., & Mihai, C. M. (2012). Physical-Chemical composition of fresh bee pollen from Transylvania. Bulletin UASVM Animal Science and Biotechnologies, 69(1-2), 351–355.
- Mărghitaş, L. A., Stanciu, O. G., Dezmirean, D. S., Bobiş, O., Popescu, O., Bogdanov, S., & Campos, M. G. (2009). In vitro antioxidant capacity of honey bee-collected pollen of selected floral origin harvested from Romania. Food Chemistry, 115(3), 878–883. https://doi.org/https://doi.org/10.1016/j.foodchem.2009.01.014
- Markham, K., & Campos, M. G. (1996). 7- and 8-O-methylherbacetin-3-O-sophoroside from bee pollens and some structure/activity observations. Phytochemistry, 43(4), 763–767. https://doi.org/https://doi.org/10.1016/0031-9422(96)00286-5
- Markham, K. R., & Geiger, H. (1993). 1H nuclear magnetic resonance spectroscopy of flavonoids and their glycosides in hexadeuterodimethylsulphoxide. In J. B. Harborne (Ed.), The flavonoids: Advances in research since 1986. Chapman and Hall, pp. 441–496.
- Markowicz Bastos, D. H., Barth, M. O., Rocha, C. I., Cunha, I. B. S., Carvalho, P. O., Torres, E. A. S., & Michelan, M. (2004). Fatty acid composition and palynological analysis of bee (Apis) pollen loads in the states of São Paulo and Minas Gerais, Brazil. Journal of Apicultural Research, 43(2), 35–39. https://doi.org/https://doi.org/10.1080/00218839.2004.11101107
- Marsh, J., & Goode, J. A. (Eds.) (1994). Antimicrobial Peptides ICiba Foundation Symposium 186]. John Wiley & Sons.
- Martins, M. C. T., Morgano, M. A., Vincente, E., Baggio, S. R., & Rodriguez-Amaya, D. B. (2011). Physicochemical composition of bee pollen from eleven Brazilian states. Journal of Apicultural Science, 55(2), 107–116.
- Maruyama, H., Sakamoto, T., Araki, Y., & Hara, H. (2010). Anti-inflammatory effect of bee pollen ethanol extract from Cistus sp of Spanish on carrageenan-induced rat hind paw edema. BMC Complementary and Alternative Medicine, 10(1), 11. https://doi.org/https://doi.org/10.1186/1472-6882-10-30
- Matuschek, E., Brown, D. F. J., & Kahlmeter, G. (2014). Development of the EUCAST disk diffusion antimicrobial susceptibility testing method and its implementation in routine microbiology laboratories. Clinical Microbiology and Infection, 20(4), O255–O266. https://doi.org/https://doi.org/10.1111/1469-0691.12373
- Maurizio, A., & Louveaux, J. (1965). Pollens de plantes melliferes d’Europe (p. 148). Union des Groupements apicoles Français.
- McMurdie, P. J., & Holmes, S. (2013). phyloseq: An R package for reproducible interactive analysis and graphics of microbiome census data. PLoS One, 8(4), e61217. https://doi.org/https://doi.org/10.1371/journal.pone.0061217
- Mejías, E., & Montenegro, G. (2012). The antioxidant activity of Chilean honey and bee pollen produced in the Llaima volcano’s zonez. Journal of Food Quality, 35(5), 315–322. https://doi.org/https://doi.org/10.1111/j.1745-4557.2012.00460.x
- Melo, E. A., Filho, J. M., & Guerra, N. B. (2005) Characterization of antioxidant compounds in aqueous coriander extract (Coriandrum sativum L.). LWT—Food Science and Technology, 38, 15–19. https://doi.org/https://doi.org/10.1016/j.lwt.2004.03.011.
- Melo, I. L. P., & Almeida-Muradian, L. B. (2010). Stability of antioxidants vitamins in bee pollen samples. Química Nova, 33(3), 514–518. https://doi.org/https://doi.org/10.1590/S0100-40422010000300004
- Melo, I. L. P., & Almeida-Muradian, L. B. (2011). Comparison of methodologies for dried bee pollen's moisture determination. Ciência e Tecnologia de Alimentos, 31(1), 194–197. v. https://doi.org/https://doi.org/10.1590/S0101-20612011000100029
- Melo, I. L. P., Freitas, A. S., Barth, O. M., & Almeida-Muradian, L. B. (2009). Relação entre a composição nutricional e a origem floral de pólen apícola desidratado. [Correlation between nutritional composition and floral origin of dried bee pollen]. Revista Do Instituto Adolfo Lutz, 68, 346–353.
- Melo, A. A. M., Meira, D. F. S., Chan, J., Sattler, J. A. G., & Almeida-Muradian, L. B. (2012a). Comparação entre métodos de extração de compostos antioxidantes do pólen apícola desidratado. In: 11º Encontro de Química de Alimentos, Bragança. 11º Encontro de Química de Alimentos – Qualidade dos alimentos: novos desafios/Resumos, p. 65–65.
- Melo, A. A. M., Meira, D. F. S., Sattler, J. A. G., & Almeida-Muradian, L. B. (2012b). Atividade antioxidante do pólen apícola desidratado avaliada por diferentes métodos de extração. Mensagem Doce (Associação Paulista de Apicultores, Criadores de Abelhas Melificas Européias), São Paulo, p. 59, 22 maio.
- Melo, A. A. M., Meira, D. F. S., Sattler, J. A. G., & Almeida-Muradian, L. B. (2012c). Antioxidant activity of bee pollen produced in two Brazilian states [Paper presentation]. 5th European Conference of Apidology, Halle an Der Saale. EurBee 5 – 5th European Conference of Apidology (p. 223).
- Melo, A. A. M., Meira, D. F. S., Sattler, J. A. G., Almeida-Muradian, L. B. (2012d). Antioxidant activity of dehydrated bee pollen produced in Rio Grande do Sul state, Brazil. In II International Symposium on Bee Products/Annual Meeting of IHC, Bragança/Book of Abstracts (p. 75).
- Melo, A. A. M., Nagai, M. K., Chan, J., & Almeida-Muradian, L. B. (2013). Chemical composition, total phenolic compounds and antioxidant activity of dehydrated bee pollen produced in four Brazilian states. In XXXXIII International Apicultural Congress. Apimondia – Scientific Program/Posters.
- Menezes, J. D. S., Maciel, L. F., Miranda, M. S., & Druzian, J. I. (2010). Compostos bioactivos e potencial antioxidante de pólen apícola producido por abelhas africanizadas (Apis mellifera L.). Revista do Instituto Adolfo Lutz, 69(2), 233–242.
- Molyneux, P. (2004). The use of the stable free radical diphenylpicryl-hydracyl (DPPH) for estimating antioxidant activity. Songklanakarin Journal of Science and Technology, 26, 211–219.
- Montenegro, G., Pizarro, R., Mejías, E., & Rodríguez, S. (2013). Evaluación biológica de polen apícola de plantas de Chile. Revista Internacional de Botánica Experimental, 82, 7–14.
- Morais, M., Moreira, L., Feás, X., & Estevinho, L. M. (2011). Honeybee-collected pollen from five Portuguese Natural Parks: Palynological origin, phenolic content, antioxidant properties and antimicrobial activity. Food and Chemical Toxicology, 49(5), 1096–1101. https://doi.org/https://doi.org/10.1016/j.fct.2011.01.020
- Moreira, L., Dias, L. G., Pereira, J. A., & Estevinho, L. (2008). Antioxidant properties, total phenols and pollen analysis of propolis samples from Portugal. Food and Chemical Toxicology, 46(11), 3482–3485. https://doi.org/https://doi.org/10.1016/j.fct.2008.08.025
- Moreti, A. C. C. C., Marchini, L. C., Souza, V. C., & Rodrigues, R. R. (2002). Atlas do pólen de plantas apícolas. Papel Virtual.
- Moya, M., Koch, M., Hostetler, L. (1993). One-class classifier networks for target recognition applications. In Proceedings on World Congress on Neural Networks, International Neural Network Society (pp. 797–801).
- Mullins, J., & Emberlin, J. (1997). Sampling pollens. Journal of Aerosol Science, 28(3), 365–370. https://doi.org/https://doi.org/10.1016/S0021-8502(96)00439-9
- Mußmann, P., Levsen, K., & Radeck, W. (1994). Gas-chromatographic determination of phenols in aqueous samples after solid phase extraction. Fresenius' Journal of Analytical Chemistry, 348(10), 654–659. https://doi.org/https://doi.org/10.1007/BF00325568
- Muszynska, J., & Warakomska, Z. (1999). Honey bees in the monitoring of the environment’s contamination: I. The numerousness of the monitoring apiary giving samples of pollen loads, which are representative for a neighborhood rich in pollen flow. Pszczelnicze scientific notebooks – 1999. – Rok XLIII, pp. 197–208.
- Nagai, T., Inoue, R., Inoue, H., & Suzuki, N. (2002). Scavenging capacities of pollen extracts from Cistus ladanifeus on autoxidation, superoxide radicals, hydroxyl radicals, and DPPH radicals. Nutrition Research, 22(4), 519–526. https://doi.org/https://doi.org/10.1016/S0271-5317(01)00400-6
- Nagai, T., Nagashima, T., Suzuki, N., & Inoue, R. (2005). Antioxidant activity and angiotensin I-converting enzyme inhibition by enzymatic hydrolysates from bee bread. Zeitschrift fur Naturforschung. C, Journal of Biosciences, 60(1-2), 133–138. https://doi.org/https://doi.org/10.1515/znc-2005-1-224
- Nagy, M., Križková, L., Mučaji, P., Kontšeková, Z., Šeršeň, F., & Krajčovič, J. (2009). Antimutagenic activity and radical scavenging activity of water infusions and phenolics from ligustrum plants leaves. Molecules, 14(1), 509–518. https://doi.org/https://doi.org/10.3390/molecules14010509
- Natić, M. M., Dabić, D., Č; Papetti, A., Fotirić Akšić, M. M., Ognjanov, V., Ljubojević, M., & Tešić, Ž L. J. (2015). Analysis and characterisation of phytochemicals in mulberry (Morus alba L.) fruits grown in Vojvodina, North Serbia. Food Chemistry, 171, 128–136. https://doi.org/https://doi.org/10.1016/j.foodchem.2014.08.101
- Negri, G., Teixeira, E., Alves, M. L. T. F., Moreti, A. C. C. C., Otsuk, I. P., Borguini, R. G., & Salatino, A. (2011). Hydroxycinnamic acid amide derivatives, phenolic compounds and antioxidant activities of extracts of pollen samples from Southeast Brazil. Journal of Agricultural and Food Chemistry, 59(10), 5516–5522. https://doi.org/https://doi.org/10.1021/jf200602k
- Niki, E., & Noguchi, N. (2000). Evaluation of antioxidant capacity. What capacity is being measured by which method? IUBMB Life, 50(4-5), 323–329. https://doi.org/https://doi.org/10.1080/15216540051081119
- Nogueira, C., Iglesias, A., Feas, X., & Estevinho, L. M. (2012). Commercial bee pollen with different geographical origins: A comprehensive approach. International Journal of Molecular Sciences, 13(9), 11173–11187. https://doi.org/https://doi.org/10.3390/ijms130911173
- Nôžková, J., Brindza, J., Ostrovský, R., Stehlíková, B., & Fatrcová-Šramková, K. (2010). Hodnotenie kvantitatívnych a kvalitatívnych znakov včelieho peľu a ich klasifikácia podľa navrhnutých deskriptorov: Evaluation of quantitative and qualitative traits of bee pollen and their classification according to proposed list of descriptors. In Potravinárstvo. Združenie HACCP Consulting 2007: Nitrianske Hrnčiarovce, Slovensko. 4, 204–216.
- Nôžková, J., Ostrovský, R., Brindza, J., & Molnárová, E. (2010). Morfologická charakteristika včelích peľových obnôžok. In B. Brovarskyi (Ed.), Včelí obnôžkový peľ. SPU v Nitre (pp. 101–113).
- Nôžková, J., Pavelek, M., Bjelková, M., Brutch, N., Tejklová, E., Porokhovinova, E., & Brindza, J. (2011). Descriptor List for Flax – Linum usitatissimum L., Nitra (p. 104).
- Oh, S. M., & Chung, K. H. (2006). Antiestrogenic activities of Ginkgo biloba extracts. The Journal of Steroid Biochemistry and Molecular Biology, 100(4-5), 167–176. https://doi.org/https://doi.org/10.1016/j.jsbmb.2006.04.007
- Ohta, S., Fujimaki, T., Uy, M. M., Yanai, M., Yukiyoshi, A., & Hirata, T. (2007). Antioxidant hydroxycinnamic acid derivatives isolated from Brazilian bee pollen. Natural Product Research, 21(8), 726–732. https://doi.org/https://doi.org/10.1080/14786410601000047
- Oliveira, K. C. L. S., Moriya, M., Azedo, R. A. B., Almeida-Muradian, L. B., Teixeira, E. W., Alves, M. L. T. M. F., & Moreti, A. C. C. C. (2009). Relationship between botanical origin and antioxidants vitamins of bee-collected pollen. Química Nova, 32(5), 1099–1102. https://doi.org/https://doi.org/10.1590/S0100-40422009000500003
- Orsolić, N., Kosalec, I., & Basić, I. (2005). Synergistic antitumor effect of polyphenolic components of water soluble derivative of propolis against Ehrlich ascites tumour. Biological & Pharmaceutical Bulletin, 28(4), 694–700. https://doi.org/https://doi.org/10.1248/bpb.28.694
- Ostrosky, E. A., Mizumoto, M. K., Lima, M. E. L., Kaneko, T. M., Nishikawa, S. O., & Freitas, B. R. (2008). Métodos para avaliação da actividade antimicrobiana e determinação da concentração mínima inibitória (CMI) de plantas medicinais. Revista Brasileira de Farmacognosia, 18(2), 301–307. https://doi.org/https://doi.org/10.1590/S0102-695X2008000200026
- Otero, M. P., & Losada, S. B. (2002). Método de determinación del origen geográfico del polen apícola comercial. Lazaroa, 23, 25–34.
- Otsu, N. (1979). A threshold selection method from grey-level histograms. IEEE Transactions on Systems, Man, and Cybernetics, 9(1), 62–66. https://doi.org/https://doi.org/10.1109/TSMC.1979.4310076
- Ou, B., Hampsch-Woodill, M., & Prior, R. R. (2001). Development and validation of an improved oxygen radical absorbance capacity assay using fluorescein as the fluorescent probe. Journal of Agricultural and Food Chemistry, 49(10), 4619–4626. https://doi.org/https://doi.org/10.1021/jf010586o
- Ozcan, M., Ceylan, D. A., Unver, A., & Yetisir, R. (2003). Antifungal effect of pollen and propolis extracts collected from different regions of Turkey, Uludag. Bee Journal, 3, 27–34.
- Ozdal, T., Capanoglu, E., & Altay, F. (2013) A review on protein-phenolic interactions and associated changes. Food Research International, 51, 954–970. https://doi.org/https://doi.org/10.1016/j.foodres.2013.02.009.
- Pabla, N., Huang, S., Mi, Q.-S., Daniel, R., & Dong, Z. (2008). ATR-Chk2 Signaling in p53 Activation and DNA Damage Response during Cisplatin-induced Apoptosis. The Journal of Biological Chemistry, 283(10), 6572–6583. https://doi.org/https://doi.org/10.1074/jbc.M707568200
- Panetta, J. C. (1998). O caráter educativo da Vigilância Sanitária. Higiene Alimentar, 12(57), 8–10.
- Pantelić, M., Dabić, D., Matijašević, S., Davidović, S., Dojčinović, B., Milojković-Opsenica, D., Tešić, Ž., & Natić, M. (2014). Chemical characterization of fruit wine made from Oblačinska sour cherry. The Scientific World Journal, 2014, 454797–454799. https://doi.org/https://doi.org/10.1155/2014/454797
- Partap, U. (1997). Bee flora of the Hindu Kush-Himalayas: Inventory and management (p. 297). International Centre for Integrated Mountain Development.
- Pascoal, A., Rodrigues, S., Teixeira, A., Feás, X., & Estevinho, L. M. (2014). Biological activities of commercial bee pollens: Antimicrobial, antimutagenic, antioxidant and anti-inflammatory. Food and Chemical Toxicology, 63, 233–239. https://doi.org/https://doi.org/10.1016/j.fct.2013.11.010
- Paulino, N., Abreu, S. R., Uto, Y., Koyama, D., Nagasawa, H., Hori, H., Dirsch, V. M., Vollmar, A. M., Scremin, A., Bretz, W. A. (2008). Anti-inflammatory effects of a bioavailable compound, Artepillin C, in Brazilian propolis. European Journal of Pharmacology, 10;587(1–3), 296–301. doi: https://doi.org/10.1016/j.ejphar.2008.02.067. Epub 2008 Feb 29. PMID: 18474366.
- Paulo, L., Antunes, P., Campos, M. G., & Anjos, O. (2012). Utilização do Teor em Metais Pesados no Pólen Como Marcador Ambiental – Estudo Preliminar. II Congresso Ibérico de Apicultura, 18-20 Setembro, Guadalajara, pp. 75–76.
- Paulo, L., Antunes, P., & Anjos, O. (2014). Mineral composition of pollen using inductively coupled plasma atomic emission spectroscopy. Planta Medica, 80(16), 2–16. https://doi.org/https://doi.org/10.1055/s-0034-1394851
- Petersen, J., Souza, E. M. P., Moreira, R. M., Pasin, L. E. V., Nordi, J. C., & Barreto, L. M. R. C. (2011). Comercialização do pólen apícola em 11 países da America Latina. Magistra, Cruz das Almas-BA, 23(número especial), 14–16.
- Pichichero, E., Cicconi, R., Mattei, M., & Canini, A. (2011). Chrysin-induced apoptosis is mediated through p38 and Bax activation in B16-F1 and A375 melanoma cells. International Journal of Oncology, 38(2), 473–483. https://doi.org/https://doi.org/10.3892/ijo.2010.876
- Pinto, B., Bertoli, A., Noccioli, C., Garritano, S., Reali, D., & Pistelli, L. (2008). Estradiol-antagonistic activity of phenolic compounds from leguminous plants. Phytotherapy Research, 22(3), 362–366. https://doi.org/https://doi.org/10.1016/j.fct.2013.11.010.
- Pinto, B., Caciagli, F., Riccio, E., Reali, D., Sarić, A., Balog, T., Likić, S., & Scarpato, R. (2010). Antiestrogenic and antigenotoxic activity of bee pollen from Cystus incanus and Salix alba as evaluated by the yeast estrogen screen and the micronucleus assay in human lymphocytes. European Journal of Medicinal Chemistry, 45(9), 4122–4128. https://doi.org/https://doi.org/10.1016/j.ejmech.2010.06.001
- Plumb, R., Castro-Perez, J., Granger, J., Beattie, I., Joncour, K., & Wright, A. (2004). Ultra-performance liquid chromatography coupled to quadrupole-orthogonal time-of-flight mass spectrometry. Rapid Communications in Mass Spectrometry, 18(19), 2331–2337. https://doi.org/https://doi.org/10.1002/rcm.1627
- Prakash, A. S., Pereira, T. N., Reilly, P. E. B., & Seawright, A. A. (1999). Pyrrolizidine alkaloids in human diet. Mutation Research/Genetic Toxicology and Environmental Mutagenesis, 443(1-2), 53–76. https://doi.org/https://doi.org/10.1016/S1383-5742(99)00010-1
- Prior, R. L., Wu, X., & Schaich, K. (2005). Standardized methods for the determination of antioxidant capacity and phenolics in foods and dietary supplements. Journal of Agricultural and Food Chemistry, 53(10), 4290–4302. https://doi.org/https://doi.org/10.1021/jf0502698
- Prokudina, E. A., Havlíček, L., Al-Maharik, N., Lapčík, O., Strnad, M., & Gruz, J. (2012). Rapid UPLC–ESI–MS/MS method for the analysis of isoflavonoids and other phenylpropanoids. Journal of Food Composition and Analysis, 26(1-2), 36–42. https://doi.org/https://doi.org/10.1016/j.jfca.2011.12.001
- Qian, W. L., Khan, Z., Watson, D. G., & Fearnley, J. (2008). Analysis of sugars in bee pollen and propolis by ligand exchange chromatography in combination with pulse amperometric detection and mass spectrometry. Journal of Food Composition and Analysis, 21(1), 78–83. https://doi.org/https://doi.org/10.1016/j.jfca.2007.07.001
- Rabie, A. L., Wells, J. D., & Dent, L. K. (1983). The nitrogen content of pollen protein. Journal of Apicultural Research, 22(2), 119–123. https://doi.org/https://doi.org/10.1080/00218839.1983.11100572
- Rauha, J. P., Vuorela, H., & Kostiainen, R. (2001). Effect of eluent on the ionization efficiency of flavonoids by ion spray, atmospheric pressure chemical ionization, and atmospheric pressure photoionization mass spectrometry. Journal of Mass Spectrometry, 36(12), 1269–1280. https://doi.org/https://doi.org/10.1002/jms.231
- R Core Team. (2014). R: A language and environment for statistical computing. R Foundation for Statistical Computing. http://www.R-project.org/
- Reiter, R. (1947). The coloration of anther and corbicular pollen. The Ohio Journal of Science, 17(4), 137–152. http://hdl.handle.net/1811/3589
- Rex, J. H., Pfaller, M. A., Walsh, T. J., Chaturvedi, V., Espinel-Ingroff, A., Ghannoum, M. A., Gosey, L. L., Odds, F. C., Rinaldi, M. G., Sheehan, D. J., & Warnock, D. W. (2001). Antifungal susceptibility testing: Practical aspects and current challenges. Clinical Microbiology Reviews, 14(4), 643–658. https://doi.org/https://doi.org/10.1128/CMR.14.4.643-658.2001
- Royal Horticultural Society (RHS). 1966, 1986, 1995, 2004. RHS Color Chart. Royal Horticultural Society.
- Ricciardelli, D. G. (1982). Analisi organolettico-microscopica dei prodotti apistici: un problema attuale e indilazionabile. L'Ape Nosta Amica, 4, 19–21.
- Richardson, R. T., Lin, C.-H., Sponsler, D. B., Quijia, J. O., Goodell, K., & Johnson, R. M. (2015). Application of ITS2 metabarcoding to determine the provenance of pollen collected by honey bees in an agroecosystem. Applications in Plant Sciences, 3(1), 1400066. https://doi.org/https://doi.org/10.3732/apps.1400066
- Robards, K., & Antolovich, M. (1997). Analytical chemistry of fruit bioflavonoids. The Analyst, 122(2), 11R–34R. https://doi.org/https://doi.org/10.1039/a606499j
- Rochat, B. (2012). Quantitative/qualitative analysis using LC-HRMS: the fundamental step forward for clinical laboratories and clinical practice. Bioanalysis, 4(14), 1709–1711. https://doi.org/https://doi.org/10.4155/bio.12.159
- Rodlauer, R., & Hüttinger, E. (1992). A Computer-supported method of honey pollen analysis. Abstracts of the 8th International palynological Congress, France. p. 40.
- Rodríguez, I., Llompart, M. P., & Cela, R. (2000). Solid-phase extraction of phenols. Journal of Chromatography. A, 885(1-2), 291–304. https://doi.org/https://doi.org/10.1016/S0021-9673(00)00116-3
- Rodríguez-Damián, M., Cernadas, E., Formella, A., Fernández-Delgado, M., & Sá-Otero, P. D. (2006). Automatic detection and classification of grains of pollen based on shape and texture. IEEE Transactions on Systems, Man, and Cybernetics, Part C: Applications and Reviews, 36, 531–542. https://doi.org/https://doi.org/10.1109/TSMCC.2005.855426
- Rodríguez-Damián, M., Cernadas, E., Formella, A., Sá-Otero, P. (2004). Pollen classification using brightness-based and shape-based descriptors. IEEE Transactions on System, Man, and Cybernetics.
- Rodríguez-Damián, M., Formella, A., & Sá-Otero DE, P. (2004 Pollen classification using brightness-based and shape-based descriptors [Paper presentation]. Proceedings of the 17th International Conference on Pattern Recognition, ICPR 2004, Vol. 2, pp. 212–215. https://doi.org/https://doi.org/10.1109/ICPR.2004.1334098
- Rodríguez-Delgado, M. A., Malovaná, S., Pérez, J. P., Borges, T., & García-Montelongo, F. J. (2001). Separation of phenolic compounds by high-performance liquid chromatography with absorbance and fluorimetric detection. Journal of Chromatography. A, 912(2), 249–257. https://doi.org/https://doi.org/10.1016/S0021-9673(01)00598-2
- Rösemann, G. M., Botha, C. J., & Eloff, J. N. (2014). Distinguishing between toxic and non-toxic pyrrolizidine alkaloids and quantification by liquid chromatography–mass spectrometry. Phytochemistry Letters, 8, 126–131. https://doi.org/https://doi.org/10.1016/j.phytol.2014.03.002
- Rosenthal, C., Petrescu, A., & Caragiani, S. (1969). Cercetări ascupra compozitiei biochimice si valorii biologice a unui produs inlocuitor de pollen. Apicultura, 22(8), 18–21.
- Rouessac, F., & Rouessac, A. (2007). Sample preparation: Solid phase extraction (SPE). In Francis, A. Rouessac, & S. Brooks (Trans.), Chemical analysis – Modern instrumentation methods and techniques (2nd ed., chapter 21 pp. 487–490). John Wiley & Sons, Ltd.
- Rzepecka-Stojko, A., Pilawa, B., Ramos, P., & Stojko, J. (2012). Antioxidative properties of bee pollen extracts examined by EPR spectroscopy. Journal of Apicultural Science, 56(1), 23–30. https://doi.org/https://doi.org/10.2478/v10289-012-0003-0
- Rzepecka-Stojko, A., Stec, M., Kurzeja, E., Gawrońska, E., Pawlowska-Goral, K. (2012). The effect of storage of bee pollen extracts on polyphenol content. Polish Journal of Environmental Studies, 21(4), 1007–1011. http://www.pjoes.com/pdf/21.4/Pol.J.Environ.Stud.Vol.21.No.4.1007-1011.pdf
- Sahin, H., Aliyazicioglu, R., Yildiz, O., Kolayli, S., Innocenti, A., & Supuran, C. T. (2011). Honey, pollen, and propolis extracts show potent inhibitory activity against the zinc metalloenzyme carbonic anhydrase. Journal of Enzyme Inhibition and Medicinal Chemistry, 26(3), 440–444. https://doi.org/https://doi.org/10.3109/14756366.2010.503610
- Salamanca, G., Moreno, C., Quiralte, J., Barber, D., Villalba, M., & Rodriguez, R. (2008). Immunological characterisation of Ole e 11, a major olive pollen allergen. Allergy, 63, 500.
- Sánchez, E. T. (2004). Polen: Producción Envasado y Comercialización.
- Sánchez-Moreno, C. (2002). Methods used to evaluate the free radical scavenging activity in foods and biological systems. Food Science and Technology International, 8(3), 121–137.
- Sánchez-Moreno, C., Larrauri, J. A., & Saura-Calixto, F. (1998). A procedure to measure the antiradical efficiency of polyphenols. Journal of the Science of Food and Agriculture, 76(2), 270–276. https://doi.org/https://doi.org/10.1002/(SICI)1097-0010(199802)76:2 < 270::AID-JSFA945 > 3.0.CO;2-9
- Santana, C. M., Ferrera, Z. S., Torres Padrón, M. E., & Santana Rodríguez, J. J. (2009). Methodologies for the extraction of phenolic compounds from environmental samples: New approaches. Molecules, 14(1), 298–320. https://doi.org/https://doi.org/10.3390/molecules14010298
- Sattler, J. A. G. (2013). Quantificatio of antioxidant vitamins E (alpha-, beta-, gama- and delta-tocopherol), C (ascorbic acid), provitamin A (alpha- and beta-carotene) and chemical composition of dehydrated bee pollen produced in georeferenced apiaries of southern Brazil [Master dissertation]. University of São Paulo. Retrieved July 7, 2014, from http://www.teses.usp.br/teses/disponiveis/9/9131/tde-18032014-151137/
- Sawyer, R. (1981). Pollen identification for beekeepers (p. 112). University College Cardiff Press.
- Sawyer, R. (1988). Honey identification (p. 115). Cardiff Academic Press.
- Schieber, A., Keller, P., Streker, P., Klaiber, I., & Carle, R. (2002). Detection of isorhamnetin glycosides in extracts of apples (Malus domestica cv. "Brettacher") by HPLC-PDA and HPLC-APCI-MS/MS. Phytochemical Analysis, 13(2), 87–94. https://doi.org/https://doi.org/10.1002/pca.630
- Scorzoni, L., Benaducci, T., Almeida, A. M. F., Silva, D. H. S., Bolzani, V. S., & Gianinni, M. J. (2007). The use of standard methodology for determination of antifungal activity of natural products against medical yeasts Candida sp. and Cryptococcus sp. Brazilian Journal of Microbiology, 38, 391–397. https://doi.org/https://doi.org/10.1590/S1517-83822007000300001.
- Serra-Bonvehí, J., & Escolá Jordá, R. (1997). Nutrient composition and microbiological quality of honey bee-collected pollen in Spain. Journal of Agricultural and Food Chemistry, 45(3), 725–732. https://doi.org/https://doi.org/10.1021/jf960265q
- Serra-Bonvehí, J., Gonello Galindo, J., & Gomez Pajuelo, A. (1986). Estudio de la composition y caracteristicas fisico-quimicas del pollen de abejas. Alimentaria, 23(176), 63–67.
- Serra-Bonvehí, J., Torrentó, S. M., & Lorente, C. E. (2001). Evaluation of polyphenolic and flavonoid compounds in honey bee – Collected pollen produced in Spain. Journal of Agricultural and Food Chemistry, 49(4), 1848–1853. https://doi.org/https://doi.org/10.1021/jf0012300
- Sharma, M. (1970). An analysis of pollen loads of honey bees from Kangra, India. Grana, 10(1), 35–42. https://doi.org/https://doi.org/10.1080/00173137009429855
- Sharma, O. P., & Bhat, T. K. (2009). DPPH antioxidant assay revisited. Food Chemistry, 113(4), 1202–1205. https://doi.org/https://doi.org/10.1016/j.foodchem.2008.08.008
- Shaw, D. E. (1990). The incidental collection of fungal spores by bees and the collection of spores in lieu of pollen. Bee World, 71(4), 158–176. https://doi.org/https://doi.org/10.1080/0005772X.1990.11099059
- Shi, H. B., Kong, M., Chen, G., Zhao, J., Shi, H. L., Chen, Y., & Rowan, F. G. (2010). Compound pollen protein nutrient increases serum albumin in cirrhotic rats. Gastroenterology Research, 3(6), 253–261. https://doi.org/https://doi.org/10.4021/gr240e
- Shoskes, D. A. (2002). Phytotherapy in chronic prostatitis. Urology, 60(6 Suppl), 35–37. https://doi.org/https://doi.org/10.1016/S0090-4295(02)02383-X
- Sickel, W., Ankenbrand, M. J., Grimmer, G., Holzschuh, A., Härtel, S., Lanzen, J., Steffan-Dewenter, I., & Keller, A. (2015). Increased efficiency in identifying mixed pollen samples by meta-barcoding with a dual-indexing approach. BMC Ecology, 15, 20. https://doi.org/https://doi.org/10.1186/s12898-015-0051-y
- Siddik, Z. (2003). Cisplatin: mode of cytotoxic action and molecular basis of resistance. Oncogene, 22(47), 7265–7279. https://doi.org/https://doi.org/10.1038/sj.onc.1206933
- Silici, S., & Kutluca, S. (2005). Chemical composition and antibacterial activity of propolis collected by three different races of honeybees in the same region. Journal of Ethnopharmacology, 99(1), 69–73. https://doi.org/https://doi.org/10.1016/j.jep.2005.01.046
- Silva, E. N. (1999). Tecnologia de alimentos. Higiene na indústria de alimentos. Unicamp- Campinas. 5.
- Silva, J. A. (2000). Tópicos da tecnologia de alimentos. São Paulo: Livraria Varela, 229. 82 pp.
- Silva, T. M. S., Camara, C. A., da Silva Lins, A. C., Maria Barbosa-Filho, J., da Silva, E. M. S., Freitas, B. M., & de Assis Ribeiro dos Santos, F. (2006). Chemical composition and free radical scavenging activity of pollen loads from stingless bee Melipona subnituda Ducke. Journal of Food Composition and Analysis, 19(6-7), 507–511. https://doi.org/https://doi.org/10.1016/j.jfca.2005.12.011
- Silva, T. M. S., Camara, C. A., Lins, A. C. S., Agra, M. F., Silva, E. M. S., Reis, I. T., & Freitas, B. M. (2009). Chemical composition, botanical evaluation and screening of radical scavenging activity of collected pollen by the stingless bees Melipona rufiventris (Uruçu-amarela)). Anais da Academia Brasileira de Ciencias, 81(2), 173–178. https://doi.org/https://doi.org/10.1590/s0001-37652009000200003
- Silva, C. I., Bordon, N. G., da, R., Filho, L. C., & Garófalo, C. A. (2012). The importance of plant diversity in maintaining the pollinator bee, Eulaema nigrita (Hymenoptera: Apidae) in sweet passion fruit fields. Revista de Biologia Tropical, 60(4), 1553–1565.
- Smirnova, V. A., Timofeyev, N. K., Breygina, M. A., Matveyeva, N. P., & Yermakov, P. I. (2012). Antioxidant properties of the pollen exine polymer matrix. Biophysics, 57(2), 174–178. https://doi.org/https://doi.org/10.1134/S0006350912020224
- Snyder, R. D., & Gillies, P. J. (2002). Evaluation of the clastogenic, DNA intercalative, and topoisomerase II-interactive properties of bioflavonoids in Chinese hamster V79 cells. Environmental and Molecular Mutagenesis, 40(4), 266–276. https://doi.org/https://doi.org/10.1002/em.10121
- Solberg, Y., & Remedios, G. (1980). Chemical composition of pure and bee-collected pollen. Scientific Reports Agricultural University, Norway, 59(18), 1–13.
- Somerville, D. C. (2001). Nutritional value of bee collected pollens, a report for the Rural Industries Research and Development Corporation # 01/047 (pp. 57–58). NSW Agriculture Goulburn.
- Somerville, D. C., & Nicol, H. I. (2002). Mineral content of honey bee collected pollen from southern New South Wales. Australian Journal of Experimental Agriculture, 42(8), 1131–11136. https://doi.org/https://doi.org/10.1071/EA01086
- Soto-Vaca, A., Gutierrez, A., Losso, J. N., Xu, Z., & Finley, J. W. (2012). Evolution of phenolic compounds from color and flavor problems to health benefits. Journal of Agricultural and Food Chemistry, 60(27), 6658–6677. https://doi.org/https://doi.org/10.1021/jf300861c
- Souza, B. R. (2014). Quantification of B complex vitamins (B1, B2) and vitamers of vitamin B3 and B6 in dehydrated bee pollen samples from Southern Brazil [Master dissertation]. University of São Paulo.
- Souza, E. H., Souza, F. V. D., Rossi, M. L., Packer, R. M., Cruz-Barros, M. A. V., & Martinelli, A. P. (2018) Pollen morphology and viability in Bromeliaceae. Annals of the Brazilian Academy of Sciences, 89(4), 3067–3082. https://doi.org/http://dx.doi.org/10.1590/0001-3765201720170450.
- Sparkman, O. D. (2000). Mass spectrometry desk reference. Global View Pub. http://www.amazon.com/exec/obidos/ASIN/0966081323/102-8754827-3860108
- Stalikas, C. D. (2007). Extraction, separation, and detection methods for phenolic acids and flavonoids. Journal of Separation Science, 30(18), 3268–3295. https://doi.org/https://doi.org/10.1002/jssc.200700261
- Stanciu, O. G., Marghitas, L. A., Dezmirean, D., & Campos, M. G. (2011). A comparison between the mineral content of flower and honey bee collected pollen of selected plant origin (Helianthus annuus L. and Salix sp.). Romanian Biotechnological Letters, 16(4), 6291–6296.
- Stanciu, O. G., Marghitas, L. A., & Dezmirean, D. (2012). Nutritional and biological values of bee pollen and beebread harvested from Romania. In Proceedings of International Conference of Agricultural Engineering CIGR-AGENG. http://journals.usamvcluj.ro/index.php/zootehnie/article/viewFile/9391/7820
- Stanciu, O. G., Marghitas, L. A., Dezmirean, D., & Campos, M. G. (2012). Specific distribution of minerals in selected unifloral bee pollen. Food Science and Technology Letters, 3(1), 27–31.
- Stanley, R. G., & Linskens, H. F. (1974). Pollen – Biology, biochemistry, management (p. 307). Springer-Verlag. https://doi.org/https://doi.org/10.1007/978-3-642-65905-8
- Szczêsna, T. (2006a). Long – Chain fatty acids composition of honey bee-collected pollen. Journal of Apicultural Science, 50, 65–78.
- Szczêsna, T. (2006b). Protein content and amino acid composition of bee-collected pollen from selected botanical origins. Journal of Apicultural Science, 50, 81–90.
- Szczêsna, T. (2006c). Protein content and amino acids composition of bee-collected pollen originating from Poland, South Korea and China. Journal of Apicultural Science, 50, 91–99.
- Szczęsna, T. (2007). Study on the sugar composition of honey-bee-collected pollen. Journal of Apicultural Science, 51(1), 15–21.
- Szczęsna, T., & Rybak-Chmielewska, H. (1998). Some properties of honey bee collected pollen. In Polnisch-Deutsches Symposium Salus Apis Mellifera, new demands for honey bee breeding in the 21st century. Pszczelnicze Zeszyty Naukowe, 42(2), 79–80.
- Szczęsna, T., Rybak-Chmielewska, H., & Chmielewski, W. (2002). Sugar composition of pollen loads harvested at different periods of the beekeeping season. Journal of Apicultural Science, 46(2), 107–115.
- Szczęsna, T., Rybak-Chmielewska, H., & Skowronek, W. (1995a). Wpływ utrwalania na wartość biologiczną obnóży pyłkowych. Pszczelnicze Zeszyty Naukowe, 39(1), 177–187.
- Szczęsna, T., Rybak-Chmielewska, H., & Skowronek, W. (1995b). Zmiany w składzie chemicznym obnóży pyłkowych zachodzące podczas ich przechowywania w różnych warunkach. I. Cukry, tłuszcze, popiół. Pszczelnicze Zeszyty Naukowe, 39(2), 145–156.
- Taha, E. A. (2015). Chemical composition and amounts of mineral elements in honey bee-collected pollen in relation to botanical origin. Journal of Apicultural Science, 59(1), 75–81. https://doi.org/https://doi.org/10.1515/JAS-2015-0008
- Tax, D. (2011). DDtools, the data description toolbox for Matlab. Version 1.9.0.
- Thakur, M., & Nanda, V. (2020). Composition and functionality of bee pollen: A review. Trends in Food Science & Technology, 98, 82–106. https://doi.org/https://doi.org/10.1016/j.tifs.2020.02.001
- Tian, S., Nakamura, K., Cui, T., & Kayahara, H. (2005). High-performance liquid chromatographic determination of phenolic compounds in rice. Journal of Chromatography. A, 1063(1-2), 121–128. https://doi.org/https://doi.org/10.1016/j.chroma.2004.11.075
- Tichy, J., & Novak, J. (2000). Detection of antimicrobials in bee products with activity against viridans streptococci. Journal of Alternative and Complementary Medicine, 6(5), 383–389. https://doi.org/https://doi.org/10.1089/acm.2000.6.383
- Tohamy, A. A., Abdella, E. M., Ahmed, R. R., & Ahmed, Y. K. (2014). Assessment of anti-mutagenic, anti-histopathologic and antioxidant capacities of Egyptian bee pollen and propolis extracts. Cytotechnology, 66(2), 283–297. https://doi.org/https://doi.org/10.1007/s10616-013-9568-0
- Tripathi, S. K. M., Kumar, M., Kedves, M., & Varga, B. (2003). LM, SEM and TEM investigations on partially degraded pollen grains of Cycas rumphii Miq. from India. Plant Cell Biology and Development, Szeged, 15, 28–42.
- Uhl, M., Ecker, S., Kassie, F., Lhoste, E., Chakraborty, A., Mohn, G., & Knasmüller, S. (2003). Effect of chrysin, a flavonoid compound, on the mutagenic activity of 2-amino-1-methyl-6-phenylimidazo[4,5- b]pyridine (PhIP) and benzo(a)pyrene (B(a)P) in bacterial and human hepatoma (HepG2) cells. Archives of Toxicology, 77(8), 477–484. https://doi.org/https://doi.org/10.1007/s00204-003-0469-4
- Ulusoy, E., & Kolayli, S. (2014). Phenolic composition and antioxidant properties of anzer bee pollen. Journal of Food Biochemistry, 38(1), 73–82. https://doi.org/http://dx.doi.org/10.1111/jfbc.12027 https://doi.org/https://doi.org/10.1111/jfbc.12027
- Valentini, A., Miquel, C., & Taberlet, P. (2010). DNA barcoding for honey biodiversity. Diversity, 2(4), 610–617. https://doi.org/https://doi.org/10.3390/d2040610
- van Laere, O., Lagasse, A., & de Mets, M. (1969). Use of the scanning electron microscope for investigating pollen grains isolated from honey samples. Journal of Apicultural Research, 8(3), 139–145. https://doi.org/https://doi.org/10.1080/00218839.1969.11100230
- van Meeuwen, J. A., Korthagen, N., De Jong, P. C., Piersma, A. H., & van den Berg, M. (2007). (Anti)estrogenic effects of phytochemicals on human primary mammary fibroblasts, MCF-7 cells and their co-culture. Toxicology and Applied Pharmacology, 221(3), 372–383. https://doi.org/https://doi.org/10.1016/j.taap.2007.03.016
- van Rijsbergen, C. (1979). Information retrieval. Butterworths.
- Villanueva, G. (1999). Pollen resources used by European and Africanized honey bees in the Yucatan peninsula. Mexico. Journal of Apicultural Research, 38(1-2), 105–111. https://doi.org/https://doi.org/10.1080/00218839.1999.11101001
- Villanueva, M. T. O., Díaz Marquina, A., Bravo Serrano, R., & Blazquez Abellán, G. (2002). The importance of bee-collected pollen in the diet: A study of its composition. International Journal of Food Sciences and Nutrition, 53(3), 217–224. https://doi.org/https://doi.org/10.1080/09637480220132832
- Vorwohl, G. (1990). Progress, problems and future tasks of Melissopalynologie. Apidologie, 21(5), 383–389. (Article in German). https://doi.org/https://doi.org/10.1051/apido:19900501
- Wang, L., & Weller, C. L. (2006). Recent advances in extraction of nutraceuticals from plants. Trends in Food Science & Technology, 17(6), 300–312. https://doi.org/https://doi.org/10.1016/j.tifs.2005.12.004
- Wang, Q., Garrity, G. M., Tiedje, J. M., & Cole, J. R. (2007). Naive Bayesian classifier for rapid assignment of rRNA sequences into the new bacterial taxonomy. Applied and Environmental Microbiology, 73(16), 5261–5267. https://doi.org/https://doi.org/10.1128/AEM.00062-07
- Wang, S., Xie, B., Yin, L., Duan, L., Li, Z., Eneji, A. E., Tsuji, W., & Tsunekawa, A. (2010). Increased UV-B radiation affects the viability, reactive oxygen species accumulation and antioxidant enzyme activities in maize (Zea mays L.) pollen. Photochemistry and Photobiology, 86(1), 110–116. https://doi.org/https://doi.org/10.1111/j.1751-1097.2009.00635.x
- Wang, W., Hu, J., Cheng, J. (1987). Biological effect of pollen from beehives radioprotective effect on hematopoietic tissues of irradiated mice. In Proceedings of the 31st International Apicultural Congress Apimondia, p. 176.
- Wasek, M., Nartowska, J., Wawer, I., & Tudruj, T. (2001). Electron spin resonance assessment of the antioxidative potential of medicinal plants. Part 1. Contribution of anthocyanosides and flavonoids to the radical scavenging ability of fruits and herbal teas. Acta Poloniae Pharmaceutica, 58(4), 283–288.
- Wiegand, I., Hilpert, K., & Hancock, R. E. W. (2008). Agar and broth dilution methods to determine the minimal inhibitory concentration (MIC) of antimicrobial substances. Nature Protocols, 3(2), 163–175. https://doi.org/https://doi.org/10.1038/nprot.2007.521
- Wilkins, T. D., & Thiel, T. (1973). Modified broth-disk method for testing the antibiotic susceptibility of anaerobic bacteria. Antimicrobial Agents and Chemotherapy, 3(3), 350–356. https://doi.org/https://doi.org/10.1128/AAC.3.3.350
- Williams, N. M., & Kremen, C. (2007). Resource distributions among habitats determine solitary bee offspring production in a mosaic landscape. Ecological Applications, 17(3), 910–921. https://doi.org/https://doi.org/10.1890/06-0269
- Witten, I. H., & Frank, E. (2005). Data mining: Practical machine learning tools and techniques. (2nd ed.). Morgan Kaufmann. https://doi.org/https://doi.org/10.1016/b978-0-12-374856-0.00023-7
- Xiong, A., Yang, L., He, Y., Zhang, F., Wang, J., Han, H., Wang, C., Bligh, S. W. A., & Wang, Z. (2009). Identification of metabolites of adonifoline, a hepatotoxic pyrrolizidine alkaloid, by liquid chromatography/tandem and high-resolution mass spectrometry. Rapid Communications in Mass Spectrometry, 23(24), 3907–3916. https://doi.org/https://doi.org/10.1002/rcm.4329
- Yamaguchi, M., Uchiyama, S., & Nakagawa, T. (2007). Preventive effects of bee pollen Cistus iadaniferus extract on bone loss in ovariectomized rats in vivo. Journal of Health Science, 53(5), 571–575. https://doi.org/https://doi.org/10.1248/jhs.52.268
- Yáñez, Y. A., Remsberg, C. M., Takemoto, J. K., Vega-Villa, K. R., Andrews, P. K., Sayre, C. L., Yang, K., Wu, D., Liu, D., Chen, J., & Sun, P. (2013). Characterization of chemical composition of bee pollen in China. Journal of Agricultural and Food Chemistry, 61(3), 708–718. https://doi.org/https://doi.org/10.1021/jf304056b
- Yang, W. Z., Qiao, X., Bo, T., Wang, Q., Guo, D. A., & Ye, M. (2014). Low energy induced homolytic fragmentation of flavonol 3-O-glycosides by negative electrospray ionization tandem mass spectrometry. Rapid Communications in Mass Spectrometry, 28(4), 385–395. https://doi.org/https://doi.org/10.1002/rcm.6794
- Yerlikaya, O. (2014). Effect of bee pollen supplement on antimicrobial, chemical, rheological, sensorial properties and probiotic viability of fermented milk beverages. Mljekarstvo, 64(4), 268–279. https://doi.org/https://doi.org/10.15567/mljekarstvo.2014.0406
- Youssef, A. M., Farag, R. S., Ewies, M. A., & El-Shakaa, S. M. A. (1978). Chemical studies on pollen collected by honey bees in Giza region, Egypt. Journal of Apicultural Research, 17(3), 110–113. https://doi.org/https://doi.org/10.1080/00218839.1978.11099914
- Yu, L. (2001). Free radical scavenging properties of conjugated linoleic acids. Journal of Agricultural and Food Chemistry, 49(7), 3452–3456. https://doi.org/https://doi.org/10.1021/jf010172v
- Zhang, X., Habib, F. K., Ross, M., Burger, U., Lewenstein, A., Rose, K., & Jaton, J. (1995). Isolation and characterization of a cyclic hydroxamic acid from a pollen extract, which inhibits cancerous cell growth in vitro. Journal of Medicinal Chemistry, 38(4), 735–738. https://doi.org/https://doi.org/10.1021/jm00004a019
Appendix:
authors
1. Introduction
Maria Graça R Campos, Ofélia Anjos and Norman L Carreck
2. Producing bee pollen from harvest to storage
Lidia M R C Barreto, Maria G R Campos and João C Nordi
3. Inexpensive pollen load authentication by means of computer vision and machine learning
Manuel Chica and Pascual Campoy
4. Evaluation and classification of corbicular pollen morphology
Janka Nozkova
5. Identification of the floral origin of bee pollen by microscopy
Olena Lokutova, Maria G R Campos, Ananias Pascoal, Letícia M Estevinho
6. Phenolic and polyphenolic profiles as fingerprints of floral origin of bee pollen
Maria G R Campos, Norma Almaraz-Abarca, Lígia Muradian-Bicudo and Ofélia Anjos
7. Determination of phenolic profile of bee pollen extracts by LC and LC/MS
Živoslav Lj Tešić, Mirjana D Mosić, Aleksandar Ž Kostić, Mirjana B Pešić, Dušanka M Milojković-Opsenica
8. Standard method for identification of bee pollen mixtures through meta-barcoding
Wiebke Sickel, Markus J Ankenbrand, Gudrun Grimmer, Frank Förster, Ingolf Steffan-Dewenter and Alexander Keller
9. Standard method for the determination of protein content of pollen using the Kjeldahl method
Chrysoula H Tananaki, Vasilios Liolios, Dimitrios Kanelis, Maria-Anna Rodopoulou and Andreas Thrasyvoulou
10. Standard method for determination of lipid content of pollen using Soxhlet extraction
Chrysoula H Tananaki, Vasilios Liolios, Dimitrios Kanelis, Maria-Anna Rodopoulou and Andreas Thrasyvoulou
11. Determination of the content of sugars in pollen, using HPLC-RID
Teresa Szczęsna
12. Standard method for vitamin analysis in bee pollen
Ligia Bicudo de Almeida-Muradian
13. Standard methods for mineral and trace elements in bee pollen
Ofélia Anjos, Luísa Paulo and Maria Graça Campos
14. Standard methods for pyrrolizidine alkaloid profiling in pollen by UHPLC-HRMS
Matteo A Lucchetti, Christina Kast and Gaetan Glauser
15. Standard methods for total phenolic compounds, total flavonoids and antioxidative capacity bee pollen evaluation by FTIR-ATR Spectroscopy
Ofélia Anjos and Letícia M Estevinho
16. Standard methods for determination of antioxidant bioactivity of bee pollen
Norma Almaraz-Abarca, Ligia Bicudo de Almeida-Muradian and Maria G Campos
17. Standard methods for anti-inflammatory activities in bee pollen
Ananias Pascoal, Vanessa Branco Paula and Letícia M Estevinho
18. Standard methods for antimicrobial activities in bee pollen
Ananias Pascoal, Vanessa Branco Paula and Letícia M Estevinho
19. Determination of standard methods for anti-mutagenic activities in bee pollen
Ananias Pascoal, Vanessa Branco Paula and Letícia M Estevinho