
 ?Mathematical formulae have been encoded as MathML and are displayed in this HTML version using MathJax in order to improve their display. Uncheck the box to turn MathJax off. This feature requires Javascript. Click on a formula to zoom.
Abstract
We develop a framework for mapping and analysing informal worker skills using microdata from nearly 1500 workers residing in the slums of Bangalore, India. Alongside econometric modelling, we employ machine learning techniques to explore relationships between skills crowdsourced from respondents. We find that informal workers rely on a host of task, language, personal and social skills. Further, we identify skill claims associated with both levels and stability of wage earnings. Our results include insights on gender disparities in skill claims, importance of English and computer literacy and the central role of personal and social skills in the Indian informal labour market.
1. Introduction
Over of the Indian labour force comprises informal workers (Sengupta et al., Citation2009)Footnote1 that are employed without formal contracts and typically without social security benefits. Informal employment is restricted not only to the “informal sector’ but also forms a large proportion of formal sector jobs (Sheikh & Gaurav, Citation2020). The urban informal sector in particular plays a crucial role in providing livelihood to migrant workers and low-income households in urban slums (Gaurav & Sheikh, Citation2019; Roy et al., Citation2018). With approximately
million joining the workforce every year and a growing informal sector (Himanshu, Citation2011; Mehrotra, Parida, Sinha, & Gandhi, Citation2014), India faces an unprecedented labour matching challenge. Less than
of the workforce of over
million have formal vocational training (Santosh Mehrotra, Citation2013). While several programmes for imparting skills training have been implemented in recent years,Footnote2 they have been plagued by a plethora of issues including poor assessment of skill demands, lack of skilled trainers, poor placement records, absence of apprenticeship programmes and poor coordination among multiple stakeholders (Prasad et al., Citation2017).
Empirical research on skilling of informal sector workers or workers employed informally is sparse.Footnote3 Pilz, Gengaiah, and Venkatram (Citation2019) study skill development among street food vendors and highlight the importance of informal skilling and apprenticeship. Kaur, Kremer, and Mullainathan (Citation2015) study the effects of a specific noncognitive attribute, self-control at work, on worker output and effort among data entry workers. Adhvaryu, Kala, and Nyshadham (Citation2018) estimate the causal effect of a soft skills training programme on productivity and wages for female garment workers. While each of these studies is highly context specific, taken together this research suggests a complex system of skills; both personal and social, that are associated with employment, productivity, and well-being.
Quantitative studies on the association between wages and training programmes in India find mixed evidence (see for instance Agrawal (Citation2012), Kumar, Mandava, and Gopanapalli (Citation2019), Adhvaryu et al. (Citation2018)). A crucial component of the training programmes analysed in these studies is the actual list of skills being trained for, which are typically sourced from experts in a top-down manner.Footnote4 By contrast, anthropological and ethnographic research is more concerned with a bottom-up approach to understanding skills and training given specific contexts (see, for example, Okada (Citation2004), Darrah (Citation2013), Garrido, Sullivan, and Gordon (Citation2010)). This second qualitative approach produces rich contextual insights but has been typically unable to produce distributional results for larger populations and contexts as from quantitative approaches.
Our study has a two-fold objective. First, mapping the distribution of skills among informal workers. Second, understanding to what extent diverse skills are associated with labour market outcomes as measured by higher and stable wages. We collect primary data from slums in Bangalore, India.Footnote5 To attain these objectives, we discover and map skills that workers perceive to be valued in the labour market. These skills range from language skills, general and specific task skills to cultivated personal and social capacities. We examine if skills are clustered in their self-reportage and the degree to which they correlate with labour market outcomes. To our knowledge this is among the first attempts to empirically analyse informal workers’ skills – including non-cognitive skills and personal qualities – within a developing economy labour market context.
Data are collected in two stages – in the first stage, workers provide information on their employment and training histories, their demographic characteristics and a battery of general skills and talents. In this stage we also crowdsource diverse task-related skills, knowledge and personal or social capacities that respondents associate with value in the labour market. This crowdsourced list of skills then becomes a critical input for the second stage of data collection where we conduct another survey that collects workers’ self-assessment regarding the most frequent crowdsourced skills from the first round along with a shorter survey on demographic characteristics and employment outcomes.
The most striking results from our paper signal the gender disparity in skill claims in the urban informal labour market. We find also that workers rely on a host of task, language, personal and social skills to navigate the informal labour market. We note that English language and computer literacy skill claims are consistently associated with better job outcomes, along with a variety of ‘soft skills’. We posit that discovering the nature and variety of these so-called ‘soft’ skills, their complex relationships and complementarities, will facilitate training and staffing outcomes that improve human welfare. Our distributional results suggest the following policy implications: (1) developing large-scale financial and computer literacy programmes targeted specifically at women; (2) retiring the concept of ‘unskilled’ when referring to informal workers. Our correlational results indicate the need for further research to estimate the causal impact of soft skills, English language skills and computer literacy skills training on informal labour market outcomes.
Our work makes the following novel contributions to the literature. First, our paper adds to the growing literature on the association of soft and general task skills with critical labour market outcomes, placing the spotlight on a hitherto unexplored population – informal workers in urban India. Second, along with standard econometric methods, our study utilises machine learning techniques particularly well suited to the study of complex relationships among skills. In doing so, our study marks an initial attempt to collect and analyse primary data with a view towards machine learning application. Third, our unique data allows us to analyse the skills space from a multi-dimensional perspective. To our knowledge this is the first attempt to apply a quantitative, bottom-up approach to understanding the distribution of skills in the Indian informal labour market.
We make an important methodological contribution to the literature by introducing a novel collaborative survey design that combines the context specificity of qualitative ethnographic techniques with the ability of quantitative survey techniques to produce distributional results. The design and analysis techniques from this paper can be modified and applied to describe and study other developing world contexts, particularly those with substantial heterogeneity. While the tension between qualitative and quantitative approaches towards social science research has been of marked interest to social scientists traditionally (Schuman and Presser (Citation1979), Schuman and Scott (Citation1987), Converse (Citation1984)), recent attempts have been made to use machine learning techniques that reconcile the benefits of each (Popping (Citation2015), Salganik and Levy (Citation2015)). Our paper adds to this burgeoning literature by introducing a framework that bridges quantitative and qualitative approaches by incorporating crowdsourcing and machine learning.
Although literature on skills in India is scant, the study of skills and labour market outcomes has received much attention globally, especially in the context of the US labour market (Borghans, Duckworth, Heckman, & ter Weel, Citation2008; Cunha & Heckman, Citation2007; Cunha, Heckman, & Schennach, Citation2010; Heckman & Rubinstein, Citation2001). Heckman and Kautz (Citation2012) emphasise the role of ‘soft’ social and personal capacities in predicting many dimensions of success. Weinberger (Citation2014) finds complementarity between cognitive and social skills using data linking adolescent skill endowments to adult outcomes. Deming (Citation2017) uses US National Longitudinal Survey of Youth and Occupational Information Network (O*NET) data to show that labour market returns to social skills are increasing over time. Börner et al. (Citation2018) analyse millions of publications, course syllabi, and job advertisements to shed light on skill discrepancies between research, education and jobs in the US, revealing a disconnect between the demand for social and communication skills and their limited supply in education and research. While personal and social qualities such as grit, positive demeanour, and social confidence are sometimes viewed as unalterable and unmeasurable traits, the demonstrated clinical success of approaches like cognitive-behavioural therapy (Butler, Chapman, Forman, & Beck, Citation2006; Hofmann & Smits, Citation2008) suggest that many of these seemingly noncognitive skills can be cognitively cultivated, taught and exercised. These are just beginning to be recognised as skills, likely because they require nontrivial assessment over a variety of contexts that map onto the diverse settings in which they were acquired and trained through a lifetime of family instruction, community and work experience.
Each of the papers above is aided by rich and detailed skills data and it is precisely the lack of related sources that challenges scholarship on skills in developing countries, particularly in geographies characterised by high informality, a gap in the literature that our paper addresses.
We note that skills in our study are self-reported. The literature is divided in identifying a reliable way to measure soft skills and it is not uncommon to code soft skills based on job market ads (Deming & Kahn, Citation2018). Nevertheless, self-reported non-cognitive skills may result in social desirability and reference biases (Peng, Nisbett, & Wong, Citation1997). Furthermore, social desirability may not be uniform across the Indian slum-dwelling population, but patterned according to characteristics like gender that have strong cultural associations within the Indian context. Therefore we refrain from drawing causal inference between self-reported skill claims and labour market outcomes. We argue however that regardless of bias in the production of self-reported skills, the consumption of those skill claims as signals of ability, like one might share on a resume or in an job interview, are much more likely to be uniform across the population. This means that while employers may discount skill claims for all respondents, this may not alter the rank orderings of signals received by employers for individuals across characteristics (West et al., Citation2016). Self-reported signals are likely particularly important in the informal labour market due to the short-term nature of employment where workers are required to continuously signal skills in a spot market arrangement. Thus, rather than making any causal claims, we seek to demonstrate the correlation between observed labour market outcomes and the skill signals that employers experience and act upon.
The paper proceeds as follows: Section II describes our sampling methodology, survey design, and empirical strategy. The results of our analysis are presented in Section III. Section IV concludes with a discussion.
2. Materials and methods
Data for our study come from a two round survey of informal workers residing in Bangalore slums. In Round 1, we collect demographic characteristics and employment histories from workers along with their self-assessment on a set of basic skills and personal qualities. We also crowdsource skills, knowledge, personal and social capacities that respondents attribute to themselves and believe to be valued in the labour market. Our Round 2 surveys contain a shorter segment on employment and demographic characteristics followed by self-assessments on the most frequently occurring crowdsourced skills from Round 1. We ensure through our sampling design that there are no overlaps between the slums selected in the two rounds.
2.1. Sampling strategy
For each round we followed multistage sampling to sample ‘declared’ slums in the Bangalore urban district based on the Census of India.Footnote6 Our final Round 1 and Round 2 data comprises
and
respondents, respectivelyFootnote7 and is representative of workers living in Bangalore’s declared slums, who are typically informal workers.Footnote8
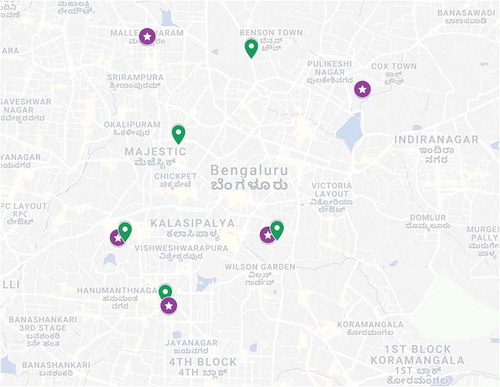
In the first stage of multistage sampling, we randomly selected town areas comprising multiple slums from a list of
town areas. presents geographical locations of the areas selected in both rounds. In the second stage, we randomly selected two slums from the first stage units, resulting in a total of
slums considered in each round. From the
slums in the second stage, we employed a population proportional to size (PPS) sampling design for determining the number of units required to meet our target sample sizes.Footnote9 Households to be surveyed were selected through systematic sampling based on random initialisation within each slum. As indicated by the pre-survey demographic assessment of slums, each household was represented by approximately five members. Based on the roster of household members our trained investigators prepared, one working-age respondent was randomly selected in each household as the main respondent. A pre-tested questionnaire was administered in CAPI (computer-assisted personal interview) format on tablets by trained investigators. Questions were asked in local languages (Kannada and Tamil). Wherever applicable, if the respondent was a migrant uncomfortable with the vernacular, the survey was conducted in Hindi or English as per the respondent’s preference.Footnote10
Figure 1. Bangalore has 15 town areas which served as the first stage sampling frame in the multistage sampling strategy utilised for the analysis. The purple (starred) and green (drop shaped) pins in the map (generated using Google My Maps application) indicate the 5 town areas randomly selected in Round 1 and Round 2 respectively. In the second stage 2 slums each were selected randomly from each of the 5 town areas, leading to 10 (non-overlapping) slums being surveyed in each round
Conducting surveys in slums posed several challenges. First, there were instances of a discrepancy between the number of households reported by the government and the actual population. Our investigators conducted rapid appraisal of the history of the slum and vetted its notification status. Second, several slums have undergone a transformation that no longer qualifies them to be slums. In one instance, one slum selected for our sample had been redeveloped and de-notified. Following careful ethnographic observation, our investigators replaced the slum with another ‘declared’ slum in the vicinity having a comparable number of households, similar housing stock and patterns of human behaviour. Third, our investigators were required to deliberate with the community leaders in particular slums regarding the objectives of the study, obtaining their approval before proceeding with data collection. All surveys were conducted after obtaining signed informed consent forms from each respondent.
2.2. Survey design
Round survey questions covered demographic characteristics (including age, gender, education, parents’ education, social group, migration, family size, and so forth.), economic status (including household assets, savings and expenditure), employment history (including wages, experience, primary occupation and so forth) and employment seeking behaviour (including job search and training). Given the importance of basic skills in a changing economic environment (Murnane & Levy, Citation1996; Peter-Cookey & Janyam, Citation2017), respondents were also asked to assess themselves on
basic skills (ability to: read/write/speak Hindi and English; do simple maths; use the internet; use a mobile phone; ride a motorbike; drive a car) and on
personal qualities (whether they consider themselves confident; ambitious; organised; sociable; talkative; make new friends easily; come up with new ideas; handle stress well; trust others easily; prefer routine work). Our choice of qualities was motivated by the literature on personal qualities and labour market outcomes (Krueger & Schkade, Citation2009; Lex Borghans & Weinberg, Citation2009).
Respondents were scored at if their self-assessment on basic skills was ‘very comfortable’,
if ‘not at all comfortable’ and
if ‘somewhat comfortable’. Respondents were scored at
if a personality trait applied to them,
if not and
if they were unsure or indifferent.Footnote11 Finally, respondents were asked to list the skills, qualities and knowledge that they attributed to themselves, which they believed had helped them in the job market.Footnote12
In Round , respondents provided self-assessments on the
most frequent skills elicited by Round
respondents. Along with these
skills, we added another six language skills: ability to read and write English, Hindi, and Kannada. Though Kannada is the lingua franca of the local population, Bangalore is home to a large population of migrant workers in its IT sector whose first or second language is Hindi. For local workers in low wage employment, ability to speak English or Hindi may be associated with greater employment opportunity. The complete list of skills is presented in . Respondents were also asked a shorter set of questions focused on demography characteristics and employment history.
Table 1. Mean self-assessments on ‘language skills’ and ‘task skills’ in Round 2, disaggregated by gender are presented. While conversational Kannada skills are common in the sample, written Kannada skills are less prevalent. On the other hand written English skills are rated higher by the mean respondent compared to spoken English skills. Significant gender disparities in self-assessment exist in favour of male respondents in all but language skills. Larger and significant gender disparity are observed in most task skills, particularly those related to bike and car driving, traffic rules and geographic knowledge, as well as skills like (use of) banking services, internet and mobile phone usage
Table 2. Mean self-assessments on ‘personal skills’ and ‘social skills’ in Round 2, disaggregated by gender are presented. In comparison to language and task skills, the gender disparity in self-assessments on these soft skills is somewhat less, with no significant difference in means for a number of skills. However, whenever there is a significant difference in mean self-assessments, it is in favour of male respondents. The only exception to this is the social skill of ‘Caring for others’, highlighted in bold. The few social skills where not all respondents rated themselves highly were ‘Management of team’, ‘Customer service’, ‘Supervising’ and ‘Teamwork’. Among personal skills, ‘Creativity’, ‘Dressing sense’ and ‘Confidence’ had the lowest mean self-assessments among all respondents
Table 3. Mean self-assessments on specialised skills in Round 2, disaggregated by gender are presented. We note that mean self-assessments by females is significantly higher than males for a number of skills, highlighted in bold, which exhibits the phenomenon of gender specialisation of occupations and skills. The only specialised skills which did not have significant gender differences are ‘Designing skills’, ‘Sales’ and ‘Packing’
2.3. Empirical strategy
e utilise a mix of econometric and machine learning techniques for our analysis. Machine learning techniques are particularly useful in applications involving a large set of attributes: self-assessments on a large number of skills in Round is a natural application. Within machine learning, unsupervised learning methods like k-means clustering and embedding diagrams shed light on the underlying structure within high dimensional spaces, whereas supervised learning methods such as sparse regression (for example, LASSO) can be used to select attributes that best predict relevant outcomes.
2.3.1. Mapping the skills space.
2.3.1.1. Comparison of means and correlation plots.
Because gender disparities in the Indian labour market are well documented (Duraisamy, Citation2002; Filmer & King, Citation1999; Verick, Citation2018) we explore differences in skill claims across male and female respondents. To do so we compute mean self-assessment values for both groups and conduct standard comparison of means t-tests for both rounds. For Round 1 we also present correlation plots for all basic skill and personal quality claims, respectively, along with a dummy variable for female respondents .Footnote13
2.3.1.2. K-means clustering.
We cluster the skill claims from Round 2 data using the k-means algorithm, a technique that partitions skill claims into groups clustered around
central points. Each of the
skills examined,
, has an associated vector of self-assessments denoted
. The algorithm runs iteratively, starting with an initialisation of
random cluster centres,
. The cluster centre to which skill
is assigned is denoted
. The K-means clustering algorithm consists of two steps.
Step 1: Clustering. The algorithm finds clusters
with corresponding cluster centres
such that the sum of the squares of the euclidean distance between each skill vector
and the corresponding cluster centres
is minimised.Footnote14 Starting with a set of randomly initialised cluster centres, the associated optimisation function is:
Step 2: Updating cluster centres. The cluster centres are updated by taking the mean of the vectors in each cluster
.
Steps 1 and 2 are repeated until convergence or a maximum number of iterations is reached. The primary input into the k-means clustering algorithm is the total number of clusters, . This number itself can be estimated using the ‘gap-statistic’ as recommended in Tibshirani, Walther, and Hastie (Citation2001).Footnote15
2.3.1.3. Hyperbolic embedding.
Another popular class of unsupervised learning techniques involves the generation of low dimensional vectorised embeddings from discrete data within a structured system like persons within social networks, words within sentences, and in this paper, skill claims within people. Embedding techniques provide a map from discrete objects to numerical vectors that anchor a geometric space in which each object is uniquely placed to minimise distortion and optimally predict the original input data. Such maps can then be used to infer complex relationships between the modelled objects. A popular embedding technique for numerical data, Principal Components Analysis, is widely used by social scientists. Recent advances in computation have led to the ubiquitous use of neural network embedding techniques like Word2vec, GLoVe, and BERT for complex problems in natural language processing and information search, such as question-answering and analogy resolution (for example, ). These approaches map words to low-dimensional Euclidean spaces that reveal linkages between their underlying meanings. Related techniques generate embeddings in hyperbolic space which captures not only similarity, but hierarchy among concepts (Chamberlain, Clough, & Deisenroth, Citation2017). Hyperbolic embeddings allow the representation of complex and intransitive associations between concepts with far fewer dimensions than Euclidean space (Nickel & Kiela, Citation2017).
We generate hierarchical embedding figures for the crowdsourced skill claims using hyperbolic embedding methods on Round 2 data.Footnote16 We use the hyperbolic embedding algorithm developed by Nickel and Kiela (Citation2017) using the open-source library PyTorch.Footnote17 The algorithm generates Poincaré disks, which represent tree-like hierarchical structures: points at the periphery represent the leaves and those at the centre the trunk (see Nickel and Kiela (Citation2017) and Börner et al. (Citation2018) for more details). Each point on the disk is defined by a radius and an angle. A smaller radius indicates a more central position in the hierarchy. Skills lying close to the centre are claimed by many workers. Smaller angular differences between any two skills indicate greater co-claims by the same and similar workers, suggesting skills that likely substitute or complement one another.
The primary input for generating such embeddings is a list of object pairs. The algorithm estimates the underlying structure utilising the co-occurence of skills. This is indicated by the frequency of each pair within the list. We create the input list as follows. For each individual we pair the skills that received the same self-assessment. If individual ‘s self-assessment was ‘very comfortable’ for both ‘English speaking’ and ‘Stitching’, then those two skills form a pair. If many claim them in common, they will be close within the embedding, but if one is claimed in common with a much wider range of skills, it will be closer to the centre. We consolidate all individual pair lists to create the final input list.
2.3.2. Skill claims associated with level and stability of wages.
We analyse the log of weekly wage earnings and whether the respondent (an individual in the working-age population of 15–59 year) earns a regular monthly salary. Given the insecurity of tenure and pay in informal work (respondents often earn wages on a daily or weekly basis along with piece-rate pay), we are also interested in measuring job stability for which we use receipt of regular monthly wages as a proxy.
2.3.2.1. Econometric modelling.
We run different versions of the Mincerian wage regression (Mincer, Citation1974) using Round data:
where refers to weekly wages reported by respondents. Similarly for analysing the receipt of regular monthly wages we estimate:
where is an indicator variable for regular monthly wages.
is number of years of schooling,
is number of years of experience, Footnote18
is a set of controls including demographic characteristics (gender, religion, caste group) and training history,
are the respondent’s self-assessment on skills and personal qualities.
Results on the level and stability of wages presented in the paper are conditional on being employed. However, it is standard practice to include a Heckman correction term in the Mincerian wage regression for addressing possible selection bias (Heckman, Citation1979) and alternate specifications of our models including a Heckman correction term (which produce qualitatively similar results) are available as supplementary material.Footnote19
For Round we also study the factors associated with being employed:
where is an indicator variable for respondents who are currently employed,
are the respondent’s self-assessment on skills and personal qualities and
is a set of controls: mother’s education, father’s education, dependent ratio in the household, Footnote20 asset index of the household, marital status, migrant status, whether the respondent received any vocational training, years of work experience, gender, caste, religious community, possession of a PAN card and a bank account (the last
controls indicate a basic level of financial inclusion).Footnote21
We estimate three versions of each model: 1) without controlling for skill or personal quality claims; 2) controlling for skill claims; 3) controlling for both skill and personal quality claims.
2.3.2.2. LASSO regression.
The number of skill claims from Round 2 is substantially larger at . In such cases, standard linear regression models often produce unstable estimates with low accuracy following from potential multicollinearity. Sparse regression techniques in machine learning are appropriate for such datasets, with the most popular technique being LASSO (Tibshirani, Citation1996). LASSO simultaneously performs model selection and parameter estimation by adding a penalty term to the standard linear regression objective function. The additional term prevents over-fitting by penalising large values of parameter estimates. Mathematically, given
observations of the dependent variable
and a set of covariates
LASSO predicts parameter values
by minimising:
where the first term is the standard linear regression loss function and the second term is the penalty for over-fitting. This penalty term forces some of the parameter values to zero, which makes it useful for the task of covariate selection given a large collection of possible covariates.
can be interpreted as the weight given to the penalty term: when
the estimated parameters are identical to linear regression, when
the estimated parameters will be equal to zero. In practice the value of
is selected through a technique called cross-validation based on its ability to predict out of sample.
While LASSO was originally developed within the linear regression setting, the technique has subsequently been extended to generalised linear models such as logistic regression. Importantly, we note that given the non-standard objective function, standard significance tests and confidence intervals do not hold for parameter estimates from LASSO.Footnote22
As before, our outcomes of interest are 1) log of weekly wage earnings, and 2) whether the respondent received regular monthly wages,
. For both outcomes, our covariates include all skill claims and demographic characteristics. We implement LASSO regressions in R using the package glmnet.Footnote23
3. Results
3.1. Mapping the skills space
3.1.1. Round 1: distribution of basic skills and personality traits.
presents the mean self-reported assessments from respondents on the set of basic skills and personal qualities surveyed in Round 1. Across almost all basic skills, mean self-assessments of males is significantly higher than females (first column of ). This is also reflected in the negative correlations between dummies for female respondents and each basic skill. The disparity is most stark in the case of ability to drive a two-wheeler (less than for females and almost
for males) as well as internet usage (around
for females and
for males). The use of mobile phones has the highest mean self-assessment value of all basic skills – consistent with the recent proliferation of mobile phone ownership in India. For language skills, the mean self-assessment for speaking Hindi (around
for females and
for males) is higher than reading and writing the language (around
for both females and males). English speaking claims, on the other hand, are lower than reading and writing implying that while many respondents learn English as part of the school curriculum, they may not be confident speaking it in their daily lives. As expected, language skill claims are correlated with one another and with the use of mobile phones as well as the internet.
Figure 2. Mean self-assessments of respondents on the set of language, task, personal and social skills from Round 1 dis-aggregated by gender (along with 95 % error bars) are presented in (a) and (b) respectively. While there was clear gender disparity in self-assessment of language and task skills with female mean assessments being significantly lower than males, this was not the case when it came to questions about personal and social skills, where most respondents rated themselves very highly irrespective of gender. Correlation plots between these skill claims (along with a dummy variable for females) are presented in (c) and (d)
While respondents’ self-assessments on most basic skills is low, this is not the case for self-assessments on personality traits (second column of ). Most respondents rate themselves highly, leading to mean values of and above for most personality traits. Although females still tend to rate themselves lower than males on average, gender disparities are typically not statistically significant. Two exceptions are the qualities of being ‘easily trusting’ and ‘organised’ where the average female rating is significantly lower.
3.1.2. Round 2: distribution of crowdsourced skills.
The crowdsourcing exercise in Round 1 provides us with a rich taxonomy of skills, knowledge and qualities that respondents believe to be valued. We elicited over entries, of which over
were unique. The large number of skills elicited is an important cultural finding in and of itself. Policy makers and economists tend to refer to informal workers in India as ‘unskilled’. Our findings suggest that informal workers not only possess a large number of skills, but they are able to readily articulate these skills with, in many cases, a widely shared vocabulary. This is especially apparent when we consider some of the specific and nuanced responses elicited, which would have been impossible to have anticipated without discovery through an open-ended survey design.
We report here some of these responses verbatim.Footnote24 (1) Some personal qualities: ‘tension-free’, ‘(possessing a) happy face’, ‘taking initiative’, ‘(making a good) self-introduction’, ‘ability to explain complex information clearly and simply’, ‘well behaved manner with higher persons’. (2) Skills relating to work environments: ‘ability to work at heights’, ‘ability to work in unclean environments’, ‘ability to work independently at home’. (3) Some highly specific skills: ‘knowledge of removing skin from goats and beefs’, ‘demolition of houses’, ‘using granite polishing machine to polish granite and tiles’, ‘ability of knowing colour coded wiring’, ‘shouting loudly to attract customers’.
We refer to all these critical inputs as skills going forward, categorising them into ‘language’, ‘task’, ‘specialised’, ‘personal’ and ‘social’. ‘Language’ skills like Hindi, English and Kannada speaking, writing and listening, as well as general ‘task’ skills including simple maths, measurement and traffic rules, are often the focus of general education and have a rich history of testing and evaluation. ‘Specialised’ task skills are linked with a specific occupation and are acquired through training and work experience. ‘Personal’ skills such as neatness, punctuality, honesty, stress management and dressing sense, as also ‘social’ skills like caring, friendliness and the ability to adjust one’s attitude in a contentious interaction are associated with personal and social capacities trained over a lifetime of family instruction, community and work experiences. These are often neglected as skills, and require nontrivial assessment over a variety of contexts that map onto the diverse settings in which they were exercised. This categorisation is useful for exposition and respects the range of real capacities people bring to successful, sustainable employment. – present the most commonly occurring crowdsourced skills, along with mean self-assessment by female and male respondents in Round . The tables also indicate whether means across gender differ significantly. Skills within each category are presented in ascending order of mean self-assessment.
We find large gender disparities in skill claims, particularly in the ‘language’, ‘task’ and ‘specialised’ skills. Part of these differentials can be explained by gender typing of occupations among informal workers – domestic help work is almost entirely handled by women, while transport and delivery services lie in the domain of men. As a result, skill claims associated with these occupations are also gendered. Consistent gender differences persist in favour of men with skill claims including ‘driving’, ‘riding a bike’, ‘traffic rules’ and ‘geographic knowledge’, and in favour of women in skill claims including ‘cooking’, ‘washing clothes’, ‘cleaning vessels’ and ‘housekeeping’. Nevertheless, there are also large gender gaps in basic task skills including ‘internet usage’, ‘using mobile phones’, ‘bank work’, ‘general knowledge’ and ‘speaking in English’ which are associated with a diversity of occupations. In contrast, most respondents rate themselves very highly on personal and social skills, for which evaluation is challenging and subtle: almost all respondents rate them selves highly in terms of their ‘relationship with people’, ‘work ethic’, ‘respectfulness’ and ‘honesty’. We stress again that while skill self-assessments are an imperfect measure of actual skill possession, our results are still of practical value in so far as they are a reasonable measure of skill claims which have non-trivial value for signalling in the informal labour market.
3.1.3. Round 2: co-occurrence of crowdsourced skills.
Round data provide us with a unique opportunity to understand the co-occurrence and hierarchy of skills in the informal labour market using unsupervised learning methods. presents the
optimal clusters obtained by the k-means clustering algorithm, in increasing order of number of skills per cluster. An informative way of analysing the clusters is to see which skills co-exist within a cluster – and particularly if language, task, personal and social skill claims are clustered together with more specialised occupation skill claims.
Table 4. The 7 optimal clusters obtained by the k-means algorithm, in increasing order of number of skills per cluster. The skills contained in Cluster B are all associated with domestic work and no basic skills are associated with this cluster – confirming anecdotal evidence that such work is carried out by the most vulnerable (typically female) population. Cluster C points towards respondents employed in the IT sector. This cluster also contains the important skills of ‘bank work’ as well as English reading, writing and listening. Native Bangaloreans are more likely to be employed in this sector implied by the presence of Kannada reading and writing skills in this cluster
Consider the skills collocated within cluster – ‘work in bathrooms’, ‘work in kitchens’, ‘cleaning house’, ‘washing clothes’, ‘ironing’, ‘cleaning vessels’, ‘cooking’, ‘housekeeping’, and ‘cutting meat’ are all associated with domestic work. The other skill in the cluster is ‘cleaning roads’, an activity for which local municipalities employ women. It is telling that no general language or task skills are associated with this cluster, confirming anecdotal evidence that domestic work is carried out by the most vulnerable (typically female) population. Cluster
points towards respondents employed in the IT and IT-enabled services sector (ITES) as implied by the co-occurrence of skills in ‘internet usage’, ‘computer handling’ and ‘data entry’. Notably, this cluster also contains the skills of ‘bank work’, English language reading, writing and listening. Most interestingly, writing and reading in Kannada (the native language of the region) also show up in the cluster, revealing that natives as well as Kannada speaking migrants among the slumdwellers are more likely to be employed in the coveted IT sector.
The remaining clusters are not as intuitive but surface interesting insights. Clusters and
appear associated with sales work. They include skills linked with sellers and vendors such as ‘quality verification’, ‘inventory’, ‘packing’, ‘customer service’ and ‘sales’. A number of important task skills also show up in these clusters such as ‘handling cash’, ‘simple maths’, ‘mobile phone usage’, ‘geographic knowledge’ and ‘tracking prices’. Critical social skills such as ‘management’, ‘supervising’, ‘teamwork’, and personal capacities like ‘dressing sense’ and ‘creativity’ also appear in these clusters. Cluster
brings most of the personal and social skills together, likely because respondents are less disciplined when assessing themselves as they link with valued identities and most respondents rate themselves very highly. Cluster
and
consist of language skills in Hindi, speaking skills in English, along with a number of specialised skills (from ‘driving’ and ‘working with tools’ to ‘stitching’ and ‘cement work’). This cluster likely corresponds to the population of respondents who can perform a large number of odd jobs and interact regularly with Bangalore’s large migrant non-Kannada speaking population of corporate employees.
3.1.4. Round 2: hierarchy of crowdsourced skills.
Hyperbolic embedding is an emerging technique that has gained popularity in part because it represents both the co-occurrence and hierarchy of concepts. In our application, skills that are more general, held in common across many workers and with a wider range of other skills, are placed closer to the centre of the embedding (represented by lower radius values) and those less widely and diversely held are placed further from the centre of the embedding (represented by higher radius values). Two types of skills will be found at the centre of the embedding (1) pathway skills – skills essential to acquiring other skills and (2) widely-occurring skills – skills easily acquired or with an underlying sub-skill transferable from one specialised skill to another. From the analyst’s perspective, it is not possible to distinguish from the embedding whether a skill is more central because it is a gateway skill or an easily and widely acquired skill. With this caveat in mind, we analyse .
Figure 3. Hyperbolic embedding of skills presented here provides both a hierarchy of skills along with their co-occurence. Our embedding, disaggregated by (a) language and task, (b) personal and social (c) specialised skills reveals a high concentration near the centre of the embedding, which suggests that there may be underlying sub-skills transferable across a number of specialised skills. Basic language and task skills are more spread out in the embedding – implying that the distribution of these skills is clustered and uneven across our sample
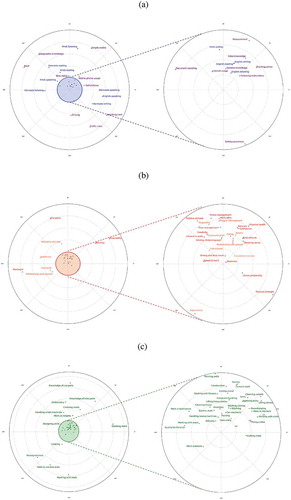
Our first observation is that there is a large concentration of skills close to the centre of the embedding – of all skills are within the
disc and as many as
are within the
disc. These are much more highly concentrated than the distribution of skills paid job advertisements. In U.S. job advertisements (Börner et al., Citation2018), general communication skills, such as writing, communication and management are central, but the vast majority of skills (
) lie above the
disc – they are peculiar to very specific jobs (and persons), such as protein analysis, scanning, python programming and surgery. This suggests that skills among those living in slums are much more likely to occur within the same people than those demanded by any particular well-compensated job, highlighting the lack of specialisation and need for flexibility among those with fragile and intermittent employment from Indian slums.
We note that the concentration near the centre is driven by personal, social and specialised skills. Personal and social skills are likely concentrated near the centre because most respondents rate themselves highly on them. On the other hand we interpret the high concentration of specialised skills near the centre to be their ease of acquisition due to an underlying set of transferable sub-skills. Basic language and task skills are more spread out in the embedding – implying that certain skills which we may perceive to be widespread are actually rare among our population of interest. Interestingly only task and language skills are contained in the
disc of the embedding: ‘English writing’, ‘English reading’, ‘English listening (understanding)’, ‘internet usage’, ‘following instructions’ and ‘general knowledge’. We know that the prevalence of English language skills and internet usage in our sample is comparatively low and so are not widely occurring. Therefore we interpret these skills as being pathway skills which are useful for acquiring other skills.
How do we think of the structure of the embedding generated by the crowdsourced skills list? It is true that informal workers are not ‘unskilled’, as is apparent from the large list of skills our respondents provide. Our embedding results, however, show a high concentration near the centre of the embedding implying that a number of specialised skills are widespread and perhaps easy to acquire for our population. This pattern signals that there are likely underlying sub-skills transferable across a number of these specialised skills. For example, we see that ‘packing’, ‘delivery’ and ‘handling heavy machines’ are close in the embedding – each require the ability to do physically demanding work with large packages making it easier to move between the specialised skills. Similarly we see that ‘ironing’ and ‘cement work’ are close together in the embedding, suggesting that both are held alongside very similar patterns of other skills. Our findings contextualise the relevance of ‘tacit knowledge’ (Polyani, Citation1983), which may be embodied in apprenticeship as well as on-the-job training experience of informal workers, and which may not be separated from the skills that workers have reasons to value. And yet the very concept of ‘tacit’ skills highlights the lack of research and educational investments made in naming, training and valuing these critical skills. Given this context, we propose a more nuanced notion of ‘transferable’ or ‘portable’ skills to describe skills possessed by informal workers rather than referring to them as ‘unskilled’ or even ‘low-skilled’.
3.2. Skill claims associated with level and stability of wages
3.2.1. Round 1: basic skills and personality traits.
presents results from the Mincerian wage estimation described in (1) and presents results of the estimation on whether the respondent receives regular monthly wages, corresponding to (2). The first column in the tables corresponds to the base specification which does not include and skill or personality trait claims. Basic skill claims are included in the remaining two columns. Personality trait claims are included in the final specification.
Table 5. Results of the outcome equation of the Mincerian wage equation conditional on being employed (1) from different specifications using the Round 1 data
Table 6. Results of the estimation on whether the respondent receives regular monthly wages conditional on being employed (2) using Round 1 data. For ease of interpretation, the odds ratio transformations of the coefficient estimates are presented in this table
Estimates from the base specification in are as expected: log of weekly wages increases with number of years of education as well as experience. The effect of experience is slightly concave as evident from the small negative coefficient on the square of experience. Female workers start at a lower wage level and also experience lower rates of wage increase with experience. Each of these estimates is significant at level of confidence. Interestingly the significant association with education and gender are washed out once we control for basic language and task skill claims. This finding contributes suggestively to the conversation around ‘skilling vs schooling’ in the Indian public policy context.Footnote25 The strongest and most significant task skill claim associated with higher wages is ‘internet usage’ followed by ‘English speaking’. Within personality trait claims, being ‘sociable’ and ‘easily trusting’ are associated with higher wages.
Estimates reported in the first column of provide some interesting insights: the odds of receiving regular monthly wages increase with years of education and decrease with experience. While the decreasing odds of receiving a regular monthly salary with increasing experience seems counter-intuitive, we suggest that experience here is likely acting as a proxy for age, and this coefficient implies that younger workers are more likely to be working in jobs with regular wages. The interaction term for female and experience is positive implying that odds of receiving a regular wage with increasing experience are higher for female respondents. The square of experience is positively associated with regular wages, implying increased odds of receiving regular wages after years of work experience. Hindu respondents have lower odds of receiving regular wages, as do Schedule Cast (SC) and Schedule Tribe (ST) respondents. On including skill claims, a strong positive association of ‘English speaking’ claims with regular wages emerges. ‘Internet usage’ is associated with higher odds of a regular wage, but this signal is less robust. Not surprisingly, a preference for ‘routine work’ is associated with a highly significant increase in odds of receiving a regular salary, as seen in the final column.
The most striking and robust result in is that participants who claim to have received some vocational training have lower odds of being employed. By contrast, we note that receipt of training is not significantly associated with either level or regularity of wages from and . This corroborates previous evidence that vocational training is associated with higher levels of unemployment among job-seekers (Ahmed (Citation2016) and Agrawal (Citation2012)). While further research is required to unpack this association, we posit three possible explanations: 1) poor quality of vocational training; 2) a mismatch between skills trained and those demanded by employers; 3) individuals who receive vocational training may be holding out for better jobs than are available. Another robust association that emerges is women having significantly lower odds of participating in the labour market, a well-documented stylised fact. Among basic skills, there exists a surprising negative association between participation in the labour market and self-assessed ability to use mobile phones. More intuitive is the positive association with the personal skill claim of being organised.
Table 7. Results of the estimation on whether the respondent is currently employed (2) using Round 1 data. For ease of interpretation, the odds ratio transformations of the coefficient estimates are presented in this table
Overall Round 1 results point towards gender disparities in level and regularity of wages, albeit in opposite directions.Footnote26 These differentials may be driven by women self-selecting into activities with more regular wages, even if wage levels are lower, given their unpaid domestic work and care responsibilities. It may also be the case that employers structure compensation for women workers with regular but low wages due to these preferences. Furthermore, it may be the case that certain jobs are considered higher skill (and thus elicit higher wages) simply because men are associated with them, while jobs with a higher concentration of women become considered low skill. This process through which valued categories from one domain (for example, men among genders) influence the categorisation of those in another (for example, high skilled among jobs) has been termed the social construction of skills and is characteristic of many developing world informal labour markets (Banerjee, Citation2018). Informal women workers may internalise such skill perceptions with real consequences for their job choices (Sen, Citation1999). The analysis also demonstrates that while the association of education with wage levels stops being significant when controlling for language and task skill claims, the association of education with regular monthly wages remains significant even after controlling for all skill claims. Claims of speaking English and using the internet have positive associations with both level and regularity of wages. The results with respect to English speaking corroborate the findings of Azam, Chin, and Prakash (Citation2013) and Jain, Maitra, and Mani (Citation2019) in the context of returns to spoken English in the Indian labour market.
3.2.2. Round 2: crowdsourced skills.
presents skills selected by LASSO regression (along with estimated coefficient values) where the outcome of interest is log wages and presents skills selected by LASSO regression (along with odds ratio transformations of the estimated coefficients) where the outcome of interest is receipt of regular monthly wages using Round data.
Table 8. Variables selected by LASSO regression (along with estimated coefficient values) in a supervised learning problem using Round 2 data where the outcome of interest is log wages conditional on being employed. Variables are presented in ascending order of coefficient estimates
Table 9. Variables selected by LASSO regression (along with odds ratio transformations of estimated coefficients) in a supervised learning problem using Round 2 data where the outcome of interest is receipt of regular monthly wages conditional on being employed. Variables are presented in ascending order of coefficient estimates
In we note that from the set of demographic characteristics, the dummy for female gender has a strong negative association with logged weekly wages. No other demographic characteristic is selected (eg: education or experience). The only skill claim negatively associated with wages is the highly gendered skill of ‘washing clothes’. Of the basic language and task skill claims ‘English listening (understanding)’ and ‘computer handling’ are picked up as positive correlates of wages. Of the personal and social skill claims, ‘supervising’ and ‘teamwork’ are selected as positive correlates of wages. Most predictive ability, however, lies with specialised skill claims such as ‘bike riding’, ‘knowledge of bike parts’, ‘knowledge of car parts’ and ‘geographic knowledge’. These skills strongly suggest gains in wages associated with the recent growth in delivery services and ride-sharing in Bangalore. ‘Data entry’ is another specialised skill claim that, along with the task skill claim ‘computer handling’ correspond to the high-growth IT sector in the city.
In ‘experience’ (a proxy for age) is associated with lower odds of a regular wage and the dummy variable for female gender is associated with higher odds of a regular wage. Of the language and task skill claims, ‘English listening (understanding)’ and ‘computer handling’ are associated with higher odds of a regular wage. Interestingly a number of personal and social skill claims are associated with much higher odds of a regular wage. In particular ‘relationship with employers’, less a skill than an inheritance, is associated with times higher odds of a regular wage underscoring persistent nepotism in informal work.Footnote27 ‘Punctuality’ is another personal skill claim that more than doubles the odds of a regular wage. Claims of ‘following instructions’ and ‘dressing sense’ are associated with about
higher odds of regular wages. Speaking and dressing according to informal codes of conduct constitute what sociologists have called ‘cultural capital’, which typically accumulates through long apprenticeship in relevant cultural settings and signifies membership in a valued cultural category (Bourdieu & Richardson, Citation1986; Bourgois et al., Citation2003). A number of specialised skill claims are also selected, indicating specific, stable occupations. Claims related to domestic work such as ‘cleaning vessels’, ‘work in bathrooms’ and ‘cleaning houses’ are associated with higher odds of a regular wage. Similarly ‘cleaning roads’ is associated with regular monthly wages, as should be expected with the city municipal corporation hiring women for the job of picking up trash and cleaning city roads. On the other hand, skill claims related to construction work like ‘cement work’, ‘painting walls’, ‘applying putty’ and ‘construction work’ are associated with lower odds of a regular wage.
The empirical results from Round 2 reiterate results from Round 1. Women are more likely to receive regular monthly wages, but women’s labour is associated with lower wages. Younger workers are more likely to be employed in jobs that provide regular monthly wages. English language and computer literacy consistently register as having a positive association with both level and regularity of wages. The inclusion of crowdsourced skills leads to novel insights particularly with respect to specialised skills and ‘soft’ skills. In particular skill claims that service the IT sector, particularly data entry jobs, are associated with both higher and more regular wages whereas those that service the delivery and transport sectors, related to bikes and cars, are associated with higher wages. Domestic workers are more likely and construction workers less likely to be regular wage earners. The personal and social skill claims of ‘relationship with employers’, ‘punctuality’ and ‘dressing sense’ show up as predictors of regular wages.
4. Discussion
This paper uses primary data from nearly respondents from Bangalore, India to map the skills space of informal workers and study to what extent diverse skill claims are associated with higher and more stable wages.
From Round data we estimate large and significant gender disparities across language and task skill claims but do not observe significant differences in personality trait claims. We find that while female workers earn less than male workers, they are more likely to be in stable jobs and receive regular monthly wages. We find too that younger and more educated workers are more likely to receive regular wages. The ability to speak English and use the internet have positive associations with both level and regularity of wages. Notably vocational training is not associated with either outcome but is associated with higher levels of unemployment.
Round data provide insight on the clustering and hierarchy of skills, augmenting our understanding of the skills space beyond traditional econometrics. For example, our clustering results reveal that skill claims related to paid domestic work (an almost exclusively female occupation) are isolated from any general task, personal or social skill claims. Embedding results suggest that the most commonly claimed skills associated with informal work may be relatively inexpensive to acquire and substitute into or out of, but these do not include many key language and task skills. Supervised learning using LASSO provides new insights on the relationship between specialised skills and ‘soft’ skills with desirable job outcomes.
Crowdsourcing in Round 1 allows for the discovery of skills that respondents value, yet are not readily recognised by quantitative researchers. Out of the most frequently elicited skills, many are cultivated personal and social capacities including honesty, punctuality and interpersonal confidence – signalling the importance attached by respondents to these critical qualities. Another set of specialised skills, provides a detailed menu of occupation-specific task skills. Self-assessment data on these skills in Round 2 allow us to analyse the distribution of skill claims at scale. While mean self-assessments from female respondents are significantly lower than those from males for most skills, the crowdsourced list contains a small set of specialised skills where mean self-assessments by females is significantly higher. A number of the non-standard crowdsourced skills are found to be positively associated with job market outcomes. In this way, a bottom-up approach can shed light on skills possessed by sub-populations otherwise under-represented and on the association of non-standard factors with labour market outcomes.
We make the following contributions to the literature on skills. First, our paper adds to the sparse literature on informal skills in the Indian context, demonstrating a large heterogeneity of skill claims and their gendered nature. Second, our paper adds evidence from a developing country to the growing literature on the association of soft and general task skills with employment outcomes.
We make the following methodological contributions to the literature. First, our collaborative survey design approach allows us to connect qualitative data collection (as from open-ended interview questions) with generation of distributional characteristics at scale (as from quantitative surveys). Second, whereas the majority of applied machine learning research uses secondary data sources or primary data collected online, ours is among the first attempts to collect and analyse primary data in a fieldwork setting with a view towards machine learning applications. The design and analysis techniques from this paper can be modified and applied to other developing world contexts, particularly those with substantial heterogeneity.
Based on the positive association between English language and computer/internet literacy, as well as ‘soft’ skill claims with improved job outcomes, our paper makes a case for exploring experimental designs to estimate causal impact of training in these skills even for informal work. Further, our distributional results can inform policy makers as follows. (1) The large number of unique skills elicited from respondents, indicates that informal workers are not ‘unskilled’, rather our technology for skills measurement and representation has been limited. ‘Low skill’ is also misleading as many skills elicited are highly specialised and in some cases predictive of wages or regular employment. Thus our analysis indicates the need for a new vocabulary when addressing skill development for the informal labour market in India. (2) The significant gender disparity in skill claims specifically in English language skills, the use of mobile phones, banking services and the internet, makes a case for exploring large scale financial and computer literacy programmes targeted specifically at women. (3) Our results indicate that ‘soft’ personal and social skills training needs to be addressed in any national skills training programme design. For instance, the National Occupation Standards (developed by the National Skill Development Corporation or NSDC), which are largely silent on personal and social skills, focusing instead on an exhaustive list of key task skills required for various job functions.
Our study has the following limitations. First, skills are self-reported. There is a lack of agreement in the literature on how to reliably measure skills and such self-reported skill claims may be prone to biases (Peng et al., Citation1997). We therefore refrain from drawing causal inference between skills and labour market outcomes. We expect and find that respondents tend to rate themselves positively in personal and social skills but observe large variation in assessments for the remaining skills, suggesting substantial signal from the data. Second, gender differences in self-assessments may be partly attributed to lower levels of confidence among women (Pallier (Citation2003), Beyer (Citation1990), Exley and Kessler (Citation2019)) or the social construction of gender-based skill perceptions (Sen, Citation1999). Again, rather than dwell on causal relationships, we demonstrate the association between labour market outcomes and a large number of crowdsourced skill signals (however constructed) that employers may experience and act upon. Third, our sampling frame is based on the list of declared slums in Bangalore and is representative of workers residing there. While residents of declared slums are typically informally employed, they do not represent the entire population of informal workers in the city.
An important caveat to our study is that it focuses solely on labour supply. To estimate the ‘skills gap’ in any particular sector we would need to also perform a similar analysis of skills demanded by employers. Even then it is by no means guaranteed that any vocational training programme aimed at ‘filling’ such a skills gap or providing better labour market outcomes would succeed due to the following reasons: (1) a shortage of competent training staff in the first place; (2) a structural lack of employment opportunities providing higher and more stable wages; (3) cultural norms whereby simply ‘skilling up’ would not lead to better labour market outcomes, especially in the case of women and other marginalised populations; (4) certain key skills may be most effectively acquired on the job rather than in a vocational training programme.Footnote28
Future research directions include incorporating demand side preferences in the informal sector in line with Deming and Kahn (Citation2018) to analyse whether skills mapping can contribute to efficient matching of jobs. Studies along the lines of Autor and Dorn (Citation2013) and Autor, Levy, and Murnane (Citation2003) in the Indian labour market setting may further improve our understanding of the skill distribution of informal work. Another area of interest is detailing the processes by which informal workers attain key skills, given the evidence that informal vocational training, which includes a considerable higher proportion of learning on the job and self-learning, is more commonplace than formal vocational training in India (MOSPI, Citation2019). Owing to the high dimensionality of the skills space, an important methodological extension is the use of adaptive surveys for skill mapping, for instance a ‘skill profile’ for a user may be generated through a minimal set of questions which are adaptively identified. Another related research application is the identification of personalised skill acquisition pathways instead of one-size-fits-all training modules currently used for skills training. Success in any of these programmes will confirm the hypothesis raised by the rich self-assessments elicited in this study – that human capacity is a complex system of skills acquired over short and long timescales, with more and less effort, manifesting compositionality and complementarities that, if understood and incorporated into strategic policy interventions, could improve opportunity and raise prosperity.
Supplemental Material
Download PDF (227.6 KB)Acknowledgements
Financial Support for this project was received from the National Science Foundation, University of Chicago Delhi Centre, and Azim Premji University. The authors are grateful to Indian Institute of Technology Bombay for administrative support. Amitabh Chaudhary at University of Chicago provided critical technical guidance and Vishal Vincent Joseph provided excellent research assistance. Prof Santosh Mehrotra and Rakesh Ranjan Kumar at Jawaharlal Nehru University provided valuable suggestions to strengthen the paper. Comments from participants at workshops and talks at the University Chicago Center in Delhi, Azim Premji University, Ashoka University, ISI Delhi, IIT Delhi and IIIT Delhi were very helpful.
Disclosure statement
Declaration of Interest Statement by Nandana Sengupta: Financial Support for this study came from the National Science Foundation, University of Chicago Delhi Centre, and Azim Premji University, Bangalore. Administrative support for conducting the study was provided by Indian Institute of Technology Bombay (Project Code RD/0117-TUC0000-001). The IRB approval was obtained from Azim Premji University, Bangalore. Reviewing rights were shared with co-authors of the study. Nandana Sengupta has nothing further to disclose including any conflicts of interest that could inappropriately influence the work.
Declaration of Interest Statement by Sarthak Gaurav: Financial Support for this study came from the National Science Foundation, University of Chicago Delhi Centre, and Azim Premji University, Bangalore. Administrative support for conducting the study was provided by Indian Institute of Technology Bombay (Project Code RD/0117-TUC0000-001). IRB approval was obtained from Azim Premji University, Bangalore. Reviewing rights were shared with co-authors of the study. Sarthak Gaurav has nothing further to disclose including any conflicts of interest that could inappropriately influence the work.
Declaration of Interest Statement by James Evans: Financial Support for this study came from the National Science Foundation, University of Chicago Delhi Centre, and Azim Premji University, Bangalore. Administrative support for conducting the study was provided by Indian Institute of Technology Bombay (Project Code RD/0117-TUC0000-001). The IRB approval was obtained from Azim Premji University, Bangalore. Reviewing rights were shared with co-authors of the study. James Evans has nothing further to disclose including any conflicts of interest that could inappropriately influence the work.
Supplementary material
Supplementary Materials are available for this article which can be accessed via the online version of this journal available at https://doi.org/10.1080/00220388.2021.1898593
Correction Statement
This article has been republished with minor changes. These changes do not impact the academic content of the article.
Additional information
Funding
Notes
1. The Government of India “Report on Conditions of Work and Promotion of Livelihoods in the Unorganised Sector’ (Citation2008) estimates that informal (or unorganised) workers comprise about of the total workforce in India. We use the same definition for informal or unorganised workers as this report: ‘Unorganised workers consist of those working in the unorganised enterprises or households, excluding regular workers with social security benefits, and the workers in the formal sector without any employment/social security benefits provided by the employers.’
2. A discussion on the institutional setup of skilling initiatives in India is provided in the supplementary material for the paper.
3. Beyond the informal worker context, there are a few studies on cognitive and non-cognitive skills of children Helmers and Patnam (Citation2011) as well as adults Krishnan and Krutikova (Citation2013).
4. For instance in their paper Adhvaryu et al. (Citation2018) mention that ‘ [The training initiative] which is named Personal Advancement and Career Enhancement (P.A.C.E.), aims to empower female garment workers through training in a broad variety of life skills, including modules on communication, time management, financial literacy, successful task execution, and problem-solving. These skills are important inputs into production in the ready-made garments context
’. The study finds that wages rise very modestly with this training (by
percent).
5. Background on informal work in Bangalore is provided in the supplementary material for the paper.
6. Official agencies categorise slums as either ‘declared’ (including ‘notified’ or ‘recognised’ slums) or ‘undeclared’ (Krishna, Citation2013, p. 1013). As per the Census (Citation2011) classification, notified slums comprise those specified areas in a city or town that are notified as ‘Slum’ by the state or local government or Union Territory (UT) under any Act including a ‘Slum Act’. Recognised slums consist of those specified areas that are notified as ‘Slum’ by the state or local government or UT, or Housing and Slum Boards,which may have not been notified earlier. The third Census category – ‘identified’ slums – comprises congested tenements with poor civic amenities and having a population or number of household criteria (Census, Citation2011).
7. We used the Cochran (Citation1963) formula for sample size calculation:
8. Our analysis of respondent characteristics corroborates this and is included in the supplementary material for the paper. We do not claim that our sample is representative of the remaining types of slums in the city that is ‘undeclared’, ‘non-notified’ or ‘de-notified’ slums. In Bengaluru, slums fall under the jurisdiction of three governing bodies namely the Karnataka Slum Development Board (KSDB), Bruhat Bengaluru Mahanagara Palike (BBMP) and the Directorate of Municipal Administration. For declared slums, KSDB, has the obligation for developing civic amenities as well as upgrading and slum rehabilitation. Slums that have undergone in-situ redevelopment for provision of housing for eligible slum dwellers are supposed to be de-notified. Although there are official estimates of the total number of declared and undeclared slums in the city, there is ambiguity about actual numbers (Krishna, Sriram, & Prakash, Citation2014). During fieldwork before our surveys commenced, we came across residents in several slums referring to the local administration’s viewing most slums, particularly ‘de-notified’ or ‘undeclared’ slums, in the city as illegal. Therefore, finding a sampling frame of all such slums in the city is challenging and informal workers residing there become a hard-to-reach population.
9. Detailed tables of our sampling methodology are presented in the supplementary material for the paper.
10. We did not use a sampling frame such as voter list as we expected to sample individuals in the 15-59 years age group. Voter IDs would only be available for those who 18 years or older. Furthermore, many migrants remain unlisted on the voter list of the constituency.
11. We also considered other coding schemes for the personality trait responses, including coding them as missing values to check the robustness of the analysis. Results remained qualitatively similar and have been included in the supplementary material for the paper.
12. The question asked is reproduced here verbatim: ‘What skills, knowledge or values do you have which you think help in getting or keeping a job? List as many as you can think of. (If no clear answers, surveyor should ask – if current, former or potential employers were considering both you and another person for the same job, why did they pick you?)’.
13. The analysis is carried out in R using the package corrplot to generate correlation plots.
14. Each skill is matched only to a single cluster.
15. We implement the algorithm in R using the command kmean() for clustering and the package factoextra for estimating optimal number of clusters.
16. Principal Component embeddings were also generated, which represented comparable insights, and are available from the authors upon request.
17. Available at https://github.com/facebookresearch/poincareembeddingshttps://github.com/facebookresearch/poincareembeddings.
18. This is calculated by subtracting the age at which the respondent started working from her current age.
19. In the absence of valid instrument in selection model, the Heckman model results provided in the supplementary material do not address potential endogeneity.
20. Calculated as the sum of dependent members under years of age and over
years of age over the sum of wage earners in the household.
21. PAN stands for Permanent Account Number. It is a unique identity number issued by tax authorities in India. There is a mandatory requirement to link an individual’s PAN to her/his bank account.
22. We point interested readers to Taylor and Tibshirani (Citation2015) for an introduction to the burgeoning literature on post-selection statistical inference.
23. We use the command cv.glmnet to estimate through crossvalidation and the command glmnet to fit the resulting LASSO model.
24. The full list of skills is available from the authors on request.
25. Emerging evidence on returns to schooling indicates that the opportunity cost of schooling is an important consideration surrounding investment in skilling for informal worker households (Datta & Mishra, Citation2019; Kanjilal-Bhaduri, Citation2018) as is the local demand for such skills (Adukia, Asher, & Novosad, Citation2020). With female labour force participation rates declining despite growing school enrolment, increased investment in skill training may be a crucial policy tool.
26. These results are robust to heteroskedasticity corrections and inclusion of dummies for the two major occupation categories as controls: Domestic Work and Construction Work.
27. The assumption here is that a weak form of ‘relationship with employers’ existed before the acquisition of the job. This assumption is supported by the finding that nearly two thirds of the jobs in Round were obtained by referrals from a relative or a friend who knows the employer. More details on respondent characteristics are available in the supplementary material for the paper.
28. Informal workers, particularly in small and medium enterprises are most likely to be excluded from apprenticeship training (Saxena & Gandhi, Citation2014). Our framework offers insights into developing platforms for mapping ‘skills gap’ by trade to address localised demand and supply mismatches.
References
- Adhvaryu, A., Kala, N., & Nyshadham, A. (2018). The skills to pay the bills: Returns to on-the-job soft skills training (Tech. Rep.). Cambridge, MA: National Bureau of Economic Research.
- Adukia, A.,Asher, S., & Novosad, P . (2020). Educational investment responses to economic opportunity: Evidence from Indian road construction. American Economic Journal: Applied Economics, 12(1), 348–376.
- Agrawal, T. (2012). Vocational education and training in India: Challenges, status and labour market outcomes. Journal of Vocational Education & Training, 64(4), 453–474.
- Ahmed, T. (2016). Labour market outcome for formal vocational education and training in India: Safety net and beyond. IIMB Management Review, 28(2), 98–110.
- Autor, D. H., & Dorn, D. (2013). The growth of low-skill service jobs and the polarization of the us labor market. American Economic Review, 103(5), 1553–1597.
- Autor,D .H ., Levy,F ., & Murnane, R. J. (2003). The skill content of recent technological change: An empirical exploration. Quarterly Journal of Economics, 118(4), 1279–1333.
- Azam, M., Chin, A., & Prakash, N. (2013). The returns to English-language skills in India. Economic Development and Cultural Change, 61(2), 335–367.
- Banerjee, S. (2018). From ‘plantation workers’ to naukrānī: The changing labour discourses of migrant domestic workers. Journal of South Asian Development, 12(2), 164–185.
- Beyer, S. (1990). Gender differences in the accuracy of self-evaluations of performance. Journal of Personality and Social Psychology, 59(5), 960.
- Borghans, L., Duckworth, A. L., Heckman, J. J., & ter Weel, B. (2008). Estimating the technology of cognitive and noncognitive skill formation. Journal of Human Resources, 43(4), 972–1059.
- Börner, K., Scrivner, O., Gallant, M., Ma, S., Liu, X., Chewning, K., … Evans, J. A. (2018). Skill discrepancies between research, education, and jobs reveal the critical need to supply soft skills for the data economy. Proceedings of the National Academy of Sciences, 115(50), 12630–12637.
- Bourdieu, P., & Richardson, J. G. (1986). The forms of capital. New York, NY: Greenwood Publishing Group.
- Bourgois, P. (2003). In search of respect: Selling crack in el barrio (Vol. 10). Cambridge, UK: Cambridge University Press.
- Butler, A. C., Chapman, J. E., Forman, E. M., & Beck, A. T. (2006). The empirical status of cognitive-behavioral therapy: A review of meta-analyses. Clinical Psychology Review, 26(1), 17–31.
- Census. (2011). Primary census abstract for slum, 2011 (Tech. Rep.). Registrar General & Census Commissioner of India, Government of India.
- Chamberlain, B. P., Clough, J., & Deisenroth, M. P. (2017). Neural embeddings of graphs in hyperbolic space. arXiv Preprint arXiv:1705.10359.
- Cochran, W. G. (1963). Sampling techniques (2nd ed.). New York, NY: John Wiley & Sons.
- Converse, J. M. (1984). Strong arguments and weak evidence: The open/closed questioning controversy of the 1940s. Public Opinion Quarterly, 48(1B), 267–282.
- Cunha, F., & Heckman, J. J. (2007). The technology of skill formation. American Economic Review, 97(2), 31–47.
- Cunha, F., Heckman, J. J., & Schennach, S. (2010). Estimating the technology of cognitive and noncognitive skill formation. Econometrica, 78(3), 883–931.
- Darrah, C. N. (2013). Learning and work: An exploration in industrial ethnography. Oxford, UK: Routledge.
- Datta,B .,& Mishra, U. S . (2019). Effect of education–occupation mismatch on wages in India. Indian Journal of Labour Economics, 62(3), 389–411.
- Deming, D. J. (2017). The growing importance of social skills in the labor market. The Quarterly Journal of Economics, 132(4), 1593–1640.
- Deming, D. J., & Kahn, L. B. (2018). Skill requirements across firms and labor markets: Evidence from job postings for professionals. Journal of Labor Economics, 36(S1), 337–369.
- Duraisamy, P. (2002). Changes in returns to education in India, 1983–94: By gender, age-cohort and location. Economics of Education Review, 21(6), 609–622.
- Exley, C. L., & Kessler, J. B. (2019). The gender gap in self-promotion (Tech. Rep.). Cambridge, MA: National Bureau of Economic Research.
- Filmer, D., & King, E. (1999). Gender disparity in South Asia: Comparisons between and within countries. The World Bank.
- Garrido, M., Sullivan, J., & Gordon, A. (2010). Understanding the links between ICT skills training and employability: An analytical framework. In Proceedings of the 4th ACM/IEEE international conference on information and communication technologies and development (pp. 1–10), London, UK.
- Gaurav, S., & Sheikh, R. (2019). The real chowkidars of India: Life beyond the metaphor. Economic Political Weekly, 54(47), 15–17.
- Heckman, J. J. (1979). Sample selection bias as a specification error. Econometrica: Journal of the Econometric Society, 47(1), 153–161.
- Heckman, J. J., & Kautz, T. (2012). Hard evidence on soft skills. Labour Economics, 19(4), 451–464.
- Heckman, J. J., & Rubinstein, Y. (2001). The importance of noncognitive skills: Lessons from the GED testing program. American Economic Review, 91(2), 145–149.
- Helmers, C., & Patnam, M. (2011). The formation and evolution of childhood skill acquisition: Evidence from India. Journal of Development Economics, 95(2), 252–266.
- Himanshu. (2011). Employment trends in India: A re-examination. Economic and Political Weekly, 46(37), 43–59.
- Hofmann, S. G., & Smits, J. A. (2008). Cognitive-behavioral therapy for adult anxiety disorders: A meta-analysis of randomized placebo-controlled trials. The Journal of Clinical Psychiatry, 69(4), 621–632.
- Jain, T., Maitra, P., & Mani, S. (2019). Barriers to skill acquisition: Evidence from english training in India. World Development, 114(February 2019), 314–325.
- Kanjilal-Bhaduri, P. F. (2018). Returns to education and female participation nexus: Evidence from India. Indian Journal of Labour Economics, 61(2), 515–536.
- Kaur, S., Kremer, M., & Mullainathan, S. (2015). Self-control at work. Journal of Political Economy, 123(6), 1227–1277.
- Krishna, A. (2013). Stuck in place: Investigating social mobility in 14 bangalore slums. Journal of Development Studies, 49(7), 1010–1028.
- Krishna, A., Sriram, M., & Prakash, P. (2014). Slum types and adaptation strategies: Identifying policy-relevant differences in bangalore. Environment and Urbanization, 49(2), 568–585.
- Krishnan, P., & Krutikova, S. (2013). Non-cognitive skill formation in poor neighbourhoods of urban India. Labour Economics, 24, 68–85.
- Krueger, A. B., & Schkade, D. (2009). Sorting in the labor market: Do gregarious workers flock to interactive jobs? Journal of Human Resources, 43, 859–883.
- Kumar, R., Mandava, S., & Gopanapalli, V. S. (2019). Vocational training in India: Determinants of participation and effect on wages. Empirical Research in Vocational Education and Training, 11(1), 3.
- Lex Borghans, B. T. W., & Weinberg, B. A. (2009). Interpersonal styles and labor market outcomes. Journal of Human Resources, 43, 815–858.
- Mehrotra, S., Parida, J., Sinha, S., & Gandhi, A. (2014). Explaining employment trends in the Indian economy: 1993-94 to 2011-12. Economic and Political Weekly, 49(32), 49–57.
- Mehrotra, S. A., Gandhi, A., & Sahoo, B. K. (2013). Estimating the skill gap on a realistic basis for 2022. Economic and Political Weekly, 48(13), 102–111.
- Mincer, J. (1974). Schooling, experience, and earnings(no. 2). Cambridge, MA: National Bureau of Economic Research, Inc.
- MOSPI. (2019). Periodic labour force survey (PLFS) July 2017-June 2018 (Tech. Rep.). Ministry of Statistics and Programme Implementation, National Statistical Office, Government of India.
- Murnane, R. J., & Levy, F. (1996). Teaching the new basic skills: Principles for educating children to thrive in a changing economy. New York, NY: ERIC.
- National Commission for Enterprises in the Unorganised Sector and Academic Foundation. (2008). Report on conditions of work and promotion of livelihoods in the unorganised sector. New Delhi, India: Academic Foundation.
- Nickel, M., & Kiela, D. (2017, December). Poincaré embeddings for learning hierarchical representations. Advances in neural information processing systems (pp. 6338–6347), Long Beach, CA.
- Okada, A. (2004). Skills development and interfirm learning linkages under globalization: Lessons from the Indian automobile industry. World Development, 32(7), 1265–1288.
- Pallier, G. (2003). Gender differences in the self-assessment of accuracy on cognitive tasks. Sex Roles, 48(5–6), 265–276.
- Peng, K., Nisbett, R. E., & Wong, N. Y. C. (1997). Validity problems comparing values across cultures and possible solutions. Psychological Methods, 2(4), 329–344.
- Peter-Cookey, M. A., & Janyam, K. (2017). Reaping just what is sown: Low-skills and low- productivity of informal economy workers and the skill acquisition process in developing countries. International Journal of Educational Development, 56(56), 11–27.
- Pilz, M., Gengaiah, U., & Venkatram, R. (2019). Skills development in the informal sector in India: The case of street food vendors. International Review of Education, 61. doi:https://doi.org/10.1007/s11159-015-9485-x
- Polyani, M. (1983). The tacit dimension. Chicago, IL: University of Chicago.
- Popping, R. (2015). Analyzing open-ended questions by means of text analysis procedures. Bulletin of Sociological Methodology/Bulletin de Méthodologie Sociologique, 128(1), 23–39.
- Prasad, S. (2017). Report of the committee for rationalization & optimization of the functioning of the sector skill councils. New Delhi: MSDE.
- Roy, D., Palavalli, B., Menon, N., Pfeffer, K., Lees, M., & Sloot, P. M. (2018). Survey-based socio-economic data from slums in Bangalore, India. Scientific Data, 5. doi:https://doi.org/10.1038/sdata.2017.200
- Salganik, M. J., & Levy, K. E. C. (2015). Wiki surveys: Open and quantifiable social data collection. PloS One, 10(5), e0123483.
- Saxena, P., & Gandhi, A. (2014). Reforming apprenticeship training. In S. Mehrotra (Ed.), India’s skills challenge: Reformingvocational education and training to harness the demographic dividend (pp. 87–176). New Delhi: Oxford University Press.
- Schuman, H., & Presser, S. (1979). The open and closed question. American Sociological Review, 44(5), 692–712.
- Schuman, H., & Scott, J. (1987). Problems in the use of survey questions to measure public opinion. Science, 236(4804), 957–959.
- Sen, S. (1999). Beyond the ‘working class’: Women’s role in India’s industrialisation. South Asia: Journal of South Asian Studies, 22(2), 95–117.
- Sengupta, A. K., Srivastava, R. S., Kannan, K. P., Malhotra, V. K., Yugandhar, B. N., & Papola, T. S. (2009). The challenge of employment in India: An informal economy perspective (Report of the National Commission for Enterprises in the Unorganised Sector, Government of India, Vol. 1). New Delhi, India: National Commission for Enterprises in the Unorganised Sector, Government of India.
- Sheikh, R. A., & Gaurav, S. (2020). Informal work in India: A tale of two definitions. European Journal of Development Research, 32(4), 1105–1127.
- Taylor, J., & Tibshirani, R. J. (2015). Statistical learning and selective inference. Proceedings of the National Academy of Sciences, 112(25), 7629–7634.
- Tibshirani, R. (1996). Regression shrinkage and selection via the lasso. Journal of the Royal Statistical Society: Series B (Methodological), 58(1), 267–288.
- Tibshirani, R., Walther, G., & Hastie, T. (2001). Estimating the number of clusters in a data set via the gap statistic. Journal of the Royal Statistical Society: Series B (Statistical Methodology), 63(2), 411–423.
- Verick, S. (2018). Female labor force participation and development. Bonn, Germany: IZA World of Labor.
- Weinberger, C. J. (2014). The increasing complementarity between cognitive and social skills. Review of Economics and Statistics, 96(4), 849–861.
- West, M. R., Kraft, M. A., Finn, A. S., Martin, R. E., Duckworth, A. L., Gabrieli, C. F., & Gabrieli, J. D. (2016). Promise and paradox: Measuring students’ non-cognitive skills and the impact of schooling. Educational Evaluation and Policy Analysis, 38(1), 148–170.