
 ?Mathematical formulae have been encoded as MathML and are displayed in this HTML version using MathJax in order to improve their display. Uncheck the box to turn MathJax off. This feature requires Javascript. Click on a formula to zoom.
Abstract
We estimate the community-level impact of foreign aid projects on women’s empowerment in the country with the most complete recent record of geo-coded aid project placement, Malawi. Our estimates can thus be interpreted as the average impact of aid from many different donors and diverse projects. We find that aid in general has a positive impact, in particular on an index of female agency and women’s sexual and fertility preferences. Gender-targeted aid has a further positive impact on women’s sexual and fertility preferences, and more tentatively on an index focusing on gender-based violence. However, the positive impact of gender-targeted aid disappears in patrilineal communities, and men’s attitudes towards female agency in the areas of sexuality and fertility are even negatively affected. This suggests that donors need to consider that the impact of aid on female empowerment can depend on the community context when they decide on aid project design and placement.
1. Introduction
Female empowerment and the welfare of girls and women have been a primary concern for the OECD donor community at least since the United Nations declared the Decade for Women in 1975. This initiative has been followed by numerous others, such as the inclusion of an explicit gender equality goal in the 2030 Agenda for Sustainable Development and feminist foreign aid policies recently implemented by some donor countries. Against this background, surprisingly little quantitative analysis has been conducted to assess the effectiveness of foreign aid in fostering female empowerment beyond impact evaluations of specific aid-financed projects targeting narrow outcome measures.
In this paper, we offer a first assessment of the community-level impact of the presence of foreign aid projects on female empowerment. To measure how exposed a community is to foreign aid, we follow a recent literature using geo-coded data on aid project location and treat all households in the vicinity of aid projects as exposed to aid (e.g. Roberts & Dionne, Citation2013; De & Becker, Citation2015; Briggs, 2017; Odokonyero et al., Citation2018; Isaksson & Kotsadam, Citation2018; Knutsen & Kotsadam, Citation2020). Several of these previous studies rely on aid provided only by one or two donors, typically the World Bank and China, for which comprehensive data-sets exist covering many projects across many different recipient countries. For most partner countries, though, this is just a fraction of total aid inflows. This implies that exposure to aid within each country can only be captured with considerable noise. As we are interested in estimating the average impact of exposure to aid in general, we need a richer variety of donors in our sample and a more complete coverage of the universe of aid-financed interventions that households are exposed to. We therefore focus the analysis on Malawi as this is the country with the most complete geo-referenced record of recent aid projects across a broad range of donors. Beyond aid in general, we are also interested in estimating the impact of projects with a specific gender focus. We classify a project as gender-targeted if its title, project description, or activity list include any of the following words: women, girl, bride, maternal, gender, genital and child.Footnote1
There exists no established single indicator of female empowerment. Foreign aid is often invested in activities that are believed to foster empowerment and agency, such as education, job creation, access to loans, and political representation and engagement (e.g. Baliamoune-Lutz, Citation2016; Banerjee, Duflo, Glennerster, & Kinnan, Citation2015; Chattopadhyay & Duflo, Citation2004; De & Becker, Citation2015; Desai & Olofsgård, Citation2019; Pickbourn & Ndikumana, Citation2016). But to capture actual empowerment, scholars typically turn to survey responses related to attitudes towards domestic violence, women’s sexual rights, and fertility decisions, as well as exposure to violence, freedom of mobility, and influence over important household decisions. To get a broad picture, we look at several different indices that have been developed and used previously in the literature, and that are complementary in the sense that they focus on related but not identical dimensions of empowerment, or agency.
To capture causal impact, we follow a difference-in-differences approach to separate potential selection effects from the impact of the aid projects. We first differentiate between survey clusters located in areas that have, at some point during the time period analyzed, been exposed to aid projects (our treatment group), and those in areas that have not (our control group). This approach has been pioneered by Isaksson and Kotsadam (Citation2018). We then exploit the set of projects started in-between two survey rounds of the Malawi Demographic and Health Survey (DHS), to be able to run difference-in-differences analysis. To get samples of treated and control units with a reasonable covariate balance, we restrict the analysis to rural areas, and we create a grid of latitude and longitude deciles to use grid cell-specific fixed effects. We also test for differential trends prior to treatment, exploiting earlier DHS survey rounds, and our results largely suggest parallel pre-treatment trends (see the Supplemental Material).
We find that aid projects generally have a positive impact on female empowerment in local communities, though modest in size. The impact is present for both a more narrow and a wider treatment area, and quite persistent over time. Moreover its strength varies across different sub-dimensions. The most consistent impact is found on our aggregated index: the presence of any aid project increases it between 3 and 6 percentage points across specifications. Having gender-targeted aid in the community also has an additional positive impact of about 2 percentage points. For an index of female agency developed in Jayachandran, Biradavolu, and Cooper (Citation2023), which centers on women’s say over major purchase decisions within the household, decisions over children’s health care, and freedom of mobility, we find evidence of a positive impact primarily from general aid, whereas any additional impact of gender-targeted aid is more tentative. An index of women’s attitude with regards to sexual rights and fertility preferences benefits from both general aid projects and gender-targeted ones, while the same index of men’s attitudes is unaffected. Finally, using an index developed and applied in Haushofer and Shapiro (Citation2016), focusing on attitudes towards wife beating, experience of physical, sexual, or emotional abuse, and a set of male attitudes, we find evidence of a small positive impact for gender-targeted aid but not for aid in general. The results for the latter index should be interpreted with some care, though, as they are less robust to alterations in the exact specification of the model compared to the other indices.
The exception to the positive impact is found in patrilineal communities, where women have weaker land rights. In these areas we find that both general aid and gender-targeted aid have a negative impact on men’s attitudes towards female agency in the areas of sexuality and fertility. Any positive impact of gender-targeted aid on the other indices also turns negative, though these results should be interpreted with care as they are estimated with less precision. These results illustrate the need to understand the local context to design interventions in the most effective way.Footnote2
In the next section, we briefly discuss the situation of women in Malawi. In Section 3 we present the data used in our analysis. Section 4 presents the empirical strategy while Section 5 reports our results. In Section 6 we discuss the mechanisms behind our results and highlight the contributions of our analysis relative to the existing literature, and finally we conclude in Section 7.
2. Gender equality in Malawi
Malawi is one of the most aid dependent countries in the world, with net official development assistance (ODA) exceeding 10 percent of gross national income every year since 1975, and reaching 23.5 percent in 2016 (World Bank, WDI database). Malawi also scores poorly on gender equality in global indices, although largely in line with other low income countries in sub-Saharan Africa. In the World Economic Forum Gender Gap Report 2020, Malawi is ranked as 116 out of 153 countries, while in UNDP’s Gender Inequality Index the same year, the country is ranked 172 out of 189. School enrolment rates in primary and secondary education have increased substantially in recent times for both girls and boys, but men are twice as likely to have gone to primary school and five times as likely to have attended secondary school in the +65 cohort (Schwab et al., Citation2017). Female labor force participation is relatively high, 72.6 percent in 2019, but according to World Bank data the gender ratio has fallen from 0.97 to 0.88 between 1990 and 2017 partly due to falling female labor force participation. Women are also underrepresented in national politics, occupying only 22.9 percent of positions in the parliament and 39 percent of ministerial positions (Sharma et al., Citation2020).
The government of Malawi has implemented several laws to bolster gender equality and protect women’s and girl’s welfare. The 2013 Gender Equality Act and the 2015 Marriage, Divorce and Family Relations Bill raised the minimum legal age of marriage from 15 to 18, strengthened legislation on gender-based violence in any form, and universally condemned any gender-based discrimination. The reach of these laws is however constrained by customary laws and traditions, in particular among more disadvantaged segments of the population. Malawi still has one of the highest child marriage rates in the world: 9 percent of girls are married by the age of 15 and 42 percent by the age of 18. Associated with this, 31 percent of women report to have given birth by the age of 18 (UNICEF, 2017). Acceptance for gender-based violence, on the other hand, has come down quite substantially between 2004 and 2010.Footnote3 Among women in the ages 15–49 acceptance went down from 28.2 percent to 12.6 percent, whereas among men aged 15–54 acceptance went down from 16.1 percent to 12.6 percent. This drop in acceptance has not been accompanied by a drop in reported exposure to violence, though. These numbers have instead increased between 2004 and 2010, in particular intimate partner sexual violence, which went from 13.4 percent of female respondents to 18.9 (Mellish, Settergren, & Sapuwa, Citation2015). These patterns may at least partly be attributed to the fact that lower levels of acceptance can lead to an increased probability to report violence.
There is also variation across geographical areas with different traditions and norms. Some regions of Malawi have extensive prevalence of matrilineal tenure systems for land, which implies that land passes through women to the nearest matrilineal male, and chieftaincy is handed down through the female line. In matrilineal uxorilocal marriages, where the husband moves into the wife’s village, women inherit custodial ownership of land and the husband can be chased away upon the death of his wife. This has been studied to understand whether (slightly) stronger female land rights can empower women and potentially improve smallholder productivity. Djurfeldt, Hillbom, Mulwafu, Mvula, and Djurfeldt (Citation2018) find that women in Malawi have more say over spending decisions and that more money are diverted toward family needs in matrilineal and uxorilocal communities. Agrarian decisions, on the other hand, are predominantly taken by the men in any type of community, and they find no significant differences in household incomes or food security.
3. Data
Our approach to understanding how gender outcomes and attitudes co-vary with the presence of aid projects relies on the possibility of linking the precise location of aid projects to geo-coded household-level data. Given that we are interested in understanding the average effect of any type of aid project from any donor, we prioritize aid data coverage over diversification across many different partner countries. The most common approach in the literature is to look at the projects financed by the World Bank or China, or a comparison between the two, because these are the only donors for which there exists comprehensive geo-coded data sets across many countries and years. This is the superior approach if the explicit purpose is to understand the impact of aid from these donors as such, or if the aim is to do a comparative analysis between representatives of two different aid models. However, it is a very noisy measure of aid exposure in general since these donors only constitute a small share of overall aid within any partner country (in particular, World Bank’s projects account for 4% of projects and 12% of commitments in Malawi’s Aid Management Platform (AMP), 10% of projects in our sample). Here we choose instead to focus on just Malawi, since this is the receiving country with the most complete mapping of aid projects available: at least 80% of total aid flows in recent years are geo-coded (Peratsakis, Powell, Findley, Baker, & Weaver, Citation2012). This gives us a much less noisy classification of households into treated and control, i.e. exposed to aid or not.
3.1. Treatment variables
The AidData consortium provides geo-coded information on all aid projects reported to Malawi’s Aid Information Management Systems (AIMS).Footnote4 More precisely, we use the Geocoded Activity-Level Data from the Government of Malawi’s AMP. This data set covers 80% of all externally funded projects initiated in the period 1996–2011, which corresponds to a total of 2,523 project locations. For the purpose of our analysis, we are focusing on projects implemented within the 2004–2010 window, which corresponds to 91% of the total.
The project locations are provided with different levels of precision. Following the literature, we limit our sample to only include projects where the geographic coordinates correspond to the exact location (precision code 1) or a location known to be within 25 km of the reported coordinates (precision code 2). In other words, we exclude projects formally allocated to the whole administrative area of the district or above, including budget support. In the Supplemental Material we provide a table that compares the composition of aid at precision code 1 and 2 with that of aid at more aggregated levels across sectors. As expected, in some areas budget support dominates (democratic and economic governance) but in areas most directly relevant for female empowerment at the household level (education, health, gender/youth development/sports, or water/sanitation/irrigation) a similar or larger share of projects are defined at the local level.
Our first treatment, the presence of at least one aid project in the immediate vicinity of a household, is constructed by drawing a circle with a 10 km radius around each household’s location, approximated by the DHS cluster coordinates, and checking whether any type of aid project was implemented in this area during the relevant time period.
The appropriate radius to define the treatment is debatable. On the one hand, there are purely statistical considerations such as the size of the treatment and control groups and the noise implied by potential miss-classification of individual units. Figure 3 in the Supplemental Material shows that, while the distribution of household distance to the nearest aid project lies on a continuum, the mass drops rapidly over the 10 km bound. This implies that using a much larger radius would leave us with very few ‘untreated’ observations. On the other hand, the very idea of impact of a development project is linked to the question of how far the presence of a facility (e.g., school, clinic, other service delivery point, and infrastructure) is noticeable and impacting the individual’s conditions, and how far is too far. Obviously this will depend on the type of project. To give an idea, less than 2% of the respondents in the 2004 Malawi DHS lived farther away than 15 km from a health facility. In half of the school districts in Malawi the average distance to a school is less than 4 km (Ravishankar, El-Kogali, Sankar, Tanaka, & Rakoto-Tiana, Citation2016). The average distance to a water source is 1 km and to an all-weather road 2 km. Our choice of radius is an attempt to strike a balance between these very different acceptable distances, taking into account the substantial variation in the nature of the aid projects we study.
According to this definition, each DHS cluster is exposed to on average 4 aid projects (and a maximum of 59), which can be seen in in the Supplemental Material. Each aid project affects (at a distance of 10 km or less) on average 5 clusters in the 2004 wave (median 3, max 27), and 7 clusters in the 2010 wave (median 4, max 45).Footnote5
Our second treatment is the presence of at least one ‘gender project’, which is constructed in the same way as our first treatment variable but focusing exclusively on projects with a specific gender component. In order to identify these projects, we rely on a text analysis of project titles, description and activity lists. More precisely, we label a project as gender-targeted if its title, project description, or activity list include any of the following words: women, girl, bride, maternal, gender, genital, and child. There are 248 projects that meet this definition, and we don’t see any particular trend in the use of these terms over time. in the Supplemental Material reports the titles of all the projects categorized as ‘gender aid’, while reports summary statistics on the frequency and duration of aid and gender-aid projects.Footnote6
3.2. Outcome variables
The outcomes used in the main analysis are retrieved from the 2004 and 2010 waves of Malawi’s Standard DHS, including information on, respectively, 14,682 individuals from 521 clusters (11,448 women in the age range 15–49 and 3,234 men in the age range 15–54), and 29,738 individuals from 849 clusters (22,684 women in the age range 15–49 and 7,054 men in the age range 15–54). Clusters include on average 25 households (min 4, max 40). Crucial for our empirical strategy, the DHS include geo-coded information on the location of the household clusters that participated in the surveys.
From these data, we build a number of indices. As a first step, we look for inspiration in the literature. Haushofer and Shapiro (Citation2016) build a female empowerment index to evaluate the impact of an unconditional cash transfer program by GiveDirectly, using survey questions that in large part, although not perfectly, overlap with DHS questions. In particular, the index captures experiences of violence, together with men’s and women’s attitudes towards violence, but also some measures of decision-making and control over household resources. We reproduce this index as closely as the DHS data allows us, following the same aggregation methodology.
In a more recent contribution to the literature, Jayachandran et al. (Citation2023) identify a set of common survey questions that best capture the concept of women’s agency by comparing responses to close ended questions in survey format to responses to open ended questions in focus group interviews. These questions focus on women’s say in important family decisions. Again, we reproduce this index choosing the corresponding variables from the DHS questionnaire and following the same methodology for aggregation.
We then identify one more domain that has been, in previous literature, included in studies of ‘women status’ and is not covered by these two indices, namely sexual and fertility preferences. We build two indices of related variables available in the DHS, separately for male and female respondents. Finally, we build a general index that aggregates all the four. A more detailed description of the DHS questions used in the different indices and the aggregation methods is given in Appendix A.
4. Method
The main methodological challenge lies in the identification of the causal effect of aid. It is possible that donors seek out areas where the local population have certain attitudes or are more responsive to new opportunities, either deliberately to increase the chances of a successful project or because this correlates with other factors that go into project-placement decisions. The opposite may be true if donors are targeting particularly poor or isolated communities. These factors, which potentially coexist, would bias the estimation of aid effectiveness in different directions.
To separate selection from treatment effects we suggest a difference-in-differences specification where we define as treated survey clusters located in the vicinity of an aid project implemented during the 2004–2010 window, and other survey clusters as controls. Note that DHS does not typically return to the same communities, so this is a repeated cross-section rather than a panel. In other words, we match 2004 DHS respondents with aid projects implemented in their neighbourhood after 2004, and 2010 respondents with aid projects implemented before 2010 as our treatment group. This sample hence provides the opportunity to examine the difference-in-differences between a treated and control group before and after treatment. As we cannot observe the same individuals or the exact same clusters over time, we control for geographic fixed effects, based on a grid of latitude and longitude deciles. This results in blocks of equally-populated latitude and longitude increments, with an average surface area of ca 5,000 square km.Footnote7 For comparison, a 50 km radius circle, which is a commonly used unit in this literature (for example in Isaksson and Kotsadam (Citation2018) at baseline) has an area of 7,850 square km.Footnote8
The baseline equation we are estimating is the following:
(1)
(1)
where i indexes individual respondents, t indexes time (or survey wave),
is the indicator for the presence of any aid-financed project within the established radius from the household, while After is an indicator for the 2010 respondents, who are interviewed after potential exposure to aid. The main variable of interest is the interaction between the indicators
and After. The regression also includes the number of project-years implemented at the district level and individual-level controls including age, ethnicity, household size, a Muslim dummy, years of education and literacy, in the matrix Qit.Footnote9
is the geographic fixed effect, controlling for each specific cell of our latitude and longitude grid. Standard errors are cluster robust at the level of the DHS cluster.
When it comes to assessing the impact of exposure to gender-specific aid, we include in Equationequation (1)(1)
(1) the corresponding indicator variable for exposure to any aid projects classified as gender-specific, according to our definition. Note that focusing on gender aid leads to a selection biased towards households in the vicinity of more projects in general, i.e. a more intensive treatment. To adjust for this, we also control for the total number of aid projects in these specifications, interacted with After, see Equationequation 2
(2)
(2) . It follows that the estimated coefficient for gender aid presence measures the impact of having at least one gender project in the vicinity while otherwise having the same exposure to general aid intensity.
(2)
(2)
To make our treatment and control samples more comparable we limit our analysis to rural locations. Urban survey clusters almost all fall in the treated sub-sample, and it is well known that gender norms can vary between urban and rural communities.Footnote10 Appendix C discusses the pre-treatment balance of covariates, testing whether exposed and never-exposed households in our sample are significantly different in some relevant respects. The means are statistically different for a small set of variables, but the sizes of these differences are small. In and we report both unconditional estimations in a parsimonious model and results when controlling for these variables.
Table 1. Impact on women’s status indices, all aid
Table 2. Impact on women’s status indices, gender aid
To check for parallel trends prior to the implementation of the aid projects in our sample, we also collected information from the Malawi DHS conducted in year 2000. We then run a specification identical to our main analysis but on the 2000 and 2004 survey rounds, using the treatment and control classification based on aid projects implemented after 2004. Results are presented in in the Supplemental Material and show that our dependent variables follow parallel trends in treated and control areas in the period before implementation of the aid projects.
It is worth pointing out that the use of geo-coded aid project data and the focus on community-level impact has some methodological advantages. It can help with alleviating some of the known concerns with project-specific evaluations, such as external validity and site selection bias (e.g. Bold et al., Citation2018; Deaton & Cartwright, Citation2018; Allcott, Citation2015). It is furthermore possible to estimate more long-term effects, and no involvement of the researcher prior to project implementation is necessary. It is therefore less expensive and intrusive, and it allows for the possibility to perform retrospective analysis making use of existing data. Compared to cross-country analysis, the main advantage is the ability to control for potential confounding factors at finer geographic levels, facilitating the creation of a control group with more similar conditions in terms of institutional arrangements, culture and climate. Moreover, many aid investments target local development and cannot be expected to yield results large enough to be isolated and detected at the country level (e.g. Dreher & Lohmann, Citation2015; Findley, Powell, Strandow, & Tanner, Citation2011).
5. Results
reports our main estimates of the impact of aid on the 5 indices described in Section 3.2: the Haushofer and Shapiro (Citation2016) index of female empowerment (HS), the Jayachandran et al. (Citation2023) index of women’s agency (JBC), our two indices of attitudes in the sexual and reproductive sphere for women and men separately (WA and MA), and finally the aggregate of all four (Index). The estimated difference-in-differences impact is given by the variable After:Exposure. Panel A reports the unconditional differences, while Panel B includes controls and geographic fixed effects. The inclusion of the latter generally does not affect coefficients’ size or statistical significance more than marginally.
The impact of aid on HS and in particular MA is very close to 0, while the other indices reveal a positive impact: presence of aid projects in the neighborhood increases the agency index, the women’s attitude index as well as our general index by 11 to 31% of their respective mean (reported at the bottom of the table).
In , we turn to the impact of exposure to gender-targeted projects. Controlling for individual characteristics and geographic fixed effects makes more of a difference in this case. Focusing on Panel B, the results suggest that, controlling for aid intensity, having at least one of the nearby projects specifically focused on gender increases the HS empowerment index by 50 percent of the mean. The women’s attitude index and the general index are increased by around 7%, respectively 17%, of their mean.
Only a few donors give gender-targeted projects. In the Supplemental Material we provide evidence meant to reduce concerns that the effect estimated in is due to some characteristics of these donors rather than the specific gender focus of the projects. Figure 4 shows that projects from ‘gender donors’ i.e. donors who give gender projects, are geographically well mixed with projects from other donors. Table A5 in the Supplemental materials shows the distribution of donors that are present in the neighborhood of household clusters who receive gender projects and who don’t. They are very similar, implying that households exposed to gender projects are not exposed to a very particular selection of donors. Finally, to show that the effect of gender projects is not due to some other features specific to these projects, we report in Table A7 in the Supplemental materials summary statistics of gender projects as compared to non-gender projects. It can be seen that gender-targeted projects are smaller on average in terms of monetary commitments, but roughly equal in terms of duration. We find it unlikely that the smaller size would drive an additional impact of these projects.
In we provide some further analysis of these results, for general aid in Panel A, and for gender targeted aid in Panel B. For brevity we only report the coefficient on the the variable After:Exposure, and to facilitate comparisons we replicate the baseline results from and in Row 1. As we motivated in Section 3.1, we have good reasons to choose 10 km as the radius for our sample. Yet, radius size is admittedly somewhat arbitrary, so testing what happens if the radius is increased may be warranted, also in order to gauge whether the impact shown in and can be thought of as aggregating up at the macro scale, or if it is rather limited to the local level. Therefore, in Row 2 of the respective panels, we present results from extending the radius to 20 km. This means a much lower number of control units, which reduces precision of the estimates as can be seen. However, with the exception of the women attitude index and general aid, coefficients are larger, for both types of aid projects. This suggests that the effect of aid extends beyond the very local surroundings and remains noticeable even as the distance increases.
Table 3. Extended results
In order to understand the magnitude of the impact on women’s lives it is also relevant to analyze how persistent the impact is over time. Many impact evaluations are constrained time-wise, while we have a somewhat longer time window, and can differentiate between projects implemented more recently and projects more distant in time. For that purpose we re-estimate our models in Row 3 of only considering projects started within 5 years from the DHS interview. Results are very similar to those in our base specifications, suggesting that the impact of aid stays rather constant over time, at least within the time window we can study.
In Row 4 we present results when exploiting the variation in the number of projects households are exposed to, rather than just an indicator variable of exposure, to estimate the average impact of the marginal project. We anticipate this effect to be similar in direction but smaller as there are probably diminishing returns to exposure to aid projects. This is also what we find, except that the coefficient on the male attitude index turns from very small and negative, to very small and positive.
Finally, in Row 5, labelled InterFE and reported after the number of observations for the first three models, we include an interaction between our geographic fixed effect and our time dummy (After) in order to test the robustness of our results to shocks that are contemporaneously geography and time specific. Results are broadly similar, although the additional effect of gender aid turns insignificant in this data-demanding specification. Note that this requires the use of so many interaction terms that our sample of male respondents for the Male Attitude (MA) Index becomes too small, so we cannot generate results for this index.
Overall, the main message from our base specifications remain as we test for these different alterations of the model, even though results for the Haushofer-Shapiro index seems somewhat less robust and consistent across specifications compared to the other indexes.
5.1. Matrilineal versus patrilineal areas
Getting back to the discussion in Section 2 we test in this section for differential impacts in areas with a matrilineal versus patrilineal tenure system for land. We base our definition of matrilineal societies on the ethnic identification of individual respondents, with ethnic groups classified as matrilineal being: Chewa, Lomwe, Yao, Ngoni, and Nyanja, based on Ibik (Citation1970).Footnote11 Matrilineal areas are then defined as clusters where the share of matrilineal ethnic groups is above the mean (73%). in the Appendix shows the geographical distribution of matrilineal communities thus classified, clearly concentrated in the central regions. This exercise can be seen as a test of the hypothesis that development policies interact with preexisting cultural norms and socio-economic differences, and their effectiveness can be importantly enhanced or limited by the context in which they are implemented, a similar idea as in for instance Ashraf, Bau, Nunn, and Voena (Citation2020).
In and we present the analysis of respective communities separately. The smaller sample sizes generally adds some noise to the estimates, meaning fewer results are statistically significant at conventional levels. Estimated coefficients are very similar, though, in the matrilineal communities compared to the complete sample, and for women’s attitudes and the overall index are even larger for gender aid. In patrilineal societies, however, we observe some substantially different results. First, both general and aid targeted aid has a statistically significant negative impact on men’s attitudes. Second, for gender-targeted aid, almost all estimated coefficients are negative, though not statistically significant.Footnote12 Our findings are thus consistent with the argument that pre-existing community characteristics can affect the effectiveness of development interventions. In particular, aid-financed projects, and even more so if targeting women’s needs, can cause a backlash in men’s attitudes towards women’s sexual and fertility preferences in certain communities.
Table 4. Impact in matrilineal areas
Table 5. Impact in patrilineal areas
6. Discussion
There is a large literature based on impact evaluations of often aid-financed interventions targeting women and girls. We look to it to find help in disentangling the underlying mechanisms behind our results, that aid projects in general have a positive impact on female empowerment, and gender targeted aid in some cases even more so.
Foreign aid has been shown to directly contribute to women’s bargaining power by improving their outside options through access to education and income earning opportunities (see e.g. Chin, Citation2012; Gakidou, Cowling, Lozano, & Murray, Citation2010; Keats, Citation2018; McCrary & Royer, Citation2011; Thomas, Citation1990). Foreign aid also has the potential to slowly change community norms that limit women through targeted information drives, discussion groups and edutainment broadcasts (Dhar, Jain, & Jayachandran, Citation2022; Kim et al., Citation2007; Kiplesund & Morton, Citation2014; Pulerwitz et al., Citation2015). These changes in norms can also spread through networks beyond direct beneficiaries of an intervention, as illustrated in the analysis of health workers in the Matlab region of Bangladesh by Munshi and Myaux (Citation2006). Similarly, evaluating the impact of an unconditional cash transfer program on their female empowerment index, Haushofer and Shapiro (Citation2016) estimate spillovers at the community level indistinguishable in size from the impact on direct beneficiaries. Foreign aid thus carries the potential to affect women’s relative economic standing and alter community norms with regards to the role of women, suggesting mechanisms through which our results can be understood.
Relative to this literature, though, the first contribution we make in this paper is that, by providing a broader assessment, we can capture the average impact of aid-financed development projects that are geographically diverse, that target fundamentally different outcomes, and are implemented by different organizations and donors.Footnote13 The studies above aim to identify the causal impact of a particular type of (potentially aid-financed) intervention, often on a quite specific and narrow outcome measure of female empowerment, not estimate an average level of aid effectiveness. As discussed in the aid-effectiveness literature and illustrated by the so called ‘micro-macro paradox’ (Mosley, 1986), social value added at the individual project level does not necessarily imply a measurable positive impact at a more aggregated level.
That gender targeted aid should have an additional impact may seem obvious, but as pointed out in for instance Duflo (Citation2012), economic development and female empowerment in most, albeit not all, dimensions are positively correlated. It follows that effective aid projects with no explicit gender component but succeeding in promoting economic development may potentially do as much benefit to female empowerment as specifically gender targeted aid projects. It is also the case that, since the Beijing Platform of Action in 1995, all aid should be gender mainstreamed, i.e. gender concerns should be integrated into all policy and program cycles, and governments should engage with donors in a dialogue on gender and development. It follows that also projects not defined as gender targeted according to our definition may have design elements that carry potential for benefits particularly for women, such as job opportunities. The extent of actual gender mainstreaming, and its effectiveness when applied, has been questioned though. Grown, Addison, and Tarp (Citation2016) rather suggests that it detracts resources from real focused investments in gender projects and programs, that carry larger benefits. Our second contribution is thus that by differentiating between gender-targeted aid and general aid we can also shed some light on the discussion on the need for gender-targeted projects.
To understand the mechanisms behind the differential impact of aid in some dimensions in matrilineal and patrilineal communities we can learn from a literature looking at how preexisting community norms and institutions affect the effectiveness of policy interventions. Ashraf et al. (Citation2020) find that school construction increases girls education in communities that practice bride price, as this price goes up with the girl’s level of education, but has no effect in communities that don’t. Similarly, De Brauw, Gilligan, Hoddinott, and Roy (Citation2014) find that Brazil’s Bolsa Familia program (a conditional cash transfer program targeted to women) has a positive impact on female decision-making power in urban households, but not in (typically more traditional) rural households. Angelucci (Citation2008) finds that cash transfers targeted to women together with human capital investments generally reduce intimate partner violence, but have the opposite effect in households where the husbands have traditional views on gender roles. There is also evidence that norms with regards to wife beating can affect the link between women’s opportunities more generally and intimate partner violence. Cools and Kotsadam (Citation2017) find that employed women face greater risk of abuse in communities with relatively higher acceptance of wife-beating. Heise and Kotsadam (Citation2015) find that there is a stronger negative relation between education and exposure to domestic violence in countries where wife abuse is more accepted. Finally, Kotsadam, Østby, and Rustad (Citation2017) find that mining, with the economic opportunities it generates, causes more domestic violence, but only in areas where such abuse is more accepted.
There is also a substantial literature suggesting that ownership of land empowers women, and contributes to the welfare of the family (e.g. Agarwal, Citation1994; Sen, Citation1990). Empirical analysis has suggested that the division of property rights influences for instance fertility decisions, decision power over important family matters, work outside the household, age of marriage and the nutritional status and education of girls (Allendorf, Citation2007; Deininger, Jin, Nagarajan, & Xia, Citation2019; Field, Citation2007). Some studies have also argued that the strength of women’s land rights has a positive impact on the efficiency of land use, and through that on family income (e.g. Udry, Citation1996).
Turning more explicitly to matrilineal inheritance rules, that women are key for determining inheritance rights and have greater support from their kin network may suggest an improved outside option relative to women in patrilineal societies, and thus increased within-household bargaining power. Lowes (Citation2021) finds that women in matrilineal societies are less likely to accept the use of domestic violence and also less likely to have been exposed to such violence. A similar pattern is found in Malawi, where support for wife beating and exposure to violence are lower in the central and southern regions, that are primarily matrilineal, compared to the patrilineal north (Mellish et al., Citation2015). Lowes (Citation2021) also finds that children have better health and educational outcomes in matrilineal societies, and women have more say over household decisions. Jayachandran and Pande (Citation2017) find that son preference, captured by height differences between first sons and other children, is smaller in matrilineal societies in India.
The third contribution of this paper, in light of the literature above, is to offer an assessment of whether the local institutional context modulates the impact of aid projects on average. Our findings that aid in general, and in particular gender-targeted aid, contributes more consistently to female empowerment in matrilineal societies, and may even cause a backlash among men in patrilineal communities, carries some policy implications. It is difficult to identify from exactly where the difference comes, as these communities may vary in many different dimensions. One such dimension, as illustrated by some of the work above and confirmed by our own data, is that gender norms to start with differ between these communities. More in depth research is necessary, though, to identify more cleanly the role of preexisting gender norms specifically, and if the impact also varies with types of aid investments.
7. Conclusions
There is no shortage of academic papers on the impact of foreign aid on economic growth, but surprisingly few studies address the impact on another important objective of foreign aid, female empowerment. In this paper we use geo-coded data on aid project placement within Malawi together with survey responses from the Malawi Demographic and Health Surveys (DHS) to capture community level effects of aid presence on several measures of female empowerment previously used in the literature. The analysis also separates between projects explicitly targeting gender equality and other aid. To reduce concerns about endogenous placement of aid projects, we use a difference-in-differences specification on a rural sample of survey respondents, distinguishing between survey clusters that are in the neighborhood of aid projects and those that are not, and exploiting the timing of project implementation.
We find that aid presence has a robust positive impact of moderate size on several dimensions of female empowerment. We identify a positive impact of aid in general, and an additional impact of gender-targeted aid, on our overall index and an index capturing women’s control over decisions in the areas of sexuality and fertility. We also find a positive impact of aid in general on female agency, and more tentatively of gender-targeted aid on an index focusing on violence against women. Results are weaker, though, when we focus on areas dominated by patrilineal land inheritance traditions. The impact of both general aid and gender-targeted aid on men’s attitudes towards female decision power over their sexuality and fertility decisions is even negative. The estimates of the impact of gender-targeted aid on the other indices also turn negative, but this should be interpreted with care as these results are estimated with less precision. These results suggest that foreign aid can have a positive influence on female empowerment, but also that the impact can vary between communities with different pre-conditions.
This paper has offered a first exploration of the impact of foreign aid on female empowerment using data on aid project placements. As more such data becomes geo-coded, the ability to expand the geographic reach while still including aid from multiple donors will help with external validity. Also, our study points out some overall results, but from a policy perspective, with more data, more could be learned from disaggregating aid projects across sectors, types of investments and possibly also donors, to better understand the relative contribution to female empowerment from different aid projects and modalities. Finally, research into how to best match the design of interventions with the characteristics of the community could have great policy value.
Supplemental Material
Download PDF (389.9 KB)Acknowledgements
The authors are grateful for comments from Markus Goldstein, Masayuki Kudamatsu, Ann-Sofie Isaksson, Jonathan Lehne, Nathan Nunn, Martina Björkman Nyqvist, Alex Trew and Maiting Zhuang. Previous versions of the paper have been presented at CSAE 2017, Stockholm School of Economics, Namur University, Pennsylvania State University and the ASWEDE 2021 conference. This paper originated within the UNU-WIDER project on ‘Gender and Development’. All remaining errors are our own. Research funding from the Swedish Research Council, grant number 2018-01342, is greatly appreciated.
Disclosure statement
All authors certify that they have no affiliations with or involvement in any organization or entity with any financial interest or non-financial interest in the subject matter or materials discussed in this manuscript.
Data availability statement
Datasets generated for and analyzed in the current study are available at the Dataverse Project repository, https://doi.org/10.7910/DVN/KTLSQT.
Additional information
Funding
Notes
1 A list of the resulting project types can be found in the Supplemental Material.
2 The level of female empowerment is stronger in matrilineal societies as we show in the Supplemental Material, so it is possible that preexisting gender norms affect the impact. But since these communities may differ also in other aspects, we cannot attribute causal impact on preexisting gender norms alone.
3 As measured through DHS surveys by respondent’s agreement with at least one of five given reasons whether a husband is justified to beat his wife, i.e. if she burns the food, argues with him, goes out without telling him, neglects the children, or refuses to have sexual intercourse with him.
4 The AIMS was developed and introduced by the State Committee on Investments and State Property Management (SCISPM) with technical support from the UNDP and funded by the Department for International Development (DFID). It is a web-based Aid Management Platform (AMP) that allows governments of developing countries and their donors to share and analyze aid information. The data and information collected include the number of implemented projects and agreements, their cost, terms, and duration, and executing and implementing agencies.
5 In the main specification we use as treatment an indicator variable. In robustness checks, we replicate results using instead the number of projects each household is exposed to, within the same spatial area. Projects do also differ in financial size, but unfortunately we do not have information on aid commitments at the level of aid project placements so we cannot explore that variation in intensity of exposure.
6 An alternative definition of gender-specific aid could be based on the Gender Equality Policy (GEP) marker developed by the OECD-DAC, that distinguishes between projects with gender equality as: (i) the primary objective, (ii) a significant objective, (iii) no stated objective. This indicator has some limitations that makes it less useful for our purpose, though. In particular, the use of this marker is voluntary for the donors, and as a consequence marked projects are relatively few. Out of our 906 projects, only 363 are marked, and out of these only 61 are marked into category (i) or (ii). This raises concerns of selection bias, as donors that make the effort to mark their projects may be particularly concerned about gender equality and may be more than average diligent in making sure gender-targeted aid delivers results. It is also possible that donors choose to mark only the projects they most strongly believe will indeed generate positive impacts on gender equality.
7 Figure 2 in the Appendix and Figure 4 in the Supplementary materials show the grid visually.
8 An alternative approach used in the literature (e.g. Isaksson & Kotsadam, Citation2018; Knutsen & Kotsadam, Citation2020) is to define respondents in areas where projects are not yet implemented but where they will be implemented in the future as controls and respondents in areas with ongoing projects as treated. This is helpful if areas that are never close to aid projects are substantially different from those in project vicinity, but it might lead to a sample where a substantial majority of units classified as treated are surveyed late while the opposite is true for the group of controls. This raises the question of bias from overall changes in outcomes over time, that may be hard to control for. Our approach avoids the latter concern, but relies on comparability of treatment and control groups and parallel trends prior to the implementation of the projects, discussed further below.
9 Our control variables are generally exogenous or pre-determined, with the possible exception of household size, literacy, and years of education, which might be directly targeted and affected by aid interventions. Results are however minimally affected by excluding these variables as compared to specifications including the full list of controls, which are reported in tables throughout the paper.
10 Results are slightly stronger, as expected, but all in all do not change much using the full sample.
11 With the exception of the Lomwe group, this classification is the same as in the Ethnographic Atlas (Murdock et al., Citation1999).
12 In the Supplemental Material we show tables using the median rather than the mean to differentiate matrilineal from patrilineal communities. This increases the number of communities defined as patrilineal quite substantially, adding more evenly mixed communities. As expected, this leads to a moderation of the difference between the two communities, though the pattern is largely the same. In particular, the impact on men’s attitudes is still negative in patrilinear societies but smaller. We also show a table testing for the difference in pre-trends between matrilineal and patrilineal communities. For the HS index results suggest that there is a pre-trend towards more favourable outcomes in matrilineal communities, which suggests that results for this index should be interpreted with care. For the other indices, coefficients are all negative suggesting that the pre-trend goes in the opposite direction if anything.
13 The impact of foreign aid in general on female empowerment is a question that has received surprisingly little attention in the quantitative academic literature. In a special issue, the Journal of International Development (Volume 28, 2016) published several papers on the topic, some with a quantitative component. Most closely related to this paper, Pickbourn and Ndikumana (Citation2016) use cross-country data to estimate the correlations between foreign aid inflows and the United Nations Development Program’s Gender Inequality Index (GII), finding no significant correlation. The authors do, however, find positive correlations between maternal mortality rates and youth gender literacy gaps and aid targeted towards the health and education sector respectively.
14 While t-statistics test the null hypothesis of no difference in means between treated and control units, the normalized differences ``provide a scale- and sample size-free way of assessing overlap’' (Imbens, Citation2015).
References
- Agarwal, B. (1994). Gender and command over property: A critical gap in economic analysis and policy in south asia. World Development, 22(10), 1455–1478. doi:10.1016/0305-750X(94)90031-0
- Allcott, H. (2015). Site selection bias in program evaluation. The Quarterly Journal of Economics, 130(3), 1117–1165. doi:10.1093/qje/qjv015
- Allendorf, K. (2007). Do women’s land rights promote empowerment and child health in nepal? World Development, 35(11), 1975–1988. doi:10.1016/j.worlddev.2006.12.005
- Anderson, M. L. (2008). Multiple inference and gender differences in the effects of early intervention: A reevaluation of the abecedarian, perry preschool, and early training projects. Journal of the American Statistical Association, 103(484), 1481–1495. doi:10.1198/016214508000000841
- Angelucci, M. (2008). Love on the rocks: Domestic violence and alcohol abuse in rural Mexico. The B.E. Journal of Economic Analysis & Policy, 8(1), 43. doi:10.2202/1935-1682.1766
- Ashraf, N., Bau, N., Nunn, N., & Voena, A. (2020). Bride price and female education. Journal of Political Economy, 128(2), 591–641. doi:10.1086/704572
- Baliamoune-Lutz, M. (2016). The effectiveness of foreign aid to women’s equality organisations in the mena. Journal of International Development, 28(3), 320–341. doi:10.1002/jid.3214
- Banerjee, A., Duflo, E., Glennerster, R., & Kinnan, C. (2015). The miracle of microfinance? evidence from a randomized evaluation. American Economic Journal: Applied Economics, 7(1), 22–53. doi:10.1257/app.20130533
- Bold, T., Kimenyi, M., Mwabu, G., Ng’ang’a, A., & Sandefur, J. (2018). Experimental evidence on scaling up education reforms in Kenya. Journal of Public Economics, 168, 1–20. doi:10.1016/j.jpubeco.2018.08.007
- Chattopadhyay, R., & Duflo, E. (2004). Women as policy makers: Evidence from a randomized policy experiment in india. Econometrica, 72(5), 1409–1443. doi:10.1111/j.1468-0262.2004.00539.x
- Chin, Y.-M. (2012). Male backlash, bargaining, or exposure reduction?: women’s working status and physical spousal violence in india. Journal of Population Economics, 25(1), 175–200. doi:10.1007/s00148-011-0382-8
- Cools, S., & Kotsadam, A. (2017). Resources and intimate partner violence in sub-saharan africa. World Development, 95, 211–230. doi:10.1016/j.worlddev.2017.02.027
- De, R., & Becker, C. (2015). The foreign aid effectiveness debate: Evidence from Malawi. AidData Working Paper 6. Williamsburg, VA: College of William and Mary.
- De Brauw, A., Gilligan, D. O., Hoddinott, J., & Roy, S. (2014). The impact of bolsa família on women’s decision-making power. World Development, 59, 487–504. doi:10.1016/j.worlddev.2013.02.003
- Deaton, A., & Cartwright, N. (2018). Understanding and misunderstanding randomized controlled trials. Social Science & Medicine (1982), 210, 2–21. doi:10.1016/j.socscimed.2017.12.005
- Deininger, K., Jin, S., Nagarajan, H. K., & Xia, F. (2019). Inheritance law reform, empowerment, and human capital accumulation: Second-generation effects from India. The Journal of Development Studies, 55(12), 2549–2571.
- Desai, R. M., & Olofsgård, A. (2019). Can the poor organize? public goods and self-help groups in rural india. World Development, 121, 33–52. doi:10.1016/j.worlddev.2019.04.009
- Dhar, D., Jain, T., & Jayachandran, S. (2022). Reshaping adolescents’ gender attitudes: Evidence from a school-based experiment in india. American Economic Review, 112(3), 899–927. doi:10.1257/aer.20201112
- Djurfeldt, A. A., Hillbom, E., Mulwafu, W. O., Mvula, P., & Djurfeldt, G. (2018). The family farms together, the decisions, however are made by the man”—matrilineal land tenure systems, welfare and decision making in rural malawi. Land Use Policy, 70, 601–610. doi:10.1016/j.landusepol.2017.10.048
- Dreher, A., & Lohmann, S. (2015). Aid and growth at the regional level. Oxford Review of Economic Policy, 31(3-4), 420–446. doi:10.1093/oxrep/grv026
- Duflo, E. (2012). Women empowerment and economic development. Journal of Economic Literature, 50(4), 1051–1079. doi:10.1257/jel.50.4.1051
- Field, E. (2007). Entitled to work: Urban property rights and labor supply in peru. The Quarterly Journal of Economics, 122(4), 1561–1602. doi:10.1162/qjec.2007.122.4.1561
- Findley, M. G., Powell, J., Strandow, D., & Tanner, J. (2011). The localized geography of foreign aid: A new dataset and application to violent armed conflict. World Development, 39(11), 1995–2009. doi:10.1016/j.worlddev.2011.07.022
- Gakidou, E., Cowling, K., Lozano, R., & Murray, C. J. (2010). Increased educational attainment and its effect on child mortality in 175 countries between 1970 and 2009: A systematic analysis. The Lancet, 376(9745), 959–974. doi:10.1016/S0140-6736(10)61257-3
- Grown, C., Addison, T., & Tarp, F. (2016). Aid for gender equality and development: Lessons and challenges. Journal of International Development, 28(3), 311–319. doi:10.1002/jid.3211
- Haushofer, J., & Shapiro, J. (2016). The short-term impact of unconditional cash transfers to the poor: experimental evidence from kenya. The Quarterly Journal of Economics, 131(4), 1973–2042. doi:10.1093/qje/qjw025
- Heise, L. L., & Kotsadam, A. (2015). Cross-national and multilevel correlates of partner violence: an analysis of data from population-based surveys. The Lancet Global Health, 3(6), e332–e340. doi:10.1016/S2214-109X(15)00013-3
- Ibik, J. O. (1970). Restatement of African Law: Malawi. I. The law of marriage and divorce. London: Sweet and Maxwell.
- Imbens, G. W. (2015). Matching methods in practice: Three examples. Journal of Human Resources, 50(2), 373–419. doi:10.3368/jhr.50.2.373
- Imbens, G. W., & Rubin, D. B. (2015). Causal Inference for Statistics, Social, and Biomedical Sciences: An Introduction (1st ed.). New York: Cambridge University Press.
- Isaksson, A.-S., & Kotsadam, A. (2018). Chinese aid and local corruption. Journal of Public Economics, 159, 146–159. doi:10.1016/j.jpubeco.2018.01.002
- Jayachandran, S., Biradavolu, M., & Cooper, J. (2023). Using machine learning and qualitative interviews to design a five-question survey module for women’s agency. World Development, 161, 106076. doi:10.1016/j.worlddev.2022.106076
- Jayachandran, S., & Pande, R. (2017). Why are indian children so short? the role of birth order and son preference. American Economic Review, 107(9), 2600–2629. doi:10.1257/aer.20151282
- Keats, A. (2018). Women’s schooling, fertility, and child health outcomes: Evidence from uganda’s free primary education program. Journal of Development Economics, 135, 142–159. doi:10.1016/j.jdeveco.2018.07.002
- Kim, J. C., Watts, C. H., Hargreaves, J. R., Ndhlovu, L. X., Phetla, G., Morison, L. A., Busza, J., Porter, J. D., & Pronyk, P. (2007). Understanding the impact of a microfinance-based intervention on women’s empowerment and the reduction of intimate partner violence in South Africa. American Journal of Public Health, 97(10), 1794–1802. doi:10.2105/AJPH.2006.095521
- Kiplesund, S., & Morton, M. (2014). Gender-based violence prevention: lessons from world bank impact evaluations. In enGender Impact: The World Bank’s Gender Impact Evaluation Database. Washington, DC: World Bank.
- Knutsen, T., & Kotsadam, A. (2020). The political economy of aid allocation: Aid and incumbency at the local level in sub saharan africa. World Development, 127, 104729. doi:10.1016/j.worlddev.2019.104729
- Kotsadam, A., Østby, G., & Rustad, S. A. (2017). Structural change and wife abuse: A disaggregated study of mineral mining and domestic violence in sub-saharan africa, 1999–2013. Political Geography, 56, 53–65. doi:10.1016/j.polgeo.2016.11.004
- Lowes, S. (2021). Kinship structure, stress, and the gender gap in competition. Journal of Economic Behavior & Organization, 192, 36–57. doi:10.1016/j.jebo.2021.09.029
- McCrary, J., & Royer, H. (2011). The effect of female education on fertility and infant health: Evidence from school entry policies using exact date of birth. American Economic Review, 101(1), 158–195. doi:10.1257/aer.101.1.158
- Mellish, M., Settergren, S., & Sapuwa, H. (2015). Gender-based violence in Malawi: A literature review to inform the national response. Washington, DC: Futures Group, Health Policy Project.
- Munshi, K., & Myaux, J. (2006). Social norms and the fertility transition. Journal of Development Economics, 80(1), 1–38. doi:10.1016/j.jdeveco.2005.01.002
- Murdock, G. P., Textor, R., Barry, I. H., White, D. R., Gray, J. P., & Divale, W. T. (1999). Ethnographic Atlas. World Cultures, 10, 24–136.
- Odokonyero, T., Marty, R., Muhumuza, T., Ijjo, A. T., & Owot Moses, G. (2018). The impact of aid on health outcomes in Uganda. Health Economics, 27(4), 733–745. doi:10.1002/hec.3632
- Peratsakis, C., Powell, J., Findley, M., Baker, J., & Weaver, C. (2012). Geocoded activity-level data from the government of Malawi’s aid management platform. Washington, DC: AidData and the Robert S. Strauss Center for International Security and Law.
- Pickbourn, L., & Ndikumana, L. (2016). The impact of the sectoral allocation of foreign aid on gender inequality. Journal of International Development, 28(3), 396–411. doi:10.1002/jid.3213
- Pulerwitz, J., Hughes, L., Mehta, M., Kidanu, A., Verani, F., & Tewolde, S. (2015). Changing gender norms and reducing intimate partner violence: Results from a quasi-experimental intervention study with young men in Ethiopia. American Journal of Public Health, 105(1), 132–137. doi:10.2105/AJPH.2014.302214
- Ravishankar, V., El-Kogali, S. E.-T., Sankar, D., Tanaka, N., & Rakoto-Tiana, N. (2016). Primary Education in Malawi: Expenditures, service delivery, and outcomes. Washington, DC: World Bank Publications.
- Roberts, T., & Dionne, K. Y. (2013). Aid effectiveness and allocation: Evidence from malawi. In ASA 2013 Annual Meeting Paper.
- Schwab, K., Samans, R., Zahidi, S., Leopold, T. A., Ratcheva, V., Hausmann, R., & Tyson, L. D. (2017, November). The global gender gap report 2017. World Economic Forum.
- Sen, A. (1990). Gender and cooperative conflicts. In I. Tinker (Ed.), Persistent Inequalities: Women and World Development. Oxford: Oxford University Press.
- Sharma, R. R., Chawla, S., & Karam, C. M. (2021). 10. Global Gender Gap Index: World Economic Forum perspective. Handbook on Diversity and Inclusion Indices: A Research Compendium, 150.
- Thomas, D. (1990). Intra-household resource allocation an inferential approach. The Journal of Human Resources, 25(4), 635–664. doi:10.2307/145670
- Udry, C. (1996). Gender, agricultural production, and the theory of the household. Journal of Political Economy, 104(5), 1010–1046. doi:10.1086/262050
Appendix A.
DHS variable selection into indices
The HS index, built following Haushofer and Shapiro (Citation2016) as close as possible, includes a mix of survey answers on acceptability and frequency of experienced violence, and decision-making within the household. More in details: the number of reasons the respondent finds justifiable for beating one’s wife (out of 5 possible: wife burns the food; wife neglects the children; wife goes out without telling the husband; wife argues with the husband; and wife refuses to have sex with the husband); the share of respondents who agree with at least one of these reasons; the share of women who have experienced domestic violence in the past 12 months, separating between emotional, physical, and sexual violence; the share of women who report suffering injuries as a result of husband’s violence; the share of women experiencing controlling behavior by their husband (insisting on knowing where they are at all times, being jealous or angry if they talk to other men, accusing them of being unfaithful, not trusting them with any money, limiting contact with their family and not permitting them to meet their female friends); the share reporting the number of decisions the woman participates in being 0 (out of 5 possible: how to spend her earnings, how to spend her husband’s/partner’s earnings, large household purchases, her own health care, visits to her family and relatives); the number of decisions on which the man has final say on (out of 7: how to spend own earnings, how to spend partner’s earnings, respondent’s health care, large household purchases, food to be cooked each day, how many children to have); the share agreeing that the man can refuse financial support to his wife (proxy for financial control). Following the original paper, we compute a weighted standardized average of these measures, using as weights the corresponding entries in the inverse of the covariance matrix of the re-scaled measures.
The JBC index, modelled on Jayachandran et al. (Citation2023), includes indicators for: whether women participate in decisions on large household purchases; whether women participate in decisions on daily purchases; whether women participate in decisions on family visits; whether women participate in decisions on their own health care. Following the authors, we use the average of the standardized variables.
The index of women’s attitudes WA includes answers to the questions whether the respondent feels that she can refuse sexual intercourse with her husband and ask her husband to use a condom, the answer to the question about how old they would like their youngest child to be when the next child is born, as well as the respondent’s age at first marriage and at first birth.
Finally, the index of men’s attitudes MA includes the share of male respondents rejecting the view that is justified to refuse financial support to his wives; to have sex with other partners than his wives; to use violence to force sexual intercourse; that a woman is justified to refuse sex when she knows her husband has sex with women other than his wives; that a woman is justified to ask her husband to use a condom if she knows her husband has a sexually transmitted infection; and finally the answer to the question about how old they would like their youngest child to be when the next child is born.
For both the WA and MA, and similarly to the HS index, we follow recommendations in Anderson (Citation2008) to compute a weighted average of the standardized underlying outcomes, using as weights the corresponding entries in the inverse of the covariance matrix of the re-scaled outcomes.
The overall index is the weighted average of the other indices, with weights inversely proportional to their variance, defined only for observations for which all indices exist – or more in detail, the empowerment index, the agency index, and one of the attitude indices, WA for female respondents and MA for male respondents.
Appendix B.
Maps
Figure 1. Intensity of matrilineal tenure.
Notes: The figure plots the geographic distribution of our matrilineal indicator. We base our definition of matrilineal societies on the ethnic identification of individual respondents. Therefore the intensity at the cluster level varies between 0 and 1 representing the share of respondents that identify themselves as belonging to one of the ethnic groups classified as matrilineal.
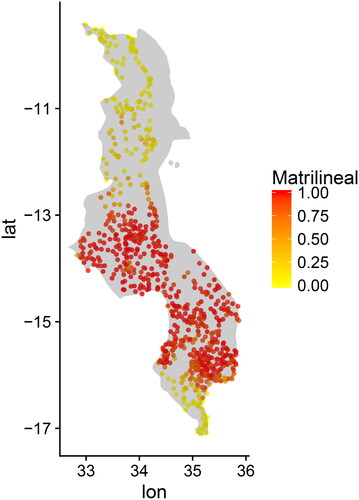
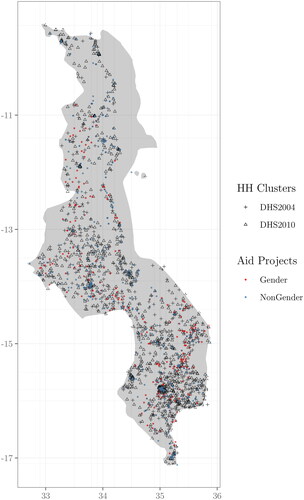
Figure 2. Map of aid projects and survey waves.
Notes: The figure plots the geographic distribution of aid projects and of household clusters in the two DHS waves. The color of the project dot reflects whether the project has or not a specific gender-targeting, while the shape of the household dot reflects the survey wave.
Appendix C.
Pre-treatment balance and parallel trends
Following Imbens and Rubin (Citation2015) and Imbens (Citation2015), the extent of overlap is assessed using normalized differences, defined as follows:
(3)
(3)
where X is an element of the covariates vector and
and
are the mean and variance of X in the treatment and control groups, for
respectively. shows that, with one exception, the normalized differences between covariates are below 30% (Imben’s rule of thumb).14
As detailed in Section 4, we have access to repeated cross-sections rather than a proper panel. This implies that we do not observe the same individuals, or even the same villages, over time, before and after treatment. Therefore, checking that treated and control units are similar in the pre-treatment survey wave, which usually is done in a pre-treatment balance of covariates analysis, only gives very limited insight on the question of whether other group characteristics interfere and confound the effect of treatment. In we mean to show whether the two treatment groups (from the 2004 survey wave and from the 2010 survey wave) are similar to each other, and so are the two corresponding control groups. EquationEquation 3(3)
(3) may be rewritten as:
(4)
(4)
Once again, with few exceptions, the normalized differences between covariates are below 30%. In particular, we can exclude compositional differences in the two samples (in terms of age, ethnicity, religion, for example) and strong trends in factors that might be affected by aid presence (household size, years of education, attitudes towards wife beating). As discussed in Section 5, our results are not sensitive to the inclusion or exclusion of these covariates.
In order to test for parallel trends, reproduces using survey waves 2000 and 2004, before any of the aid projects in our data was implemented. Household clusters are categorized into treatment and control group based on geographic vicinity to projects that would be implemented after 2004. Therefore, none of the clusters is exposed to any actual project, among those we consider, at the time of the interview and this can be considered as a placebo test. It shows that, prior to project implementation, trends in the outcome are parallel between the two groups of locations. Notice that not all variables used to build the indices are available in the 2000 wave of the DHS and as a consequence, while we make all efforts to reproduce them, the outcome variables in are not exactly identical to those used in the main analysis.
Table A1. Normalized differences, pre-treatment
Table A2. Normalized differences - treatment groups
Table A3. Normalized differences - control groups
Table A4. Pre-trends