
 ?Mathematical formulae have been encoded as MathML and are displayed in this HTML version using MathJax in order to improve their display. Uncheck the box to turn MathJax off. This feature requires Javascript. Click on a formula to zoom.
Abstract
Large, unexpected shocks are becoming more frequent, making the design of robust social transfer programs more vital than ever. We evaluate the performance of the Food Friendly Program (FFP), the largest in-kind social transfer program in Bangladesh, before and during the nation-wide COVID-19 lockdown. Using two-rounds of nationally representative household surveys combined with administrative data, we document that high leakages and large welfare losses are related to corruption. This contrasts with the performance of the pre-lockdown FFP, when leakage was low and coverage high. We then compare the performance of the FFP with two initiatives launched following the pandemic: an in-kind and cash transfer program, respectively. These programs have markedly higher levels of leakage than the FFP. Our findings are relevant to other large shocks, such as those caused by climate change, and have important policy implications for the design and delivery of transfer programs in developing countries characterized by institutional weaknesses.
1. Introduction
Large, unexpected shocks have become more frequent than ever before (Fischer, Citation2020), with the COVID-19 pandemic being the fifth such event in the last 20 years (World Economic Forum, Citation2020). In terms of both health and economic impacts, the current pandemic has had far more devastating and longer-lasting impacts than other shocks in recent history. By some accounts, the global economic downturn induced by the COVID-19 recession is the largest since World War II (Egger et al., Citation2021; Miguel & Mobarak, Citation2022). In addition, although no one was insulated from the impact of the pandemic, the poor have been the most vulnerable to infection, loss of income, and increased hunger.Footnote1 To achieve the twin objectives of saving lives and livelihoods at risk due to the pandemic, most governments imposed some form of restrictions on mobility, which curtailed economic activities (Acemoglu, Chernozhukov, Werning, & Whinston, Citation2021), while simultaneously introducing economic stimulus measures including transfer programs targeting the poor (Loayza & Pennings, Citation2020).
In this paper, we examine the performance of a pre-existing transfer program targeted to the poor in Bangladesh—the Food Friendly Program (FFP)—during the nation-wide COVID-19 lockdown, comparing it to its pre-pandemic performance. The FFP, also known as the Khaddo-Bandhob Karmasuchi in Bengali, is a social safety net program in Bangladesh that was introduced in 2016. It aims to reduce chronic poverty and hunger and simultaneously achieve redistributive objectives. Under the FFP, eligible poor households receive 30 kilograms (kg) of subsidised rice per month through government appointed local food dealers for five months a year during two lean seasons: one from March to April and the other from September to November. The FFP, designed to build the resilience of poor and vulnerable households during normal times, can also respond to covariate shocks, such as those observed during the COVID pandemic.Footnote2
Like other governments around the world, the Government of Bangladesh (GoB) instituted a nation-wide lockdown from 26 March 2020, to limit the spread of COVID-19. The accompanying restrictions on mobility hit the poor the hardest (Hamadani et al., Citation2020). As the poor are disproportionately reliant on wages or are self-employed in the informal sector,Footnote3 both their employment opportunities and the demand for goods and services they produce declined sharply.Footnote4 In response to the increased economic hardship caused by the pandemic and the consequent lockdown, the government extended the FFP in May 2020 to provide additional transfers to rural poor households, although the pool of eligible households was not expanded. This approach, known as the vertical expansion of an existing social protection program during a crisis, can help households cope with an immediate shock. Since there is a lack of a real-time database on citizens’ incomes, especially in low-income countries, leveraging an existing social protection program as a platform for channelling emergency support can be quicker, more effective, and more inclusive than setting up a new parallel program during a crisis. Hirvonen (Citation2023) provides several anecdotal evidence of such programs in developing countries. However, the operational inefficiency of such a program during the COVID-19 pandemic has not been studied.
In this paper, we use a two-wave balanced panel of 2,602 beneficiary households randomly selected from all over Bangladesh to investigate the pre- and post-COVID performance of the FFP in terms of the percentage of beneficiaries receiving the subsidised rice transfers and the quantity of rice received. We then investigate the role of corruption in influencing FFP performance by combining our primary survey data with administrative information to estimate the extent of leakage and welfare loss due to corruption. We further supplement our analysis by comparing the performance of the FFP with two other new transfer programs, a Relief Packet comprising 10 kg of rice, five kg of potato, one kg of lentil, one kg of salt, one litre of soybean oil and one bar of soap, and a one-time direct Cash transfer of BDT 2,500 (≈ USD 30), introduced in response to the pandemic.
Our results show that the FFP was performing very satisfactorily before the pandemic, with about 95 percent of beneficiaries receiving rice during March–April 2018. The corresponding leakage rates (the share of rice diverted from the intended beneficiaries) were very low in comparison to similar programs in the region; for example, as of 2011–12, approximately 42 percent of food grain was diverted in the Public Distribution System (PDS) in India, where the government distributes commodities including rice to the poor at a highly subsidised rate (Drèze & Khera, Citation2015).Footnote5 However, immediately after the lockdown, FFP performance suffered; only 67 percent of FFP beneficiaries received rice in April 2020, and this proportion dropped further to just 42 percent in May 2020 (the extra month of supply that GoB hurriedly added). Dealers did not return undelivered rice, a clear indication of corruption.
We then explore plausible reasons behind the leakage and find that there was a marked increase in the incidence of dealers demanding bribes from beneficiaries. We estimate that, on average, the likelihood of a beneficiary receiving rice decreases by 52 percent if she is asked to pay a bribe by the dealer, and this effect is more pronounced in areas with a higher incidence of poverty. The total welfare loss due to corruption in three months (March-May) in 2020 was approximately BDT 4.6 billion (≈54 million USD), 14.82 percent of which was due to dealers demanding bribes from beneficiaries.
There is a wealth of research examining the impact of the COVID-19 pandemic on diverse facets of human life, much of which is beyond the scope of the current paper. A recent summary of rapidly expanding body of literature on the COVID-19 that focuses on the consequences of and government responses to the pandemic can be found in Brodeur, Gray, Islam, & Bhuiyan (Citation2021), and Miguel and Mobarak (Citation2022).Footnote6 Our paper contributes to the study of government responses in the form of social benefit transfers, but our analyses extend to the efficacy of the governmental implementation of such transfers. While the impact of public distribution programs in developing countries (Cañedo, Fabregas, & Gupta, Citation2023, for Mexico and Bolivia; Chakrabarti, Kishore, & Roy, Citation2018, for India), and corruption in public distribution have been studied previously (Olken, Citation2006, for Indonesia; and Drèze & Khera, Citation2015, for India), to the best of our knowledge, we are the first to analyse how an aggregate shock affects corruption and consequently, the performance of existing as well as newly introduced transfer programs. Our paper is also related to the burgeoning literature that compares the relative performance of an existing social safety net program and newly designed humanitarian assistance program following a crisis (Hirvonen, Citation2023; Sabates-Wheeler, Hirvonen, Lind, & Hoddinott, Citation2022). Finally, our paper carries important policy implications regarding the role of shock responsiveness and institutional development.
2. The FFP and the study design
2.1. A brief overview of the FFP
In Bangladesh, due to the high incidence of food poverty, particularly among the extreme poor, ensuring food security is a key priority of the country’s overall social safety net program portfolio. Launched in 2016, the FFP is one of the main initiatives through which the GoB provides food security to the rural populace living below the extreme poverty line. This program is a large and important component of the government’s broader portfolio, comprising 27.46 percent of total public food expenditure in the 2019–20 fiscal year (Government of Bangladesh, Citation2020) and 13.91 percent of the total expenditure on social safety net programs allocated to food security (Finance Division, Citation2020). The FFP enables more than five million poor rural households to purchase rice (the main staple food in Bangladesh) at a highly subsidised rate of 20-30 percent of the prevailing market price.
Under the FFP, an eligible household receives 30 kg of subsidised rice per month for five months a year during the two pre-harvest lean seasons—in March and April before the Boro rice harvest and in September, October and November before the Aman rice harvest.Footnote7 Given that the FFP is an in-kind transfer program, the subsidised rice passes through several administrative layers before reaching the dealers in a union,Footnote8 who then deliver the rice to the beneficiaries. Rice is sold to the beneficiaries at BDT 10 per kg, which has remained unchanged since the introduction of the FFP. In comparison, the retail market price of coarse rice in 2020 was over BDT 45 (≈ 0.55USD).
To be considered as a beneficiary, the household head must be a permanent resident in the union and possess a national ID card. In addition, the household must be poor and functionally landless, and the household head must be working as a day labourer. Members of households headed by widowed/separated/divorced/deserted/elderly/disabled females and/or those including children and/or disabled individuals get priority. Lastly, no more than one member from the same household can be included in the FFP, and current beneficiaries of other similar programs.
In each union, one dealer is appointed by an upazila (UPZ) committee which consists of the Member of Parliament of the respective constituency, the elected UPZ Chairman, the Upazila Nirbahi Officer (the highest administrative officer (civil servant) in an UPZ), six other civil servants, and one citizen journalist. Eligible households in a union are selected by a Union Parishad (UP) committee that consists of the elected-UP Chairman and members, a secretary, and two civil society representatives nominated by the Chairman. Each beneficiary receives a beneficiary card. A beneficiary list is displayed in the respective UP digital centre, and a complete nationwide list is made available on the central website of the Directorate General of Food (http://www.dgfood.gov.bd), the government department responsible for food management and policy in Bangladesh. The dealers collect rice from the government-owned warehouses, which are often located at or near the UPZ headquarters and administered by the Upazila Controller of Food (henceforth, UCF).
The dealers are instructed to store rice in a ‘prominent location,’ such as near a marketplace within the union, and distribute it from there. Beneficiaries, upon presenting their beneficiary cards and paying the price, receive a bag of rice. Both the dealer and the beneficiary must sign or fingerprint the card during each transaction. UCF officials are instructed to visit the distribution locations regularly, but such monitoring does not always occur, especially in remote areas, due to reasons including budgetary constraints.
2.2. Study design and sample selection
The study design, sample selection and data collection are described in the Appendix. Briefly, the first round of surveys was conducted by the International Food Policy Research Institute (IFPRI) in October-December 2018, where the main purpose of this survey was to collect information on transfers made in March-April 2018. Since transfers are made at the union level by dealers, the primary survey unit was the union. A total of 4,526 beneficiaries in 226 unions were interviewed ().
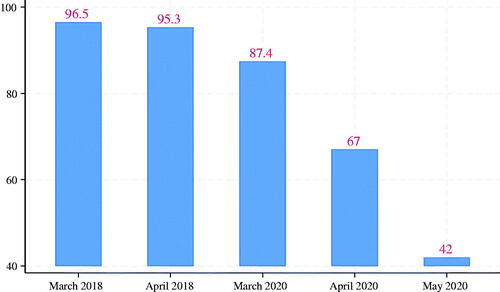
Figure 1. Percentage of beneficiaries receiving food from the FFP.
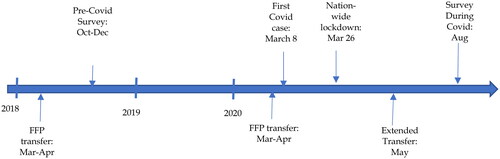
The first COVID-19 case was identified in Bangladesh on 8 March 2020. As infection rates continued to increase, the government announced a 67-day nationwide lockdown on March 26. The lockdown overlapped partially with the FFP cycle in March and fully in April and May. To investigate the effect of the COVID pandemic on the performance of the FFP, a second survey round was conducted at the beneficiary level in August 2020 (see for the timeline). This round covered the same sample and collected information similar to the 2018 survey, including receipt of FFP transfers in March, April and May 2020. Information was also collected on beneficiaries’ experiences with two new transfer schemes: the Relief Packet and the Cash transfer.Footnote9
Figure 2. Study timeline.
For our analyses, we retain only those observations with no missing values for household demographic information, dealer characteristics or other crucial baseline information such as poverty incidence at the union level and distance of the UCF from the district headquarters. This reduces the sample size to 2,602 beneficiaries in 59 districts. Therefore, we have a balanced panel of 13,010 observations for five periods: March and April in 2018, and March, April and May in 2020.Footnote10 in Appendix reports the differences in baseline characteristics between the 2,602 sample households reinterviewed in 2020Footnote11 to the 1903 households not reinterviewed in 2020. Although there are several characteristics that statistically differ between the two samples, the differences are not large in terms of magnitudes, and we control for these characteristics in our regressions. One concern might be that attrition may not be random. To address this, we estimated weighted regressions using inverse probability weights. The results reported in the Supplementary Materials strongly support those reported in the paper, both in terms of magnitudes and statistical significance. Details of the weight calculation, including the attrition analysis, are discussed in the Supplementary Materials.
Table 1. Descriptive statistics: Percentage of respondents asked to pay bribe
3. The COVID-19 pandemic and the FFP
3.1. Performance of the FFP before and during the pandemic
Our analyses of changes in FFP performance due to COVID-19 is based on a pre-post comparison of the FFP transfers of subsidised rice. Our identification assumption is that only (or to the most extent) the COVID-19 induced lockdown and associated changes have caused the change in FFP performance. It can be argued that other shocks and macroeconomic factors might have played a role in the changing performance of the FFP. If so, the cumulative effects over the two pre-pandemic years would be (much) larger than immediate effect in the post-pandemic period. The information in about the percentage of beneficiaries receiving rice two years before the lockdown in 2018 and during the lockdown in 2020 supports our assumption.Footnote12
The benchmark period for comparison is the first period of observation in March 2018. In the pre-COVID periods of March and April 2018, the FFP program was functioning well, with as many as 96.5 percent and 95.3 percent of the beneficiaries, respectively, reported receiving rice (column 1). In the first post-COVID period in March 2020, 87.4 percent of the beneficiaries reported receiving rice, a decrease of 9.1 percentage points (pp) from the benchmark period of March 2018 and 7.9 pp from April 2018. This minor reduction is due to the fact that the lockdown was imposed in the last week of March 2020, so that only the beneficiaries who collect rice at the end of the month were adversely affected. The extent of the effect of the lockdown was manifested from April onwards. In April 2020, only 67 percent of the beneficiaries reported receiving rice, a decrease of 20.4 pp from the previous month, and a startling 28.3 pp from April 2018. This large decrease in just one month after the lockdown compared to the minor 7.9 pp decrease over two preceding years (from April 2018 to March 2020) can only be attributed to the changing environment due to the pandemic. This was followed by a further 25 pp fall in May, when only 42 percent of the beneficiaries reported receiving rice.
3.2. Plausible factors influencing the performance of the FFP during the pandemic
There are several plausible explanations for the large decline in the number of beneficiaries receiving rice during the pandemic.
The first explanation is that the lockdown and mobility restrictions caused disruptions in the supply chain, resulting in limited availability of rice to dealers. However, this is unlikely as rice is often stored in spatially distributed storage facilities across the country, and the lockdown did not affect the disbursement from the government warehouses to dealers. District-level administrative data collected from the DG Food on the aggregate disbursement of rice to the UCFs in 2020 also confirms there was no reduction in disbursement.
The second explanation is increased corruption during the lockdown, which might have discouraged or prevented beneficiaries from receiving rice. In both survey rounds, the respondents were asked whether the dealer demanded a bribe from them but were not asked if they actually paid the bribe. In 2018, only 3.8 percent of the respondents reported such demands from dealers. This increased almost five-fold in 2020, with 17.6 percent of the respondents reporting such incidences (). In addition to the increase in dealers demanding bribes, the most notable change in 2020 is the diffusion of bribe-taking behaviour across the country. In 2018, dealers were reported to have demanded bribes in about 27 percent of the UPZs. This increased to over 88 percent of the UPZs in 2020. When aggregated at the UPZ level, the average proportion of respondents per UPZ who reported being asked to pay a bribe increased from 4 percent in 2018 to over 18 percent in 2020.
The monetary benefit of siphoning off rice intended for the beneficiaries can be huge for the dealers. As mentioned earlier, though beneficiaries receive rice at a highly subsidised price of BDT 10 per kg, the retail market price of coarse rice per kg is far higher, being over BDT 45 in 2020. Therefore, by illegally diverting undelivered rice to sell in the black (open) market, a dealer can misappropriate approximately BDT 1,050 per beneficiary. Of course, dealers are not allowed to do so and according to official guidelines, must return any undelivered rice to the UCFs. However, the district-level administrative data does not indicate a return of undelivered rice. Assuming the administrative data is accurate, this is suggestive of corruption in the FFP, which is likely to be concentrated at the lowest layer of distribution, i.e. at the level of the dealers.Footnote13
The third possible explanation is a decrease in demand with fewer beneficiaries travelling to collect rice due to lockdown restrictions on movement or concerns for personal safety. Given the pandemic’s economic impact on the poor, this is unlikely, and that the pandemic would instead increase their demand for transfers in general and the FFP in particular. The earliest data on the rate of COVID-19 infection at the UPZ level is available for July 2020. Given that our post-COVID sample period ends in May, we cannot estimate the direct effect of the pandemic by exploiting the variations in COVID infection rates across different regions. However, we can explore some indirect effects using information about the remoteness of and the incidence of poverty in the regions the respondents were from. At the start of the pandemic, lockdowns were strictly implemented in urban and surrounding areas but only loosely in remote areas. The lockdown was harder to implement in poor regions as more people needed to go out to earn their livelihoods. These variations in the implementation of the lockdown based on distance from urban areas and incidence of poverty can thus be used to estimate any heterogeneous effects of the performance of the FFP. Note that though the FFP is only targeted to the rural poor, the 2018 baseline (and 2020 end line) data contains rich information enabling us to exploit geographic variation in the degree of poverty at the individual (or household) level.
4. Empirical estimation and results
4.1. Estimation specification
To examine the possible explanations for the reduction in FFP transfers, we estimate the following regression equation:
(1)
(1)
where yijt is a binary indicator (1 = if a beneficiary i in union j at time t received rice; 0 = otherwise). Bribe is a binary variable indicating whether the beneficiary was asked to pay a bribe by the dealer (1 = yes; 0 = otherwise), Dist is the distance of the UCF office from the district headquarters (in 10 km), and Pov is the poverty incidence (head count ratio i.e. fraction of the population living below the poverty line) at the union level in 2016.
X is a vector of demographic and other characteristics of the beneficiaries that includes age; gender; years of schooling and occupation of the household head; whether the beneficiary is a permanent resident in the village; whether the household is also a beneficiary of the VGD program; and distance of the household from the UPZ headquarters.
D is a vector of dealer characteristics that includes gender and years of schooling of the dealer; whether the dealer is a member of the Awami League (the ruling political party in Bangladesh since 2008); whether the dealer was selected through political connections, whether the dealer’s primary occupation is business; whether the dealer’s secondary occupation is business; distance of the dealer’s shop from where a dealer collects rice; distance of the dealer’s shop from the UCF office; and the value of the bribes paid in order to be enlisted as a dealer.
The −1δ’s are four dummies for five time periods (March and April 2018, and March, April and May 2020) intended to capture the differences in the percentage of beneficiaries receiving rice relative to the baseline period in March 2018, and the η’s are UPZ fixed effects. EquationEquation (1)(1)
(1) is estimated by OLS. Standard errors are clustered at the UPZ level.Footnote14
4.2. Main results
The results estimated by Equationequation (1)(1)
(1) are presented in . In column 1, only the household characteristics (X) are controlled for. In column 2, the UPZ fixed effects (ηk) are added. Our preferred specification is column 3, which includes all control variables including dealer characteristics.
Table 2. Percentage of households receiving food and its determinants (Estimation of equation 1)
The −1δ coefficients are strongly robust across all specifications but slightly different from those in , which were estimated without accounting for any control variables. Compared to the baseline period in March 2018, the proportion of respondents receiving rice in the first post-COVID period in March 2020 was two percentage points lower (compared to the 9.1 percentage point reduction reported in ). Importantly, only the last week of March 2020 overlapped with the lockdown. These results suggest that the FFP had been functioning satisfactorily before the pandemic. The differences increase to 22 and 47 percentage points in the lockdown months of April and May 2020, respectively. When we control for the individual (beneficiary) fixed effects in column 4, our results remain strongly robust. Given that Dist and Pov are time invariant, they are dropped in the fixed-effect regression. Therefore, we do not pursue this estimation any further.
The coefficient on Bribe is negative and significant at any conventional level. The likelihood of a beneficiary receiving rice is, on average, 52 percent lower if she is asked to pay a bribe by the dealer (column 3).Footnote15 The coefficient on Dist is –0.029 and significant at the 5 percent level, suggesting that for every 10-kilometer increase in the distance of the UCF from the district headquarters, the likelihood of receiving rice decreases on average by 2.9 percentage points. The coefficient on Pov is 1.45 and significant at any conventional level, suggesting that the likelihood of receiving rice increases on average by 0.145 (or 14.5 percentage points) when the union poverty head count ratio increases by 0.1.
To compare the impact of corruption, remoteness and poverty on food transfers during the pandemic versus the pre-pandemic period, we estimate models in which these variables are interacted with the time dummies. Further details, including equations, results and discussions, can be found in the Supplementary Materials. Here, we briefly discuss the main results.
Dealers demanding bribes decreased the likelihood of beneficiaries receiving rice more in early 2020 compared to the pre-pandemic period. The higher likelihood of receiving rice in areas closer to district headquarters in the pre-COVID period disappeared after the implementation of lockdown restrictions.
We also find that the effect of a dealer demanding a bribe on the beneficiary receiving rice is not conditional on the distance of the UCF from the district headquarters. This result corroborates that corruption was widespread across the country, as reported from almost all study areas in 2020. A smaller percentage of people living in poorer areas received rice as a result of the dealers demanding bribes, indicating that such demands had more detrimental effects on households in impoverished areas.
Our post-study discussions with policymakers and government bureaucrats highlighted the lack of monitoring in remote areas as a probable reason behind high leakage and corruption. During the pandemic, in-person monitoring activities declined even further due to the lockdown.
4.3. Robustness checks
The previous results are based on OLS estimation, which is the linear probability model (LPM) in the case of binary dependent variable. In the LPM, the estimated coefficient denotes the change in the predicted probability for a unit change in an explanatory variable. Although the LPM is simple to estimate and interpret, the estimated coefficient indicates that the change in the predicted probability is the same for all values of the explanatory variable. In our case, this implies that the change in the likelihood of receiving rice for a unit change in distance (or poverty head-count ratio) is the same no matter how far an UCF is from the district headquarters (or for any value of the poverty head-count ratio), which may not be true.
To address this potential problem, we now estimate the Probit model. We estimate our preferred specifications with all control variables in EquationEquation (1)(1)
(1) , which are comparable to column 3 in . We also estimate the specifications involving all interaction terms (results comparable to column 4 in Table O1 in the Supplementary Materials). Both results, presented in the Supplementary Materials Table O3, are strongly robust to the OLS coefficients both in terms of sign and statistical significance.
Table 3. Leakage in the FFP—percentage of rice allocated but NOT disbursed-Mean (Standard deviation) [median]
4.4. Leakage in the rice distribution and welfare loss
Let, the amount of rice each individual (i) is entitled to receive each month (t) be and the amount actually received be denoted by
*. If
*<
there is leakage.Footnote16 We assume that the undelivered rice goes to dealers since there is no mention of undelivered rice returning to government warehouses in the administrative data.
We also assume that the probability of over-reporting the number of beneficiaries or having ghost beneficiaries in the list is minimal based on our findings in the FFP survey in 2018, where we could find 97% of the listed beneficiaries. This happened because the list is verified with the government-introduced National ID card database, and reporting the death of a deceased person to the Union Parishad office has become crucial.
The leakage at the individual level (Lit) is defined as the fraction of rice a beneficiary is entitled to but did not receive.
(2)
(2)
This ranges between 0 (Rit* = Rit =30 kg; who received the full entitled amount) to 1 (Rit* = 0; who did not receive at all). To calculate the monetary loss from the leakage, we need information about the price subsidy (difference between the market and subsidised prices), and other costs (such as transportation) incurred by the beneficiaries to receive rice. Denote, the price subsidy by Ps (which is the same for all beneficiaries) and transportation costs incurred by a beneficiary by Ti. The loss at the individual beneficiary level is given by:
At the aggregate level, total monetary loss is the sum of the losses of all individuals, which is given by:
(3)
(3)
4.5. Welfare loss in FFP in monetary terms
The descriptive statistics of the district-level leakage are presented in (column 1). In March and April 2018, the average leakage was 3.6 percent and 4.8 percent, respectively. These increased to 12.8 percent in March 2020 (a 9.2 percentage points jump from March 2018) and then further increased to 31.9 percent in April 2020 and 56.3 percent in May 2020. The average leakage for the three months in 2020 was 33.67 percent. These figures are very similar if calculated using the district average of individual beneficiary-level leakages, (column 2).
We have district-level administrative data for the disbursement of rice to the UCFs in March, April and May 2020. For the 59 districts in our sample, the total amount of rice disbursed in each month was approximately 0.14 million metric ton (MT), for a total of 0.42 million MT over three months. The total amount of rice not received by the beneficiaries (disbursement multiplied by leakage at the district level and then summed over all districts) was 138,472.13 MT over the three months (). We also confirmed that the undisbursed amount was not carried forward for future transactions by deducting the balance from the dealers’ allotment.
Table 4. Leakage using administrative data on disbursement by district and survey data
As mentioned before, rice is sold to beneficiaries at a highly subsidised price of BDT 10 per kg, while the retail market price of coarse rice in 2020 was around BDT 45 per kg or even higher. The transportation costs beneficiaries must pay vary depending on their distance from dealers as well as local infrastructure. For a lower bound of the estimate of the welfare loss, we assume a large transportation cost of BDT 60 per beneficiary for each monthly trip.Footnote17 Given this, the monetary value of the welfare loss per MT of rice is BDT 33,000.Footnote18 The total welfare loss in monetary terms is approximately BDT 4.6 billion in three months, the largest of which occurred in May 2020 at approximately BDT 2.6 billion.
The reason for the welfare loss was that the dealers did not return the undelivered rice. This suggests corruption at the dealer level. We do not have the information needed to understand if any other layers of the administration and/or local government officials or politicians are involved. However, it suggests that there was no effective monitoring of the distribution of rice or the FFP program in general at the lowest level, at least during the COVID pandemic. The government officials responsible for monitoring the FFP program are stationed at the district headquarters. It is likely that they restricted their movements and did not perform their official responsibilities during the lockdown.
However, it is clear that a fraction of this welfare loss can be attributed to dealers demanding bribes from beneficiaries. To calculate this percentage, we conduct an ANOVA analysis to compute the fraction of variance in the leakage due to Bribe. Using the beneficiary-level data and including all control variables defined in Equationequation (1)(1)
(1) , the estimated fraction of total leakage due to dealers demanding bribes is 14.82 percent. This implies that about five percent (= 14.82*0.3367) of the allocated rice did not reach the beneficiaries because dealers demanded bribes. This leakage was 1.8 percent in March 2020 and increased to 4.6 and 8.4 percent in April and May, respectively. The total welfare cost attributable to dealers demanding bribes is estimated at approximately BDT 677 million (≈8.25 million USD) in three months.
5. Performance of the two newly introduced transfer programs
As mentioned in the introduction, the GoB also implemented two additional pandemic-specific transfer programs targeted to the poor. The first one was a transfer during April-June 2020 of a Relief Packet that contained 10 kg of rice, five kg of potato, one kg of lentils, one kg of salt, one litre of soybean oil and a bar of soap. The second transfer program consisted of a direct Cash transfer of BDT 2,500, and the implementation of its first stage was completed by mid-August 2020. The details of the eligibility and selection criteria for these two programs are discussed in the Supplementary Materials.
Of the 2,602 sample FFP beneficiary households in our sample, 1,449 and 1,900 households were eligible for the Relief Packet and Cash transfer, respectively. However, only 25.2 percent of these eligible households reported receiving the Relief Packet (23.1 percent in the total FFP sample). Moreover, only 5.2 percent of the eligible households (4.9 percent in the total FFP sample) received the Cash transfer.Footnote19 Thus, both of these newly introduced programs performed much worse than the pre-existing FFP. Notably, the FFP even outperformed both programs in May 2020, when the percentage of FFP beneficiaries who received rice was at its lowest. The outreach of the Cash transfer program was the worst among the three—about one-fifth that of the in-kind Relief Packet.Footnote20
However, our samples in these two programs are drawn from the FFP sample, which may not be entirely representative for the evaluation of these programs and therefore the results should be treated with caution. While we are not aware of any systematic study that has evaluated those two newly introduced programs, reports published in national and international media outlets largely corroborate our findings.Footnote21
6. Conclusions and policy implications
This paper investigates the performance of the FFP, a pre-existing in-kind transfer program targeted at the poor in Bangladesh, during the nation-wide COVID-19 lockdown. Under the FFP, beneficiaries receive 30 kg of subsidised rice at 20–30 percent of the market price.
In comparison to similar in-kind transfer programs, the FFP performed extremely well before the pandemic, but its performance deteriorated markedly when lockdown restrictions were implemented. During this period, there was a marked increase in the incidence of dealers demanding bribes from beneficiaries, which also became widespread all over the country. We estimate the total welfare loss due to corruption in three months (March–May) in 2020 at approximately BDT 4.6 billion, close to 15 percent of which was due to dealers demanding bribes.
We also investigate the performances of the two newly introduced transfer programs targeted at the poor in response to the pandemic, an in-kind Relief Package, and a one-time direct Cash transfer, both of which were hurriedly designed and implemented. Despite the caveats associated with the evaluation outlined in the previous section, these programs performed even worse than the pre-existing FFP.
These results have important policy implications for developing countries. Not only are several of these countries characterized by institutional weaknesses which might have worsened during the pandemic (Rose-Ackerman, Citation2021), they are also subject to increasingly frequent shocks, including natural disasters and conflict. Our work suggests that this could have far-reaching impacts on welfare through the deterioration of safety net programs targeting the poor and vulnerable during crises. In addition, the introduction and successful implementation of new transfer programs during this period might be beset by a greater degree of corruption.
Our findings, therefore, sound a cautionary note. As we look ahead to a world with ever-growing uncertainty and economic precarity, policymakers must ensure not only that existing social safety net programs function efficiently, but that plans are in place to implement disaster-oriented safety net measures, including nimble targeting that ensures those newly thrust into poverty do not fall through the cracks. Additionally, future research should ascertain whether the performance of existing social safety net programs, such as the FFP, improved in the post-COVID period.
Supplemental Material
Download PDF (1 MB)Acknowledgements
We acknowledge helpful comments by Mushfiq Mobarak, Aaron Nicholas, and Timothy Richards. We are thankful to the United States Agency for International Development (USAID) for supporting the phone survey; Pathways Consulting Services Limited (PCSL) for administering the survey in 2020; and officials at the Directorate General of Food (DG Food) Bangladesh for administrative information on the Food Friendly Program (FFP). The usual disclaimer applies. IRB approval (IFPRI-IRB) was granted under study number: 00007490. The authors have no competing interests to declare. Data for replication of these results are available upon request.
Disclosure statement
No potential conflict of interest was reported by the author(s).
Notes
1 Although poverty is more prevalent in rural areas and in the agricultural sector (Castañeda et al., Citation2018), self-employed women and workers in the non-agricultural sector experienced some of the largest drops in employment during the early months of the pandemic in 2020 (Bundervoet, Dávalos, & Garcia, Citation2022).
2 See Bowen et al. (Citation2020) for a lucid discussion on adaptive social response.
3 Alfaro, Becerra, and Eslava (Citation2020) also show that in economies with larger informal sectors, a greater share of the workforce faced unemployment risk during lockdowns.
4 In Bangladesh, the informal sector employs 85.1 percent of the labor force and the share of self-employment in total employment is 44.3 percent (Table S34 and Chart 6.6, respectively from Bangladesh Bureau of Statistics (BBS) (Citation2018).
5 In a qualitative study conducted by Dutta (Citation2020), the author documents instances of exclusion for qualified beneficiaries to the PDS, which is an important aspect not covered in our study.
6 At the risk of over-simplification, this literature can be broadly divided into the following categories: (i) the mortality rate of COVID-19 and how it can vary depending on age, income, and race in the case of rich countries; (ii) the effectiveness of public health measures, including restrictions such as social distancing measures, lockdowns, border restrictions and closures, masking and mass vaccination; (iii) the impacts on income and employment, including heterogeneous effects along the lines of gender, occupation, and socio-economic conditions; (iv) the effects on education and learning due to school closures, the mental health of children and adults, and the various ramifications on families including differential impacts on women and other disadvantaged groups; and (v) public policy responses that are not directly related to health behaviour and outcomes.
7 These are the two pre-harvest lean seasons in rural Bangladesh when the price of rice increases, and job opportunities and agricultural wages decrease. This leaves poor individuals, especially agricultural day laborers, vulnerable to seasonal hunger and occasional famine. See Bryan, Chowdhury, and Mobarak (Citation2014) for further details.
8 The Union Parishad is the lowest local government unit in Bangladesh. Multiple unions form an upazila (UPZ); multiple UPZs form a district; and multiple districts form a division. In total, there are eight divisions, 64 districts and 492 UPZs in Bangladesh.
9 Data were collected through a short phone survey in which only some key binary questions were asked, such as whether a beneficiary received rice or not, and whether a beneficiary was asked to pay bribe. This type of information is not subject to the criticism raised by Abate, de Brauw, Hirvonen, and Wolle (Citation2023) that consumption data collected by phone surveys are not reliable.
10 All our regression results are robust both in terms of magnitude and statistical significance if we estimate an unbalanced panel consisting of 2,797 beneficiaries. However, using the unbalanced panel requires us to exclude dealers’ characteristics from the regressions. Since transfers to beneficiaries were made by dealers, we consider those characteristics as important controls in the regressions, and we therefore work with the balanced panel.
11 In fact, 2,797 households were reinterviewed. The working sample reduced to 2,602 because dealers’ information was not available for the remaining households.
12 Nonetheless, we cautiously interpret our results as causal effect even after controlling for a rich set of variables that include household and dealer characteristics and geographic variations.
13 We do not have information about any collaboration of the dealers with individuals in the upstream administrative or political layers.
14 We do so as UPZs are the primary decision-making unit in the current context (See Abadie, Athey, Imbens, & Wooldridge, Citation2022, for an in-depth discussion on clustering).
15 No dealer characteristics (not reported) are found to be significant in any of the specifications, which corroborates the pervasiveness of dealers demanding bribes from beneficiaries.
16 As mentioned earlier, the difference between the amount received and the allocated 30 kg is very small. Therefore, the main source of leakage is at the extensive margin (due to a beneficiary not receiving rice at all). If we assign 30 kg to amount received, then the leakage would be either 0 (for those who received rice) or 1 (for those who did not receive any rice), which would be the reciprocal of the dependent variable in our previous regression analyses. We use the actual amount of rice received by a beneficiary.
17 Since there is no restriction on what beneficiaries can do with the rice received, they can immediately sell the rice in the open market at a higher price. If they choose to do this, then their transportation costs will be lower since they no longer need to carry the rice back to their residence.
18 The total minimum market value of a 30-kg bag of rice is BDT 1,350 (45*30). A beneficiary pays only BDT 300 (30*10)) and incurs BDT 60 for transportation. Her benefit for receiving a bag of rice (or welfare loss if she does not receive the rice and the dealer sells it in the black market) is BDT 993 (1,350 – 300 – 60). Therefore, the welfare loss per MT of rice is BDT 33,000 (990*1000/30).
19 Note that we carefully checked the eligibility criteria of these two programs and verified with the government officials that the exclusion criteria of these two programs do not include beneficiary from other existing programs including the FFP.
20 Similar findings are reported in Nairobi, Kenya, where only a small fraction of vulnerable families benefited from cash transfer programs implemented during the COVID-19 because of cronyism, nepotism and outright favouritism (Miguel & Mobarak, Citation2022).
21 See the media reports published in The Daily Star on April 12, The Business Standard on April 15, and The Washington Post on April 26, 2020.
1 This number is calculated using a margin of error of 5 percent or less and 18 percent leakage; the latter is based on Olken (Citation2006) in the absence of any prior knowledge of leakage in the FFP or any such program in Bangladesh.
2 Data could not be collected from one union because no selected beneficiaries could be traced due to frequent migrations in the area.
3 For each household the PMT score is constructed by adding the constant with each of the covariate times the associated weight. In other words, , where “i” denotes household and “k” denotes covariate included in the regression. For further details, see Chowdhury et al. Citation2020.
4 This is perhaps because their phone numbers had changed. Frequent switching to a different mobile phone operator is a regular phenomenon in Bangladesh, depending on the strength of the network connection (especially in rural areas) and deals offered by competing operators. In Bangladesh, such switching requires a new SIM card with a new phone number. Ahmed, Islam, Pakrashi, Rahman, & Siddique (Citation2021) in their phone survey from a pre-existing sample in Bangladesh, also had more than 20% attrition for similar reasons as ours during the COVID.
References
- Abadie, A., Athey, S., Imbens, G. W., & Wooldridge, J. M. (2022). When should you adjust standard errors for clustering? The Quarterly Journal of Economics, 138(1), 1–35. doi:10.1093/qje/qjac038
- Abate, G. T., de Brauw, A., Hirvonen, K., & Wolle, A. (2023). Measuring consumption over the phone: Evidence from a survey experiment in urban Ethiopia. Journal of Development Economics, 161, 103026. doi:10.1016/j.jdeveco.2022.103026
- Acemoglu, D., Chernozhukov, V., Werning, I., & Whinston, M. D. (2021). Optimal targeted lockdowns in a multigroup SIR Model. American Economic Review: Insights, 3(4), 487–502. doi:10.1257/aeri.20200590
- Ahmed, F., Islam, A., Pakrashi, D., Rahman, T., & Siddique, A. (2021). Determinants and dynamics of food insecurity during COVID-19 in rural Bangladesh. Food Policy, (March), 102066. doi:10.1016/j.foodpol.2021.102066
- Alfaro, L., Becerra, O., & Eslava, M. (2020). EMEs and COVID-19: Shutting Down in a World of Informal and Tiny Firms (NBER Working Paper No. 27360). Cambridge, MA. doi:10.3386/w27360
- Bangladesh Bureau of Statistics (BBS). (2018). Labor Force Survey: Bangladesh 2016-17. Dhaka: BBS.
- Bowen, T., del Ninno, C., Andrews, C., Coll-Black, S., Gentilini, U., Johnson, K., … Williams, A. (2020). Adaptive social protection: building resilience to shocks. International Development in Focus. Washington, DC: World Bank Publications.
- Brodeur, A., Gray, D., Islam, A., & Bhuiyan, S. (2021). A literature review of the economics of COVID‐19. Journal of Economic Surveys, 35(4), 1007–1044. doi:10.1111/joes.12423
- Bryan, G., Chowdhury, S., & Mobarak, A. M. (2014). Underinvestment in a profitable technology: The case of seasonal migration in Bangladesh. Econometrica, 82(5), 1671–1748.
- Bundervoet, T., Dávalos, M. E., & Garcia, N. (2022). The short-term impacts of COVID-19 on households in developing countries: An overview based on a harmonized dataset of high-frequency surveys. World Development, 153, 105844. doi:10.1016/j.worlddev.2022.105844
- Cañedo, A. P., Fabregas, R., & Gupta, P. (2023). Emergency cash transfers for informal workers: Impact evidence from Mexico. Journal of Public Economics, 219, 104820. doi:10.1016/j.jpubeco.2023.104820
- Castañeda, A., Doan, D., Newhouse, D., Nguyen, M. C., Uematsu, H., & Azevedo, J. P. (2018). A New Profile of the Global Poor. World Development, 101, 250–267. doi:10.1016/j.worlddev.2017.08.002
- Chakrabarti, S., Kishore, A., & Roy, D. (2018). Effectiveness of food subsidies in raising healthy food consumption: Public distribution of pulses in India. American Journal of Agricultural Economics, 100(5), 1427–1449. doi:10.1093/ajae/aay022
- Chowdhury, S., Hoque, M. M., Rashid, S., & Bin Khaled, M. N. (2020). Targeting errors and leakage in a large-scale in-kind transfer program: The food friendly program in Bangladesh as an example. IFPRI Discussion Paper, 01935(June).
- Drèze, J., & Khera, R. (2015). Understanding leakages in the public distribution system. Economic & Political Weekly, 50(7), 39–42.
- Dutta, S. (2020). Starvation Deaths and Denial of Welfare Entitlements – Insights from Jharkhand. Retrieved from https://papers.ssrn.com/.
- Egger, D., Miguel, E., Warren, S. S., Shenoy, A., Collins, E., Karlan, D., … Vernot, C. (2021). Falling living standards during the COVID-19 crisis: Quantitative evidence from nine developing countries. Science Advances, 7(6), 997. doi:10.1126/sciadv.abe0997
- Finance Division. (2020). Social Safety Net : 2019–20 & 2020–21 Financial Year Programs. Dhaka, Bangladesh. Retrieved from https://mof.portal.gov.bd.
- Fischer, R. (2020, March 19). What’s the difference between pandemic, epidemic, and outbreak? JSTOR Daily. Retrieved from https://daily.jstor.org/whats-the-difference-between-pandemic-epidemic-and-outbreak/.
- Government of Bangladesh. (2020). IBAS report. Dhaka, Bangladesh. Retrieved from mof.gov.bd.
- Hamadani, J. D., Hasan, M. I., Baldi, A. J., Hossain, S. J., Shiraji, S., Bhuiyan, M. S. A., … Pasricha, S.-R. (2020). Immediate impact of stay-at-home orders to control COVID-19 transmission on socioeconomic conditions, food insecurity, mental health, and intimate partner violence in Bangladeshi women and their families: an interrupted time series. The Lancet. Global Health, 8(11), e1380–e1389. doi:10.1016/S2214-109X(20)30366-1
- Hirvonen, K. (2023). Social protection: Adaptive safety nets for crisis recovery. In Global food policy report: Rethinking food crisis responses (pp. 52–61). International Food Policy Research Institute (IFPRI). Retrieved from https://gfpr.ifpri.info/.
- Loayza, N. V., & Pennings, S. (2020). Macroeconomic policy in the time of COVID-19 : A primer for developing countries. World Bank Research and Policy Briefs, 28. Retrieved from https://openknowledge.worldbank.org/handle/10986/33540.
- Miguel, E., & Mobarak, A. M. (2022). The economics of the COVID-19 pandemic in poor countries. Annual Review of Economics, 14(1), 253–285. doi:10.1146/annurev-economics-051520-025412
- Olken, B. A. (2006). Corruption and the costs of redistribution: Micro evidence from Indonesia. Journal of Public Economics, 90(4–5), 853–870. doi:10.1016/j.jpubeco.2005.05.004
- Rose-Ackerman, S. (2021). Corruption and COVID-19. EUNOMÍA. Revista en Cultura de la Legalidad, 2021, 16–36. doi:10.20318/eunomia.2021.6061
- Sabates-Wheeler, R., Hirvonen, K., Lind, J., & Hoddinott, J. (2022). Expanding social protection coverage with humanitarian aid: Lessons on targeting and transfer values from Ethiopia. The Journal of Development Studies, 58(10), 1981–2000. doi:10.1080/00220388.2022.2096443
- Sharif, I. (2012). Can Proxy Means Testing Improve the Targeting Performance of Social Safety Nets in Bangladesh? Bangladesh Development Studies, 35(2), 1–43.
- World Economic Forum. (2020, March 15). A visual history of pandemics. Retrieved November 1, 2022, from https://www.weforum.org.
Appendix.
Data sources and descriptions
In the first stage, 227 unions were included in the sample.Footnote1 These 227 unions were distributed to eight divisions based on the proportion of their rural population living in poverty (see Table A.1 in Chowdhury, Hoque, Rashid, & Bin Khaled, Citation2020) and randomly drawn from the respective divisions. The sampled unions were distributed across 175 UPZs in all 61 districts in the country (out of 64 districts) where the FFP program was launched. The distribution of the sample unions is presented in .
Figure A1. Map of Bangladesh Showing the 175 Survey UPZs of Food Friendly Program Survey.
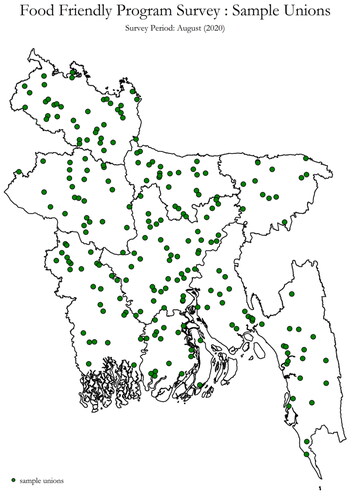
Table A1. Characteristics of households followed up in 2020 relative to the attrited sample in 2020 (households we could not reach)
A balance test was conducted between the sample 227 unions and the remaining 3,885 unions to ensure that the samples were representative of Bangladesh. The five indicators for the balance test that we consider most relevant for the objective and implementation of the FFP are the following: i) the district poverty rate, obtained from the 2016 Bangladesh Household Income and Expenditure Survey report (HIES 2016) and serving as a proxy for the union’s poverty rate; ii) the size of the population in the union, obtained from the 2011 Population Census conducted by the Bangladesh Bureau of Statistics; iii) the political affiliations of elected Members of the Parliament in the 2008 national election, obtained from the Election Commission; iv) the distance of the union from the UPZ headquarters and Dhaka, calculated using GIS data and functioning as indicators of remoteness; and v) the number of beneficiaries and the amount of rice allocated to each UPZ in previous program cycles in 2016-17, obtained from the Ministry of Food’s district record. The balance test results show no statistically significant differences between in- and out-of-sample unions (Table 1 in Chowdhury et al., Citation2020).
In the second stage of data collection, 25 beneficiaries from each union were randomly selected from the list of beneficiaries obtained from the central website of the Directorate General of Food. The first 20 beneficiaries in the list were interviewed. If any of these 20 beneficiaries could not be located, (s)he was replaced by the next beneficiary (21st) on the list. A total of 4,526 beneficiaries in 226 unionsFootnote2 were interviewed, and detailed beneficiary-level information on demographic and socio-economic characteristics, receipt of the FFP transfers during March and April, and any reported experiences of bribery while receiving (or attempting to receive) the subsidised rice was collected. The dealer from each union in charge of distributing rice to beneficiaries was also interviewed (except those who could not be found during the survey or declined to respond). Detailed dealer-level information was collected, including demographic and socio-economic characteristics and political connections.
For each beneficiary, we collected additional information to estimate proxy means test (PMT) scores. PMT scores is a proxy for household socioeconomic status and a widely used tool for targeting social welfare programs and provides a cost-effective way to predict poverty using observable information when income and consumption data are not feasible to collect. In our 2018 survey, we identified and collected information on key covariates associated with poverty status in Bangladesh (Sharif, Citation2012): (a) socio-demographics and household head characteristics; (b) ownership of assets that are easily verifiable; (c) housing and sanitation quality and access to remittance; (d) geo-location variables. We used HIES (2016) data to obtain the coefficients (weights) from the regression of per capita consumption on these variables and estimated a PMT score for each household in the FFP survey sample using the associated coefficients. We then determined a cut-off PMT score to identify “poor” households.Footnote3
The second survey round was conducted at the beneficiary level in August 2020. This survey was conducted over the phone, unlike the in-person survey in 2018. Although approximately 90 percent of the beneficiaries had a mobile phone in 2018, only about 64 percent of them (2,797) could be contacted by phone in 2020.Footnote4