
 ?Mathematical formulae have been encoded as MathML and are displayed in this HTML version using MathJax in order to improve their display. Uncheck the box to turn MathJax off. This feature requires Javascript. Click on a formula to zoom.
Abstract
This paper examines the national saving behaviour in the process of economic growth through a comparative analysis of countries in developing Asia from a historical perspective. Developing Asia provides an ideal laboratory for the study with considerable differences in the saving behaviour among countries and over time within individual countries, notwithstanding the ‘model saver’ image of the region that is based mainly on the experience of high-performing East Asian economies. The empirical analysis distinguishes between private and government saving rates, with specific emphasis on the former. The results of the empirical analysis are consistent with the view of a ‘virtuous circle’ between growth and saving, with growth initiating the saving transition. No evidence to suggest that a prior phase of promoting saving through specific policy initiatives is needed to initiate the process of growth and structural transformation. The private saving rate is also associated positively with export orientation of the economy, and net foreign capital inflows and negatively with the young dependency ratio of the population and domestic credit availability.
1. Introduction
The literature on national saving in the process of economic development and structural change has evolved around two separate but interrelated issues: what is the relationship between the saving rate and growth, and why do saving rates differ across countries and over time in a given country? The debate on the first issue has been virtually settled, even though there has been some controversy about why a given saving rate is associated with different growth rates and in what way the causality runs. In the formative stage of development thinking during the early post-war years, the Harrod-Domar model, which held sway as the workhorse of development policy, linked growth directly and almost exclusively to the saving rate (Meier, Citation1984). Given the perceived structural constraints on domestic saving mobilization in developing countries, foreign saving (foreign capital inflows) was considered a key prerequisite for economic take-off. The supremacy of saving (and hence investment) in the growth process was, however, questioned by the neoclassical growth model (Solow, Citation1956) that received increased attention in the policy debate from the late 1960s. It postulated that an increase in saving rates generates higher growth only in the transition between steady states, and long-term growth depends solely on technological progress. Since about the late 1980s, the new endogenous growth models have, however, provided theoretical support for the view that investment results in a permanent increase in growth rates. New multi-country empirical growth studies spawned by these theoretical advances have supported the notion that the rate of investment is the single most robust correlate of long-run growth (Bond, Leblebicioǧlu, & Schiantarelli, Citation2010; Levine & Renelt, Citation1992; Sala-I-Martin, Citation1997).
In contrast to the emerging consensus on the saving-growth nexus, the issue of why some countries save more than others remains an unresolved issue. What is the process by which a community that was previously saving a low percentage of national income dramatically increases its saving? Do countries need to start with specific saving proportion policies to initiate the growth process or by harnessing foreign capital inflows? Alternatively, would initiation of the growth process through economy-wide market-oriented reforms generate a ‘virtuous cycle’ of growth-induced saving, resulting in a further increase in saving to generate even higher saving and growth? The purpose of this paper is to contribute to this debate through a comparative analysis of saving behaviour in countries in developing Asia from a historical perspective.
The focus on Asia is motivated by two reasons. First, the experiences of these countries as ‘model savers’ figure prominently in the contemporary policy debate on the role of domestic saving in economic development and how to bridge the domestic investment-saving gap that constrains the growth process in most developing countries (Grigoli, Herman, & Schmidt-Hebbel, Citation2018; Ranis, Citation1995; Stiglitz, Citation1996). Second, notwithstanding the ‘model saver’ image, which is based mainly on the experience of high-performing East Asian economies, there are considerable differences in the saving behaviour among countries and over time within individual countries in the region. Therefore, the region provides an ideal laboratory to study the determinants of saving in the process of economic growth and structural transformation.
The paper aims to add to the existing knowledge of the saving behaviour of countries in developing Asia in several ways. First, for the first time in the study of comparative saving behaviour in the region,Footnote1 the analysis distinguishes between private and government saving rates, with specific emphasis on the former. The specific focus on private saving is important from the policy point of view because public saving is mostly driven by unobservable political factors. Second, export orientation in the development process is explicitly included in the saving function as a conditioning variable in examining the relationship between the saving rate and per capita income growth. Third, benefiting from recent improvements in the national data reporting systems, we use an annual balance panel data set for the period 1980–2019, encompassing countries in Northeast Asia, Southeast Asia, and South Asia. Finally, we use improved econometric techniques in estimating the saving function to allow for unobserved heterogeneity among countries, a common problem in estimation with cross-sectional data, while addressing endogeneity bias in the saving-growth nexus.
The paper is structured in four sections. Section 2 presents a comparative analytical narrative of saving performance in Asia in the global context, with emphasis on policy regime shifts. Section 3 undertakes an econometric analysis of the determinants of the saving rate. The key findings are summarised in the concluding section.
2. Saving behaviour in developing Asia: a historical perspective
2.1. Overall patterns
The saving rates in Asian countries were not unusually large in the early post-war years. Rosenstein-Rodan (Citation1961), in a pioneering study undertaken to inform the policy debate on international development aid, estimated the average gross saving rate of Asian countries at 7.0 per cent compared to 9.4 per cent in Latin America and only 1 per cent higher than that in Africa (5.9%). Interestingly, at the individual country level, Burma (Myanmar) and India had a higher similar saving rate of 8.5 per cent compared to Taiwan (8.0%) and South Korea (6.5%) (Rosenstein-Rodan, Citation1961, -A).
The patterns began to change in the late 1960s. By the early 1970s, the average Asian saving rate exceeded that of Latin America and was more than double the average rate recorded in Sub-Saharan Africa. During the ensuing years, the gap between the Asian rate and those of the other major regions and the overall world saving rate has widened. Overall, the Asian saving rates have also been much more stable ( and ).
At the formative stage of the emergence of development economics as a separate discipline, Sir Arthur Lewis (Citation1954) made the following highly cited observation on the role of the saving transition in the process of economic development:
The central problem in the theory of economic development is to understand the process by which a community which was previously saving and investing 4 or 5 per cent of its national income or less, converts itself into an economy where voluntary saving is running at about 12 to 15 per cent of national income or more. This is the central problem because the central fact of economic development is rapid capital accumulation (including knowledge and skills with ‘capital’). We cannot explain any ‘industrial’ revolution (as the economic historians pretend to do) until we can explain why saving increased relatively to national income (Lewis, Citation1954, p. 155).
The countries in Northeast Asia and SingaporeFootnote2 had already passed the ‘Lewisian threshold’ by the early 1980s, all major Southeast Asian countries other than Indonesia and the Philippines by the early 1990s, and India in the early 2000s. Bangladesh, Pakistan, Sri Lanka, and the Philippines remain short of reaching the threshold throughout the periods under study ( and Table SM2-1 in Supplementary Materials).
2.2. Private and government saving
The data on gross national saving disaggregated by private and public (government) saving are summarised in for 13 Asian countries, for which data are available at least for the past three decades. It is important to note that these data are not strictly comparable with those reported in . The gross national saving rate additionally captures remittances by migrant workers. The saving rates reported here are, therefore, higher for countries that receive a significant inflow of migrant worker remittances (in particular in Sri Lanka and the Philippines). Nonetheless, overall, the general picture presented is comparable.
Overall, both intercountry differences in national saving behaviour and intertemporal patterns within countries are dominated by private saving. The rate of public (government) saving is not as high as observed in some comparative studies. For instance, Edwards (Citation1996) wrote that government saving accounted for between 30 and 40 per cent of total national saving in East Asian countries. However, during 1980–2009, on average, government saving in Asia as a percentage of GNI amounted to 4 per cent compared to a private saving rate of 26 per cent. That is, the government directly accounted for only about 15 per cent of total national saving in the region.
Government saving in East Asian countries are notably higher than in South Asia. During 1980–2019, the combined government saving rates in Northeast Asia and Southeast Asia were 2.8 and 4.2 per cent, respectively, compared to just 1.5 per cent in South Asia. The government saving rates are notably high in Singapore and Indonesia, averaging 9–11 per cent of gross national income in both countries. The high government saving rate in Indonesia, notwithstanding its relatively lower raking in overall saving performance in East Asia, seems to reflect the country’s longstanding strict fiscal discipline, enforced by a rule that prohibits the government from borrowing domestically to finance expenditures (ADB, Citation1997; Blöndal, Hawkesworth, & Choi, Citation2009).
In analysing behaviour of private saving, it is important to examine how corporate saving has behaved compared to household and government saving. Unfortunately, disaggregated data are not available for a sufficient number of countries in the regional sector for a comparative analysis. The available data for China, Taiwan, Korea, the Philippines, and India are plotted in Figure SM2-1 in Supplementary Materials. In Korea and Taiwan, corporate saving has been the prime mover of national saving over the past two decades or so, with the gap between household and corporate saving widening over the years. In China, corporate and household saving have contributed almost equally to the increase in national saving during the entire period of 1992–2019, without any notable change in their relative contribution. Corporate saving in India has begun to show a modest increase following the first wave of liberalisation reforms in the mid-1980s and gained impetus from the second-wave reforms initiated in the early 1990s.
2.3. Open-economy dimension of saving–growth nexus
By definition, domestic investment is the sum of domestic saving and foreign saving (net foreign capital inflow). To what extent have Asian countries relied on foreign saving to finance investment? This question is directly relevant for the ensuing analysis of the saving-growth nexus because the Asian economies have become increasingly opened not only through current account transactions but also through capital account transactions during the period under study. In this context, the degree of dependence on foreign saving investment could weaken the postulated link between the national saving and growth.
There are notable intercountry differences in terms of the capital-importing (‘deficit’ saving) and capital-exporting (‘excess’ saving) status (Table SM2-1). In Northeast Asia, Taiwan has been a net capital exporter throughout this period, with capital exports relative to domestic national income increasing over the past three decades. China and Korea became net capital exporters in the 2000s, following drawing on foreign saving to meet the investment-saving gap in the 1980s and 1990s. Countries in Southeast Asia exhibit a mixed picture. Malaysia, Thailand, and Singapore have become capital exporters over time, with Singapore becoming by far the largest capital exporter relative to national income in the Asian region. Overall, the countries’ relative performance in terms of their evolving investment-saving gap seems to mirror differences in the timing and depth of the market-oriented reforms. The four South Asian countries have continued to rely on foreign saving to fill the domestic investment-saving gap. However, even in these countries, domestic saving has accounted for over 90 per cent of total domestic investment, after allowing for the exceptional cases of Bangladesh and Sri Lanka in the 1980s. Interestingly, unlike in Latin America, net capital flows in all countries during most of the period under study were generally dominated by foreign direct investment (FDI) rather than portfolio capital, which is more volatile and susceptible to external shocks (Athukorala & Rajapatirana, Citation2003).
3. Saving rate determination: empirical analysis
The section undertakes an econometric analysis of the determinants of saving using a panel data set for 12 Asian countriesFootnote3 for which data are available for the entire period 1980–2019. We focus specifically on private saving because preliminary analysis suggested that public saving is mostly driven by unobservable political factors. Data are not available for further disaggregating private saving into household saving and corporate saving (retailed earnings). Apart from this data constraint, the focus on aggregate private saving is justified by the ‘consideration that corporate saving, just like personal (or household) saving, will tend to result, at least in the long run, in an increase in private net worth by way of its net effect on the market value of corporate equity’ (Modigliani, Citation1966). Provided the shareholders look through the corporate veil and take into account corporate saving (retained earnings) in their lifetime saving/consumption decisions, no separate treatment of household and corporate saving is needed to understand the saving behaviour of the economy. This view is no doubt an approximation (Gersovitz, Citation1988; Poterba, Citation1991). Shareholders may be myopic and fail to devote the necessary resources to monitor corporate performance. Various factors impacting on business operations, such as liquidity constraints, tax policies, and other kinds of capital market imperfections could limit shareholders’ ability to pierce the corporate veil. Perhaps these factors would have become increasingly important in contributing to the dichotomy between personal saving and corporate saving in the context of the shrinking of labour share in relation to corporate profit in private income as an integral facet of the ongoing process of economic globalisation (Redeker, Citation2022).Footnote4
3.1. The model
The saving function is formulated based on the life cycle model (LCM). The attractiveness of the LCM for our analysis lies in both its elegant formulation of the impact of income growth and demographic dynamics, which are central to understanding the saving transition in the process of growth and structural change. The LMC also has the flexibility to incorporate other relevant theoretical considerations without changing the basic structure of the model (Deaton, Citation2005).
The LCM originated in Modigliani and Brumberg (Citation1954), which worked out a theory of spending based on the postulate that working-age people make provision for their retirement by tailoring consumption patterns to income at different ages over life time, independently of the income at each age.Footnote5 Modigliani and co-researchers subsequently extended the theory into an analytical framework applicable to the economy as a whole that led to the important prediction that national saving depends on the rate of national income growth, not its level, and demographic profile of the economy (see Modigliani, Citation1986, and works cited therein). In an economy in which national income is growing so that each generation is better off than their parents, the young will be saving on a larger scale than the old, so that faster the growth, the higher the saving rate. Saving is therefore the consequence of growth, not the wellspring of growth. At the same time, an increase in the population growth rate increases the working-age population (savers) relative to the number of retirees (dissavers). Thus, even if all the individuals in two given economies have the same saving profile over their life cycles, the aggregate saving rate can be different depending on population dynamics. A sizeable body of literature over the past five decades has further expanded and enriched the model to deal with a wide range of issues about consumption and saving. As discussed in the Supplementary Materials, the literature on saving behaviour evolving over the past five decades suggests several other variables that have the potential to impact the saving rate by conditioning the impact of economic growth and population dynamics on households’ ability to allocate lifetime resources between current and future consumption (and hence saving behaviour).
Informed by this literature and tailored to data availability, we specify the saving function in a panel data setting as follows:
(1)
(1)
where PSR is a private saving rate;
and
are country- and time-specific effects;
The explanatory variables are defined below with the expected signs of given in brackets:
GY (+) The rate of growth of per capita private income
YDEP (−) Young dependency measured as the ratio of the population aged 15 and under to the working-age population (aged 16–64)
ADEP (−) Aged dependency measured as the ratio of the population aged 65 and older to the working-age population (aged 16–64)
EOR (+) Export orientation measured as exports relative to GDP
RID (?) The real interest rate on bank deposits
(?) Inflation rate
CRP (−) Institutional lending to the private sector as a ratio of private income
SSP (−) Social security payments as a ratio of private income
FND (−) Financial deepening of the economy
FS (?) Foreign capital inflow as a percentage of gross national income
BBL (?) Government budget balance as a percentage of gross national income
The estimation of the saving function (EquationEquation 1(1)
(1) ) is undertaken using an annual balanced panel data set that covers the period 1980–2019. The data source and variable measurement are discussed in Appendix A.
3.2. Econometric procedure
We began the estimation process by examining the time series properties of the panel data using the Im-Persara-Shin (CIPS) test (Pesaran, Citation2007). The results indicated that the private saving series, PSR, and all other explanatory variables except GY, RID, and FS are non-stationary (I(1)). Based on this result, we conducted the test panel cointegration test of Pedroni (Citation2004) to examine the existence of a long-run relationship among the variables. The results indicated that two of the four test statistics relating to cointegration of the ‘within dimension’ of the data panel and one of the three relating to cointegration of the ‘between dimension’ of the data panel are statistically significant. These results (reported in Table SM2-3 in Supplementary Materials) provide sufficient grounds to use the panel-data ARDL estimator to estimate the saving function.
EquationEquation (1)(1)
(1) can be rewritten in ARDL form as follows:
(2)
(2)
where
is the saving rate;
is a vector of explanatory variables; and
is scalars or the coefficient of the lagged dependent variable.
When reparametrized in error correction form, EquationEquation (2)(2)
(2) takes the following form:
(3)
(3)
where
is the speed of adjustment coefficient (expected that
), representing the speed of adjustment of imports to a shock to move back to the long-run equilibrium;
is the vector of long-run coefficients;
is the error correction term; and
and
are the short-run coefficients.
The error correction formulation of the model (EquationEquation 3(3)
(3) ) permits us to examine short- and long-run dynamics and the speed of adjustment of the model to equilibrium. This formulation is ‘robust to integration and cointegration properties of the regressors, and for sufficient lag-orders, it could be immune to the endogeneity problem, at least as far as the long-run properties of the model are concerned’ (Pesaran, Citation2015, p. 726). Since we work with an annual panel data set with sufficient time coverage (39 years) that permits systematically testing lag orders, possible endogeneity bias could be asymptotically negligible due to the super consistency property resulting from the parametrization of the model in levels and divergences.
The Akaike information criterion (AIC) is used to decide the appropriate lag length. Two alternative estimators are used to explore the potential heterogeneity of parameters among the countries within the data panel: the dynamic fixed effects (DFE) estimator and the mean group (MG) estimator (Pesaran, Citation2015). The DFE estimator allows the intercepts to differ freely across groups, while all other coefficients and error variances are constrained to be the same. The MG estimator allows coefficients to differ freely across groups by first estimating one equation per group (a country in our case) and taking the average across groups (countries). The Hausman test is used to identify the appropriate estimator (Hausman, Citation1978).
3.3. Results
The saving function was estimated for the 12 countries, and the countries other than China. In both cases, the DFE was the appropriate estimator in terms of the Hausman test. The results are reported in . A comparison of the two equations helps understand the possible sensitivity of the results to China’s dominance in the overall saving performance in Asia.
The social security payment (SSP) is dropped from the reported equations because data were not available for three countries (China, Indonesia, and India), and data for some years are missing for other countries. In the equation estimated for the other nine countries, the coefficient had the expected negative sign but was not statistically significant, and its inclusion had no notable impact on the estimated coefficients of the other variables.
Given our focus on saving transition in the growth process, we are mainly interested in the long-run estimates. In both equations, the coefficient of the ECM term is highly statistically significant with the expected negative sign, suggesting a moderate (about 1.4 years) speed of convergence of PSR to equilibrium. In the equation for all countries (EquationEquation 1(1)
(1) ), the coefficients of GY is statistically significant at the 1 per cent level. The results suggest that a one percentage point increase in the growth rate of per capita private income is a 1.27 percentage point increase in the long run. The results are remarkably resilient to the exclusion of China from the country coverage (EquationEquation 2
(2)
(2) ).
Relating to the interpretation of this result, an important issue is the possible endogeneity of GY in the model (Deaton, Citation2005). However, as noted, the panel ARDL estimator has the advantage of minimising possible endogeneity of the right-hand variables by reparametrizing the model in levels and differences. As a further test, we performed the Granger causality test and impulse response function (IRF) analysis using the panel-data vector auto-regression procedure developed by Abrigo and Love (Citation2016). The test results are reported in Table SM2-4 and Figure SM2-3 in Supplementary Materials. According to the Granger causality test, the null hypothesis that GY does not cause PSR is rejected; but the hypothesis that PSR does not Granger-cause GY is not rejected, at the 0.05 significant level. The Impulse Response Functions (IRFs) confirm this finding (Compare the bottom left and top right graphs in Figure SM2-3 in Supplementary Materials). Thus, there is strong evidence that growth drives saving rather than the reverse.
This inference receives further empirical support when we place the time profile of saving patterns among and within the Asian countries (as surveyed in Section 2 and depicted in Figure SM2-2) within the context of the extensively-documented reform process and growth trajectories of these countries.Footnote6 In particular, we can see a clear relationship between the timing and nature of market-oriented policy reforms and saving transitions. Korea, Taiwan, and Singapore were the earliest reformers in the region in the late 1960s. These countries had decisively passed the Lewisian saving threshold by the early or mid-1980s. Malaysia and Thailand followed Singapore about a decade later. A comparison of the saving rates of these countries for the past three decades with those during 1965–1979 points to the impact of policy regime shifts on saving. In Indonesia, the domestic saving rate has recorded a notable increase following reforms that began earlier in that decade. The dramatic saving transition in China began following the country’s gradual shift from ‘plan to market’ in the late 1970s. India, which had lost its early lead in saving ranking in the devaluing world for over four decades, has begun to catch up following the liberalisation reforms initiated in the early 1990s. Sri Lanka recorded a significant increase in the saving rate following the liberalisation reforms in the late 1970s, but the trend has begun to reverse in recent years, underpinned by a notable reversal of reforms. Vietnam began to replicate the early experiences of Korea and Taiwan in the early 1990s. The reform process gathered momentum in the early 2000s. Its saving rate has been increasing rapidly since then.
There is strong evidence that export orientation (EOR) is significantly associated with the intercountry difference in the saving rate. A one percentage point increase in the degree of export orientation is associated with a 0.03 per cent increase in the saving rate in the long run. Moreover, the coefficient of EOR*GY indicates that export orientation adds 0.09 percentage points to the association between the per capita income growth rate and the saving rate.
The coefficient of YDEP is statistically significant with the expected negative sign, suggesting that a one percentage point increase in the share of young dependents in the population contributes to a 0.17 percentage point decline in the saving rate. However, interestingly, there is no statistically significant evidence to support the standard LCM that aged dependency (ADEP) contributes to dampening saving propensity. This result is not consistent with the available evidence for development countries (e.g. Bloom, Canning, Mansfield, & Moore, Citation2007; Horioka, Citation1991; Leff, Citation1969). There are several possible reasons that support our result. First, given the prevalence of informal sector employment and the limited coverage of retirement benefit schemes even in formal employment, the line of demarcation between the working age and formal retirement remains blurred in the Asian context. Second, the rise in life expectancy as an integral facet of economic growth could have a significant effect on saving behaviour in old age, particularly in the East Asian high-performing countries where mortality transition has been very rapid (Kinugasa & Mason, Citation2007). Third, households in developing countries generally tend to be larger than in advanced countries, and resources are shared between members actively engaged in the labour force and dependents (Deaton, Citation1989; Gersovitz, Citation1988).
There is strong evidence that foreign capital inflows (FS) are complementary to private saving, in contrast to the findings of some previous studies that foreign capital inflows tend to crowd out domestic saving. This finding is consistent with the evidence that foreign capital inflows to Asian countries by and large have mostly taken the form of direct foreign investment (which directly contributes to the production capacity of the countries) rather than foreign aid, which mostly takes the form of budgetary supports and/or investment in public sector projects (Athukorala & Rajapatirana, Citation2003; Reinhart & Talvi, Citation1998; Table SM2-5 in Supplementary Materials).
The bank credit variable (CRP) has a significant negative effect on private saving, as expected. This result is consistent with the hypothesis that, in the presence of easy access to bank credit, there is no compelling reason for people to save more at present to undertake lumpy (indivisible) expenditure plans in the future (Gersovitz, Citation1988). The coefficient of financial deepening (FND) has the expected positive sign but is not statistically significant.
The coefficient of the real interest rate variable (RID) is not statistically significant, and its magnitude is barely different from zero. It seems that the income effect of the real interest rate counterbalances its substitution effect in the Asian context. The coefficient of the budget balance to GNI ratio (BBL) does not support the Ricardian equivalence hypothesis. This result is consistent with the LCM proposition that private saving, being controlled by life cycle considerations, should be nearly independent of the government budget stance (Modigliani, Citation1986).
We estimated the saving equation for the total national saving rate (NSR) for comparison. The results are reported in Table SM2-5 in Supplementary Materials. Both the long-run and short-run coefficients of GY are highly significant as in the private saving equations, but their magnitudes are slightly smaller. The coefficients of the other variables except EOR&GY are broadly similar in terms of the signs and statistical significance, but their magnitudes are notably different. The negative and statistically significant coefficient of EOR*GY perhaps captures the fiscal costs (tax incentives and other expenditures) involved, which counterbalance the direct positive effect of export orientation on national saving under the export-oriented development strategy. In sum, this comparison alerts the risk of making inferences about saving behaviour using aggregate national saving data because of the impact of exogenous political factors on government saving.
To comment on the short-run results, the coefficient of GY is statistically significant at the 1 per cent level, with a much smaller (0.25) compared to the long-run coefficient of 1.26 (EquationEquation 1(1)
(1) ). This difference is consistent with the standard life cycle postulate that accumulation of saving is an intertemporal process within the working age. Interesting, the coefficients of the two crisis dummies (AFC and GFC) are statistically significant with the perverse (positive) sign. Presumably, the crisis-propelled economic uncertainty may have induced private saving (Kim, Citation2001). Moreover, as already noted, there was also no massive disruption in export-oriented production in the East Asian economies because of the remarkable resilience of FDI to the crises. The result for RID suggests a modest negative effect of real interest rate (RID) on the private saving rate. Presumably, an increase in RID raises expected lifetime income of net savers and thus tends to increase consumption and decrease saving in the short run before moving towards the steady state based on life cycle considerations. The coefficient of BBL is statistically significant, with the negative sign suggesting that the Ricardian equivalence proposition holds in the short run. However, this result is not inconsistent with the long-run results reported earlier, given the LCM proposition that the private saving rate is eventually determined by life cycle considerations.
How do our multi-country results for Asia compare with the findings of the previous individual country studies of private saving in the region (Ang & Sen, Citation2011; Athukorala & Sen, Citation2004; Athukorala & Tsai, Citation2003; Curtis, Lugauer, & Mark, Citation2015; Ge, Yang, & Zhang, Citation2018; Jongwanich, Citation2010; Modigliani & Cao, Citation2004; Park & Rhee, Citation2005; Sun & Liang, Citation1982)? There are vast differences among these studies in terms of the specification of the saving fiction, reflecting the nature of data availability and presumably reflecting the researchers’ own preferences dictated by methodological reasons.
The only explanatory variable commonly used in all studies is the per capita income growth rate. The results for this variable support a positive association between income growth and private saving rates, with the magnitude of the coefficient varying in the range of 0.3–1.7 per cent. Only Athukorala and Tsai (Citation2003) for Taiwan and Jongwanich (Citation2010) for Thailand have included young and aged dependency ratios separately for testing the impact of the demographic transition on the private saving rate. The results in both studies suggest that both young and aged dependency have a negative impact on the private saving rate and the impact of the former is greater in magnitude compared to that of the latter. However, household survey-based studies by Park and Rhee (Citation2005) for South Korea and Curtis et al. (Citation2015) for China failed to detect a significant impact of population ageing on the saving rate. These mixed results seem consistent with the failure of our saving function estimates to detect a negative relationship between population ageing and the saving rate. Consistent with our results, Ang and Sen (Citation2011) for Malaysia and India, and Jongwanich (Citation2010) for Thailand find that access to bank credit is negatively associated with the saving rate.
4. Concluding remarks
The national gross saving rates in Asia were broadly comparable to those in the rest of the developing world in the early post-war years. The patterns began to change around the late 1960s. During the ensuing year, the difference between the average Asian saving rate and those of the other major regions and the overall world saving rate has widened. By the late 2010s, the average Asian saving rate was about 37 per cent compared to the global average of about 28 per cent.
The regional average hides substantial sub-regional and individual country differences in saving behaviour in Asia. Countries in Northeast Asia top the saving rate ranking, followed by Southeast Asia. Saving rates in countries in South Asia, though much lower compared to Southeast Asia, are higher compared to the other regions. Within Northeast Asia, the high saving rates of Taiwan and South Korea began to decline around the late 1990s, but the spectacular increase in saving in China has more than counterbalanced this decline. China now accounts for over two-thirds of total national saving (in value) in the region. Within Southeast Asia, the saving rate of Singapore has continued to increase, in contrast to the recent decline in the saving rates of Korea and Taiwan. In Southeast Asia, a comparison of the saving rates for the past three decades with those during 1965–1979 points to the impact of policy regime shifts on saving. Notwithstanding these differences, a unifying theme of overall saving behaviour in Asia is that policy regime shifts in favour of an outward-oriented development strategy have underpinned the time patterns of saving behaviour. The trends and patterns of saving in Asia have been predominantly driven by the private sector: the governments directly accounted for only about 15 per cent of total national saving in the region.
The findings of the econometric analysis are consistent with the LCM hypothesis that growth is the wellspring of saving, not the consequence of prior saving accumulation. There is no evidence to suggest that the prior phase of promoting saving through a specific policy initiative to promote domestic saving or filling the investment-saving gap is needed to initiate the process of growth and structural transformation. There is strong evidence that export orientation contributes to higher private saving both by its direct contribution and by compounding the impact of the rate of income growth on the saving rate. Foreign capital inflows are complementary to domestic saving.
As regards the nexus of demographic transition and domestic saving, only the change in the young dependency ratio seems to have a significant impact on national saving behaviour. The pattern of the aged dependency ratio dampening national saving in developed countries is not revealed by the data in Asia presumably because, given the prevalence of informal sector employment and the limited coverage of retirement benefit schemes even in formal employment, the line of demarcation between working age and formal retirement remains blurred in these countries.
In the analysis of the private saving in this paper, like in other previous multicounty studies, we have lumped together household (private) and corporate saving (retailed running) because of the unavailability of data for a disaggregated analysis. The findings are therefore based on the assumption that there is a strong complementarity between household saving and corporate saving. However, as we have noted, there are reasons to challenge this assumption. In particular, the complementarity between housebound and corporate saving could have eroded in recent decades because of the shrinking of labour share in relation to corporate profit in national private income as an integral facet of the ongoing process of economic globalisation. Comparative analysis of household and corporate saving behaviour is therefore a promising subject for further research.
Another promising subject for further research, which we have overlooked in this paper because of the unavailability of time series data with sufficient time coverage, is the implications of labour market conditions for personal saving. Labour market conditions, such as women’s labour market participation rate, urban-rural composition of the labour force, labour income risk, social security systems for cushion workers against employment losses, and relative importance of labour income compared to non-labour in household earnings, have the potential to shape life cycle considerations of saving behaviour.
Finally, it is important to emphasise that the econometric evidence reported in the paper simply reflects the average macroeconomic pattern of the saving behaviour of the 12 countries covered in the analysis. Obviously, there can be notable exceptions to the depicted average pattern. Also, the results are subject to the well-known limitations of saving data derived as a residual from the related macroeconomic variables (the ‘tyranny of residual’). Presumably, the magnitude of the measurement error varies among countries and even over time in given countries. Because of these reasons, the inferences made in this paper need to be treated only as a point of departure for informing the policy debate in individual countries. Multi-country studies, regardless of methodological issues, are not a substitute for systematic case studies of individual countries undertaken by taking into account socio-economic and structural peculiarities and paying due attention to data quality and consistency.
Supplemental Material
Download PDF (893.5 KB)Acknowledgements
We are grateful to Tony Addison, Kunal Sen, the managing editor of this journal, and the two referees for comments and suggestions. We acknowledge the help of Wishnu Mahraddika, Arianto Patunru, and Wannaphong Durongkavero in data collection and literature search.
Disclosure statement
No potential conflict of interest was reported by the author(s).
Notes
1 The previous comparative studies of aggregate national saving in Asia are ADB (1997), Collins (Citation1991), Horioka and Terada-Hagiwara (Citation2012), and World Bank (Citation1993).
2 From about the early 1980s, Singapore has recorded by far the highest saving rate in the region (and perhaps in the world). This ‘exceptional saver’ status of Singapore is partly the result of a unique government policy that required all workers to make very large annual contributions to a pension fund, which can be used ahead of retirement for a variety of purposes other than current consumption.
3 The countries listed in Table SM2-2 in Supplementary Materials except Vietnam.
4 There is a dearth of empirical studies comparing corporate and personal saving behaviour. The findings of Horioka (Citation1991) for Japan and Aron and Muellbauer (Citation2000) for South Africa support the ‘piercing of the corporate veil by individual savers’. Poterba (Citation1991) has come up with mixed results for the United States, the UK, and Canada.
5 For a succinct formal presentation of the basic model, see Gersovitz (Citation1988, Section 2.1).
6 See Athukorala (Citation2021), Perkins (Citation2013), and World Bank (Citation1993) for surveys.
References
- Abrigo, M., & Love, L. (2016). Estimation of panel vector autoregression in Stata. The Stata Journal: Promoting Communications on Statistics and Stata, 16(3), 778–804. doi:10.1177/1536867X1601600314
- Ang, J. B., & Sen, K. (2011). Private saving in India and Malaysia compared: The roles of financial liberalization and expected pension benefits. Empirical Economics, 41(2), 247–267. doi:10.1007/s00181-010-0386-3
- Aron, J., & Muellbauer, J. (2000). Personal and corporate saving in South Africa. The World Bank Economic Review, 14(3), 509–544. doi:10.1093/wber/14.3.509
- Asian Development Bank (1997). Emerging Asia: Changes and challenges. Manila: ADB.
- Athukorala, P. (2021). Introduction to Asian economic development. In P. Athukorala (Ed.), Asian economic development (Vol. 1, pp. xiii–xxix). Cheltenham, UK: Edward Elgar.
- Athukorala, P., & Rajapatirana, S. (2003). Capital inflows and the real exchange rate: A comparative study of Asia and Latin America. The World Economy, 26(4), 613–637. doi:10.1111/1467-9701.00539
- Athukorala, P., & Sen, K. (2004). The determinants of private saving in India. World Development, 32(3), 491–503. doi:10.1016/j.worlddev.2003.07.008
- Athukorala, P., & Tsai, P. L. (2003). Determinants of household saving in Taiwan: Growth, demography and public policy. Journal of Development Studies, 39(5), 65–88. doi:10.1080/00220380412331333149
- Blöndal, J. R., Hawkesworth, I., & Choi, D. H. (2009). Budgeting in Indonesia. OECD Journal on Budgeting, 9(2), 1–31. doi:10.1787/budget-9-5ks72wv89p48
- Bloom, D. E., D., Canning, D., R. K., Mansfield, R. K., & Moore, M. (2007). Demographic change, social security systems, and saving. Journal of Monetary Economics, 54(1), 92–114. doi:10.1016/j.jmoneco.2006.12.004
- Bond, S., Leblebicioǧlu, A., & Schiantarelli, F. (2010). Capital accumulation and growth: A new look at the empirical evidence. Journal of Applied Econometrics, 25(7), 1073–1099. doi:10.1002/jae.1163
- Collins, S. M. (1991). Saving behaviour in ten developing countries. In B. D. Bernham & J. B. Shoven (Eds.), National saving and economic performance (pp. 349–376). Chicago, IL: University of Chicago Press.
- Council for Economic Planning and Development (CEPD). (various years). Taiwan statistical data book. Taipei: CEPD.
- Curtis, C. C., Lugauer, S., & Mark, N. C. (2015). Demographic patterns and household saving in China. American Economic Journal: Macroeconomics, 7(2), 58–94. doi:10.1257/mac.20130105
- Deaton, A. (1989). Saving in developing countries: Theory and review. The World Bank Economic Review, 3(suppl 1), 61–96. doi:10.1093/wber/3.suppl_1.61
- Deaton, A. (2005). Franco Modigliani and the life-cycle theory of consumption. Banca Nazionale Del Lavoro Quarterly Review, 58, 91–107.
- Edwards, S. (1996). Why are Latin America’s saving rates so low? An international comparative analysis. Journal of Development Economics, 51(1), 5–44. doi:10.1016/S0304-3878(96)00424-5
- Ge, S., Yang, D. T., & Zhang, J. (2018). Population policies, demographic structural changes, and the Chinese household saving puzzle. European Economic Review, 101, 181–209. doi:10.1016/j.euroecorev.2017.09.008
- Gersovitz, M. (1988). Saving and development. In H. Chenery & T. N. Srinivasan (Eds.), Handbook of Development Economics (Vol. 1, pp. 381–424). North Holland: Elsevier.
- Grigoli, F., Herman, A., & Schmidt-Hebbel, K. (2018). Saving in the world. World Development, 104, 257–270. doi:10.1016/j.worlddev.2017.11.022
- Hausman, J. (1978). Specification tests in econometrics. Econometrica, 46(6), 1251–1271. doi:10.2307/1913827
- Horioka, C. Y. (1991). The determinants of Japan’s saving rate: The impact of the age structure of the population and other factors. The Economic Studies Quarterly, 42, 237–253.
- Horioka, C. Y., & Terada-Hagiwara, A. (2012). The determinants and long-term projections of saving rates in developing Asia. Japan and the World Economy, 24(2), 128–137. doi:10.1016/j.japwor.2012.01.006
- Jongwanich, J. (2010). The determinants of household and private saving in Thailand. Applied Economics, 42(8), 965–976. doi:10.1080/00036840701721067
- Kim, Y. H. (2001). The Asian crisis, private sector saving, and policy implications. Journal of Asian Economics, 12(3), 331–351. doi:10.1016/S1049-0078(01)00091-4
- Kinugasa, T., & Mason, A. (2007). Why countries become wealthy: The effects of adult longevity on saving. World Development, 35(1), 1–23. doi:10.1016/j.worlddev.2006.09.002
- Leff, N. H. (1969). Dependency rates and saving rates. American Economic Review, 59(5), 886–896.
- Levine, R., & Renelt, D. (1992). A sensitivity analysis of cross-country growth regressions. The American Economic Review, 82, 942–963.
- Lewis, W. A. (1954). Economic development with unlimited supplies of labour. Manchester School of Economics and Social Studies, 25, 1–94.
- Meier, G. M. (1984). The formative period. In G. M. Meier & D. Seers (Eds.), Pioneers in development (pp. 3–16). New York, NY: Oxford University Press.
- Modigliani, F. (1966). The life cycle hypothesis of saving, the demand for wealth and the supply of capital. Social Research, 33, 160–217.
- Modigliani, F. (1986). Life cycle, individual thrift, and the wealth of nations. American Economic Review, 76, 297–313.
- Modigliani, F., & Brumberg, R. H. (1954). Utility analysis and the consumption function: an interpretation of cross-section data. In K. K. Kurihara (Ed.), Post-Keynesian economics (pp. 388–436). New Brunswick, NJ: Rutgers University Press.
- Modigliani, F., & Cao, S. L. (2004). The Chinese saving puzzle and the life-cycle hypothesis. Journal of Economic Literature, 42(1), 145–170. doi:10.1257/002205104773558074
- Park, D., & Rhee, C. (2005). Saving, growth, and demographic change in Korea. Journal of the Japanese and International Economies, 19(3), 394–413. doi:10.1016/j.jjie.2003.12.005
- Pedroni, P. (2004). Panel cointegration: Asymptotic and finite sample properties of pooled time series tests with an application to the PPP hypothesis. Econometric Theory, 20(3), 597–625. doi:10.1017/S0266466604203073
- Perkins, D. (2013). East Asian development: Foundations and strategies. Cambridge, MA: Harvard University Press.
- Pesaran, H. (2007). A simple panel unit root test in the presence of cross‐section dependence. Journal of Applied Econometrics, 22(2), 265–312. doi:10.1002/jae.951
- Pesaran, H. (2015). Time series and panel data econometrics. Oxford: Oxford University Press.
- Poterba, J. M. (1991). Dividends, capital gains and the corporate veil: Evidence from Britain, Canada and the United States. In B. D. Douglas & J. B. Shoven (Eds.), National saving and economic performance (pp. 49–71). Chicago, IL: University of Chicago Press.
- Ranis, G. (1995). Another look at the East Asian miracle. The World Bank Economic Review, 9(3), 509–534. doi:10.1093/wber/9.3.509
- Redeker, N. (2022). The politics of stashing wealth: The decline of labor power and the global rise in corporate saving. The Journal of Politics, 84(2), 975–991. doi:10.1086/716298
- Reinhart, C. M., & Talvi, E. (1998). Capital flows and saving in Latin America and Asia: A reinterpretation. Journal of Development Economics, 57(1), 45–66. doi:10.1016/S0304-3878(98)00077-7
- Rosenstein-Rodan, P. N. (1961). International aid for underdeveloped countries. The Review of Economics and Statistics, 43(2), 107–138. doi:10.2307/1928662
- Sala-I-Martin, X. X. (1997). I just ran two million regressions. The American Economic Review, 87(2), 178–183.
- Solow, R. M. (1956). A contribution to the theory of economic growth. The Quarterly Journal of Economics, 70(1), 65–94. doi:10.2307/1884513
- Srinivasan, T. N. (1994). Data base for development analysis: An overview. Journal of Development Economics, 44(1), 3–27. doi:10.1016/0304-3878(94)00003-4
- Stiglitz, J. E. (1996). Some lessons from the East Asian miracle. The World Bank Research Observer, 11(2), 151–177. doi:10.1093/wbro/11.2.151
- Sun, C., & Liang, M. Y. (1982). Saving in Taiwan, 1953–1980. In K. T. Li & T. S. Yu (Eds.), Experiences and lessons of economic development in Taiwan (pp. 295–312). Taipei: Academia Sinica.
- World Bank (1993). The East Asian miracle: Economic growth and public policy. New York, NY: Oxford University Press.
Appendix A:
Data source, variable measurement
The estimation of the saving function is undertaken using an annual unbalanced panel data set of 12 Asian countries, covering the period 1980–2019. Bangladesh, China, India, Indonesia, Malaysia, Pakistan, the Philippines, Singapore, South Korea, Sri Lanka, Taiwan, and Thailand. Data on the saving rate for all countries other than Taiwan are compiled from the Key Indicators of Asia and the Pacific (KIAP) database of the Asian Development Bank. The KIAP database is a direct compilation of data from the official records of individual ADB member countries. In the national accounts of these countries, the data on national saving are estimated indirectly, subtracting net resource inflows (‘foreign saving’) (after allowing for changes in the holding of foreign exchange reserves) from aggregated domestic investment. Data on national saving disaggregated into private saving and public saving are available from the national data systems only for India and South Korea. For the other countries, we derived private saving by deducting government saving from total national saving. Government saving is derived as the difference between government revenue and government recurrent expenditure using data from the same data source. Any data series that is derived as a ‘residual’ from two other national account aggregates naturally incorporates possible estimation errors of the latter two magnitudes. Therefore, the use of the saving date used in the econometric analysis is based on the assumption that, in the data series for each country, the estimation errors remain consistent over the period under study. This ‘tyranny of residual is, of course, a common, and in fact, by far the worst, problem besetting the study of saving behaviour in developing countries’ (Deaton, Citation1989; Srinivasan, Citation1994).
The data on the other variables are collected or compiled from several sources. The deposit interest rate of India is compiled from the Reserve Bank of India. The data on deposit interest rates of other countries and money stocks are retrieved from the International Monetary Fund. All other data series (except for Taiwan) are extracted from the World Bank World Development Indicator database. All data series for Taiwan are compiled from various issues of the Taiwan Statistical Data Book (Council for Economic Planning & Development, Citationvarious years).
Nominal private income is converted into real terms using the consumer price index (CPI = 2010). The results are remarkably resilient to the use of the GDP deflator as an alternative price deflator. The young-age dependency ratio (YDEP) is the percentage of the population aged 15 and under relative to the working population aged 15–64. Similarly, the old-age dependency ratio (ADEP) is constructed by dividing the population aged 65 and older by the working population aged 15–64. The results are remarkably resilient to the use of the GDP deflator as an alternative price deflator. Financial deepening is proxied by broad money supply (M3) as a percentage of GNI. Social security payments are measured by the government transfer payments, including subsidies, grants, and other social benefits. The real interest rate (RID) is measured as ln[(1 + NID)/(1 + INF)], where NID is the average time deposit rate in commercial banks and INF is the current rate of inflation calculated from the CPI. All variables (except all dummy variables) are used in percentage form.
Figure 1. World’s gross domestic saving rates by major regions, 1965–2019 (%).
Source: World Bank, World Development Indicators database.
Notes: *Member countries of the Asian Development Bank (ADB); **Countries of Northeast Asia and Southeast Asia.
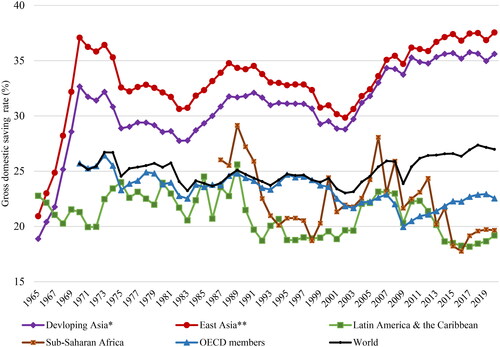
Table 1. Gross domestic saving rate (%)
Table 2. Gross national saving (percentage of GNP), 1980–2019
Table 3. Determinants of private saving (PSR)a