
ABSTRACT
Lake Tennyson’s basin and sedimentary record were assessed for multiple branches of paleoenvironmental research. A geophysical investigation of the lake depositional setting was supported by physical and chemical analysis of multiple sediment cores. The basin reaches 60 m depth and several subaerial landforms identified were likely deposited from seismic activity. Deformed sediments and turbidites in gravity cores are attributed to one or more large (pre)historic earthquakes, and episodic grain size changes in sediment cores are related to either seismic and/or climatic/meteorological processes. A hummocky slump deposit located on the western lake bed margin is linked to widespread sediment deformation that was likely caused by movement of the Awatere Fault. Radiocarbon dating constrains the most recent major deformation event between the late thirteenth century CE and mid-twentieth Century. Folded turbidites in the stratigraphy suggest multiple sedimentary deformation episodes occurred during the last millennium. Micro-XRF elemental signatures suggest proxies of past water column mixing (windiness proxy) can be reconstructed via identification of changing redox conditions. Records from Lake Tennyson show potential for several palaeoenvironmental research applications, and combining them with basin morphostratigraphy and land-based palaeoclimate and palaeoseismic evidence can enhance understanding of environmental change in the northern South Island.
Introduction
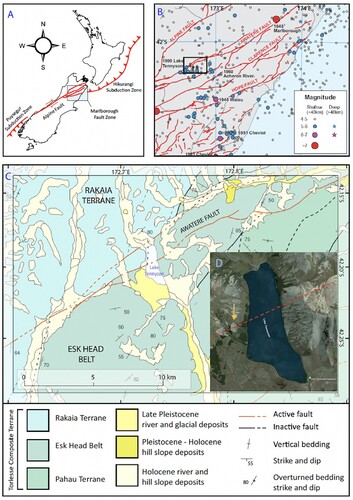
New Zealand straddles a boundary between the Pacific and Indo-Australian tectonic plates where uplift has generated mountainous topography that intersects the prevailing hemispheric westerly winds (Sturman and Tapper Citation2006). Lake Tennyson in North Canterbury is positioned uniquely near the intersection of three regional homogenous climate districts (A. Lorrey et al. Citation2007, Citation2008). The transition from the western, wetter side of the Southern Alps into the drier eastern (leeward) side of the main axial ranges makes Lake Tennyson a well-situated site for capturing changes in regional atmospheric circulation. Some of the most northerly glaciers on the South Island are located nearby (Chinn Citation2001; A. M. Lorrey et al. Citation2022) and the landscape at this site shows an extensive Late Pleistocene moraine sequence south of the lake (McCalpin Citation1992; Woolley Citation2016; Stuthridge Citation2022) that indicates it was previously glaciated at least ∼19,000-18,000 years ago. This makes Lake Tennyson a useful location for studying late Quaternary environmental changes.
In addition to ample evidence of glaciation, there are multiple splays of the Awatere Fault that cross Lake Tennyson (), with recent seismic activity expressed in minimally-modified fault scarps, fault splays, erosional scarps and landslides (). Some of these features are not well-described or mapped in detail for this site. At present, there is limited knowledge about palaeoearthquake occurrences associated with the western Awatere Fault, which is an important structure that transfers plate boundary slip from the Alpine Fault to the Marlborough Fault System. Transform fault systems within continental crust settings commonly exhibit en echelon arrays of surface rupture traces (Lodolo et al. Citation2003) like those associated with the western Awatere Fault (). Transition zones from major, linear transform fault features, like the Alpine Fault, into areas with fault complexities like the Marlborough Fault System, means registration of past and future earthquakes of differing magnitude may be complicated, but not wholly unpredictable if detailed chronologies and fault geometry details are available (Howarth et al. Citation2021). Thus, the location of Lake Tennyson, within an important transform fault boundary region, may hold evidence that can help contextualise a range of seismic episodes across the northern and western South Island.
Figure 1. Tectonic and geologic setting of the Lake Tennyson area. A, Present day tectonic setting of New Zealand showing the main structural regimes. Extent of B is shown in shaded box. B, Major faults (labelled red lines) and historic earthquakes (circles) within the Marlborough Fault System. Location of C along the Awatere Fault is indicated by thick-bordered box (modified from (Rattenbury et al. Citation2006)). C, Geologic map for the area surrounding Lake Tennyson (modified from GNS Science, 2013). D) Oblique aerial imagery of Lake Tennyson indicating the inferred trace of the Awatere Fault (dashed red line) and the location of a fresh landslide head scarp through which it passes (indicated by orange arrow). The break in tree coverage immediately below the head scarp suggests recent failure. Image accessed from Google Earth®.
In addition, the landscape around Lake Tennyson has been examined provisionally for palaeoecology (McLea Citation1996), glacial history and palaeoseismic evidence (R. McCalpin Citation1992; Mcginty et al. Citation1997; Langridge et al. Citation2016), but no studies to date have exploited the Lake Tennyson basin as a source of evidence for palaeoenvironmental change. In this study, we fill several knowledge gaps focused on understanding how the Lake Tennyson stratigraphy can be used to refine the palaeoenvironmental change history of the northern South Island region, with specific emphasis on climatic and seismic events. Our preliminary investigation focuses on lake bathymetry and seismic stratigraphy validated with detailed analysis of short sediment cores. We provide provisional interpretations of these sequences based on a limited number of radiocarbon ages, and make recommendations for future work at this site.
Here, we present the first in-depth study of Lake Tennyson’s basin architecture and stratigraphy, with an evaluation of proxy information that can be obtained from lacustrine sediments. Obtaining stratigraphy information involved acoustic sub-surface profiling and our analysis of elemental and sedimentological trends used short sediment cores taken from different parts of the lake basin. These data were used to evaluate the potential of the Lake Tennyson site for use in future paleoenvironmental studies. The rationale behind undertaking an initial investigation is that the lake bottom and subsurface sediment structure are not presently defined, but could reveal information about the nature of environmentally-driven events recorded within and around the lake such as slumps, debris flows, and glacial advances. When combined with sediment cores, sub-bottom profiles could also provide a means of correlation with the associated sediment structure observed in Compressed High Intensity Radar Pulse (CHIRP) sub-bottom surveys and linking sediment core stratigraphy across Lake Tennyson.
Study site
Geological setting of Lake Tennyson
The Spenser Mountains and St James Range are an extension of the Southern Alps ‘Main Divide’ which extends into the northern South Island. Lake Tennyson sits in the centre of this mountainous area and feeds a major catchment of the Clarence River that flows south and then east to the Pacific Ocean (). The upper Clarence River flows south for 10 km and terminates in a delta on the northern side of the lake basin, which indicates sediment input to the lake from upstream sources. The main Clarence River exits the southeast corner of Lake Tennyson over a bedrock sill underpinning incised late Pleistocene glacial deposits. It is joined by flows from other catchments to the south and west of the lake, including Princess Stream, less than 1.5 km downstream of the lake outlet. The Lake Tennyson basin intersects the Marlborough Fault System, which is influenced by several faults (McCalpin Citation1992) that link the Alpine Fault in the south with the convergent Hikurangi subduction margin to the north () (Lamb and Bibby Citation1989). The Marlborough Fault System accommodates ∼38 mm/yr of relative plate motion, mostly through oblique, dextral transpressional strike-slip motion (Yang Citation1991), and is largely accounted for by the Awatere, Clarence and Hope faults in addition to the northern Alpine Fault (Lamb and Bibby Citation1989). Numerous active faults within the region are associated with shallow earthquakes that commonly result in surface rupture (Rattenbury et al. Citation2006). A main trace of the Awatere Fault crosses directly through Lake Tennyson (), and steep, unvegetated slopes around the lake show evidence of active rock slides and sediment transport pathways.
Bedrock in the valleys surrounding Lake Tennyson is dominated by structurally-complex greywacke of the Torlesse composite terrane (Carboniferous to Early Cretaceous; (Rattenbury et al. Citation2006)). The composite basement rock at the site is locally divided by the Awatere Fault, with Rakaia terrane rocks on the northwest side of the fault and Esk Head Belt rocks (a highly deformed zone between the older Rakaia and younger Pahau terranes) to the south-east (). Lake Tennyson also fills a formerly glaciated basin located ∼10 km down-valley from the northernmost head waters of the Clarence River (Barrell Citation2011). A moraine belt that impounds the lake creates an apron of corrugated tussock interspersed with small ponds approximately 2 km to the south of the modern lakeshore. Recent work at the site has ascribed moraine emplacement between Marine Isotope Stage 4 and 2 (Woolley Citation2016; Stuthridge Citation2022), with inter-moraine sediments of late MIS2 through Holocene age (McLea Citation1996; Woolley Citation2016). There is an abundance of slope debris and fresh landslide head scarps occurring on the western confining wall of Lake Tennyson ().
Methods
Bathymetry and seismic profiling
Sub-bottom seismic profiling of the Lake Tennyson stratigraphy used a Knudsen Compressed High Intensity Radar Pulse (CHIRP) 3212 sounder connected to a 3.5 and 200 kHz transducer mounted on the side of a National Institute of Water and Atmospheric Research inland water vessel. The CHIRP sounder used the 3.5 kHz transducer to image the subsurface structure of the lake based on the differential densities of sediment layers, while the 200 kHz signal was used to image the lake bathymetry and floor (Lurton and Jackson Citation2004). A series of survey lines were recorded along and across the lake () to capture the sub-bottom structure. Detailed imaging of the upper subsurface was possible for Lake Tennyson and was used in the field as a means of identifying potential coring sites. All profile images were retrieved and processed using the PostSurvey v4.03 and SeiSee v2.22.5 software packages. Lake Bathymetry was recorded using Lowrance dual transducers mounted at the back of the vessel. A reference datum was recorded at the southeastern lake shore, and profiling of the lake began with the lake perimeter and moved inwards while recording GPS location and time/depth to the sounder.
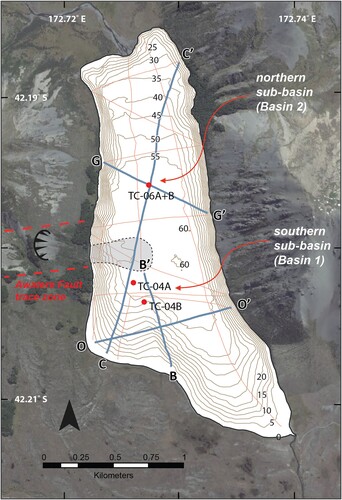
Figure 2. Bathymetric map of Lake Tennyson (5 m contour interval) overlaid on satellite imagery (accessed from Google Earth®). CHIRP profiles acquired for this study are indicated by orange lines, with bold blue lines showing traverse paths for CHIRP sub-bottom profiles discussed in text (e.g. C-C’ in ; G-G’ in ; B-B’ and O-O’ in ). Grey shaded area marks the bathymetric expression of the slump deposit discussed in text. Sediment core sample locations are indicated by red points. Locations of head scarp to the west of the lake and erosion gullies (black arrows on land) to the south are indicated on the satellite imagery. Bathymetric contours provided by Andrew Willsman (NIWA).
Sediment coring
Four sediment cores were extracted from the bottom of Lake Tennyson using a custom gravity corer with a spring-loaded valve for suction (and sediment) retention that was fabricated at the Australia National University. Two cores were taken from two distinct sub-basin sites (reaching 57-58 m depth) that were identified during the bathymetric and sub-bottom CHIRP surveys (). Cores were split in half length wise in the laboratory, scraped clean, photographed, logged and described, noting the depth and nature of stratigraphic boundaries, sediment texture, structure, colour and colour changes throughout the cores. The presence of macroscopic organic material and charcoal was also noted and samples were selected for radiocarbon dating. Magnetic susceptibility was also measured, but did not show additional detail beyond what was gleaned from grain size and core chemistry. As such, it is not discussed further.
Sediment properties of cores
Loss on ignition
Loss-On-Ignition (LOI%) was undertaken as a rapid guide to sediment organic matter content and indicator of catchment erosion (Evans et al. Citation2019). LOI was measured for three of the Lake Tennyson cores (TC-06A, TC-06B, and TC-04A) with samples collected as 1 cm-thick sequential slices, placed in pre-weighed aluminium trays and dried in an oven overnight at 100 ̊C. Samples were allowed to cool in a desiccator before the combined dry weight of the sediment and tray in grams was recorded to four decimal places. Samples were then combusted at 550 ̊C for 4 h, cooled, and reweighed. Tray weights were deducted from both measurements and the percentage weight loss following combustion was then calculated.
Grain size
Grain size analysis was performed on two of the Lake Tennyson sediment cores (TC-04A and TC-04B) as an indicator of sediment influx events (Evans et al. Citation2019). Subsamples were 1 cm thick, approximately 2 cm3 in volume, and taken at 2 cm intervals throughout the cores. All samples were treated with 10% H2O2 overnight to remove colloidal organic material, washed via repeat centrifugation with MilliQ water to remove H2O2 residues. Subsequently, 25 ml of 0.55% sodium hexametaphosphate (Calgon) was added to the sample residues, which were thoroughly mixed using a vortex mixer and left overnight to fully disperse the colloidal fraction of the sediment. Immediately before grain size measurement, samples were sonified, mixed again in a vortex mixer and a pipette was used to extract the sediment/Calgon mixture from the centrifuge tubes for transfer to a Malvern Mastersizer2000 laser particle size analyser for particle size measurement in the School of Environment, The University of Auckland.
Bulk carbon, nitrogen and sulphur concentrations
Stratigraphic variations in total organic carbon (TOC), total nitrogen (TN) and the ratio of TOC/TN were explored to identify changes in organic matter (OM) sources relating to aquatic and terrestrial paleoproductivity (Augustinus et al. Citation2011; Meyers Citation1994; Stephens et al. Citation2012). The surrounding bedrock lithologies () and paedology composition makes inorganic carbon contributions to the lake unlikely at this site. One core (TC-04A) from Lake Tennyson was analysed for TOC, TN, and TOC/TN. Subsamples of 1 cm thickness were taken at 2 cm intervals. The amount of sediment sampled generally weighed 2-4 g, which was considered sufficient based on OM content inferred from loss on ignition (LOI) measurements. All subsamples were oven dried at 60 ̊C overnight and ground to powder using an agate mortar and pestle. Prior to measurement, 0.1 g or 0.2 g of powder was wrapped in an aluminium foil parcel. Sediment TOC and TN percentages were then measured using a LECO TruSpec CNS analyser in the School of Environment, University of Auckland. TOC/TN mass ratios were calculated from elemental weight percent TOC and TN in sediment samples, and multiplied by 1.167 to convert those values to atomic ratios. The latter were used to examine relative changes in organic matter provenance (Meyers and Teranes Citation2002; Stephens et al. Citation2012). Total Sulphur (TS) was also measured in core TC-04A and also TC-04B. Sample preparation for TS analysis was identical to that of the Carbon and Nitrogen method although ceramic trays were used in place of foil encapsulation, with TS measurements conducted on the University of Auckland LECO TruSpec CNS analyser.
The TruSpec C, N, and S elemental analyser was calibrated to laboratory standards (EDTA [40.99% C; 9.57% N]) and coal [1.14%S] to ensure accuracy. All samples were corrected for analytical drift (1 in 20 samples) to ensure sample precision (0.01% in C and N, and 0.0002% in S). The limit of determination (6 SD) for elemental Carbon is +/−0.0031%, Nitrogen is +/−0.2528% and Sulphur is +/−0.0192%. Following every ninth sample in a set, a repeat of the first sample was run to ensure reproducibility and check for system drift. Between sets of 10 sample measurements, blanks and calibration standards were run and a drift correction applied. See Appendix for more details about environmental interpretations from these chemical proxies.
Micro-XRF elemental chemistry
Trace element profiles from cores TC-06A and TC-06B were measured using an ITRAX (Cox Analytical, Sweden) micro-XRF elemental core scanner at Australia’s Nuclear Science and Technology Organisation (ANSTO), Sydney. The µ-XRF core scanning records down-core elemental variability in the Al to U atomic weight range (Croudace et al. Citation2006; Croudace and Rothwell Citation2015) providing insights into changing sources of sediment influx (and associated environmental processes) as well as changes in redox conditions and biological production (Davies et al. Citation2015). A subset of elements that are typically employed to indicate environmental changes (Imboden and Wüest Citation1995; Cohen Citation2003; Kylander et al. Citation2011; Peti and Augustinus Citation2022) were selected to evaluate allochthonous and autochthonous contributions to the lake.
The µ-XRF data were acquired from cores TC-06A and TC-06B using a Mo X-ray tube (at 30 kV, 55 mA), with 1-mm spatial separation between measurement points (to capture elemental variations in laminations observed within the cores), and measurement duration of 10 s per step. Optical images (47-µm resolution), X-ray density images (200-µm resolution), and magnetic susceptibility were also acquired during the same scanning process. Elemental profiles were plotted for various elements using Itrax-PLOT data presentation software.
All Micro-XRF elemental data were smoothed using a 9-pt running mean for clarity of presentation, with optical and radiograph images used in conjunction to identify the stratigraphic position of geochemical fluctuations at mm-scale. Itrax-µ-XRF core scanning elemental data were produced as counts per second (cps) and normalised to incoherent scattering (equivalent to Compton scattering) which allowed improved comparison between elements while minimising the effects of water and organic matter (Kylander et al. Citation2011; Marshall et al. Citation2011; Berntsson et al. Citation2014; Peti and Augustinus Citation2022). The elemental profiles were also normalised to Ti (a robust indicator of detrital sediment influx (Kylander et al. Citation2011; Davies et al. Citation2015)).
The ratio of Mo incoherent (inc) to Mo coherent (coh) scattering ratio (inc/coh) is inversely proportional to the mean atomic weight, and can be used as a proxy for organic matter (OM) content (e.g. Guyard et al. Citation2007; Burnett et al. Citation2011; Jouve et al. Citation2013; Woodward and Gadd Citation2019). The elements Sr and Zr can be linked to coarser grain size fractions, hence higher Sr/Ti and Zr/Ti ratios can be interpreted as indicators of increasing grain size and catchment erosion (Kylander et al. Citation2011; Peti and Augustinus Citation2022). Increases in the Si/Ti ratio are a commonly used indicator of heightened biogenic silica production related to diatom productivity. However, that ratio can also be interpreted in terms of silica sand influx (Davies et al. Citation2015; Evans et al. Citation2019; Peti and Augustinus Citation2022).
Radiocarbon dating
Five terrestrial macroscopic organic samples were collected from the Lake Tennyson sediment cores to constrain sedimentation rates and provide a temporal context for the constructed proxy records. Three of these samples were positioned within folded sediment layers in core TC-06A to acquire minimum ages for observed soft sediment deformation. In addition, four bulk sediment samples were taken from higher, non-deformed layers within cores TC-06A and TC-06B (where no macroscopic organic material was identified) to further constrain the timing of event layers identified through the cores. All lake core geochronology samples were prepared at the Waikato Radiocarbon Dating Laboratory and measured by AMS at the University of California, Irvine. Organic samples submitted for dating consisted of wood, charcoal, reed, leaves/leaf fragments and rootlets collected from the sediments with tweezers. Bulk sediment samples in the lake cores were collected as 1 cm-thick slices with the outer rim removed using a scalpel and stainless steel spatula to avoid core edge contamination. All conventional radiocarbon ages were calibrated and transformed into calendar age ranges at the 95% confidence interval using the Calib8.2 online calibration tool (Stuiver and Reimer Citation1993) using the SHCal20 Southern Hemisphere calibration curve (Hogg et al. Citation2020). Calibrated ages are presented as cal. yr BP.
Results
Geophysical characteristics of the Lake Tennyson basin
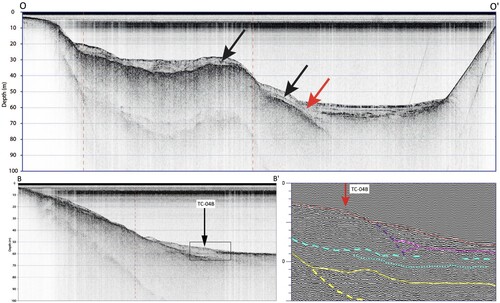
Lake Tennyson bathymetry shows that the lake floor slopes gently toward the centre from the north and south, while much steeper slopes bound the east and west lake margins (). The 55 m bathymetric depth contour protrudes in from the western edge toward the middle of the lake, and it outlines a toe slope of a slump or slide deposit situated immediately east of the distinct scarp on land that is associated with the Awatere Fault trace (B; ). This distinct bathymetric feature divides the centre of the lake into two sub-basins which were targeted for sediment coring ().
The nature of the Lake Tennyson basin fill was defined using 15 CHIRP profiles (see ). A CHIRP profile down the long axis of the lake ( and ) shows key sedimentary features within the basin stratigraphy that can be linked to subaerial bathymetric features. The most pronounced feature is a ∼6 m high by ∼200 m wide hummocky deposit, which is the same feature that is outlined by the 55 m contour that protrudes from the landslide scarp located on the western lake edge (). This feature extends toward the lake centre and away from the scarp (). A close examination of this sub-bottom profile () revealed an internal, low amplitude, semi-chaotic seismic facies extending away from the hummocky mound in all directions under the upper sediment packages in both sub-basins to the south and north (Basin 1 and Basin 2, respectively). Chaotic reflections in the stratigraphy were not limited to the sediment immediately surrounding the hummocky deposit and can be observed at positions up to 400 m distal (), suggesting that the event responsible for the sediment deformation was recorded lake-wide.
Figure 3. (top) Overview CHIRP imagery for the south to north trending profile showing the main structural features of Lake Tennyson described in text. Bathymetric map in shows path traversed to acquire this imagery as well as core sample locations. The hummocky deposit occurs where the 50 m contour protrudes into the centre of the lake and intersects the traverse line. Red box shows extent of imagery enhanced in the bottom panel. Dashed red lines indicate where cross sections seen in , top (right red dashed line) and , bottom (left red line) and intersect this profile. Thick black arrows indicate coring locations. (bottom) Enhanced CHIRP imagery for the hummocky deposit seen in the top panel (extent marked by red box). Internal structure of the deposit has a chaotic signal which extends to the basins to the north and south. Overlying the chaotic seismic facies in both basins are horizontal layers ranging between 0.75 and 1 m thickness. Red arrow indicates coring location.
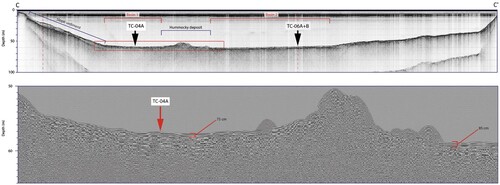
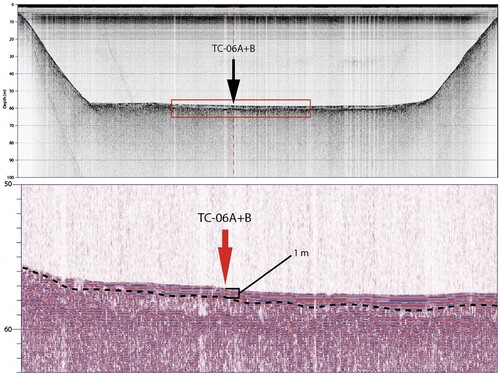
Basin 1 (south of the hummocky deposit; ) has a minimum depth of ∼51 m and is ∼260 m wide (from north to south). The upper 75 cm of sediment in this sub-basin is characterised by continuous, horizontal low amplitude reflectors representing a thin, layered sediment sequence mantling a chaotic seismic facies (). Horizontally layered sediment in this sub-basin can be traced to the north, where it appears to be draped over the lower gradient southern portion of the hummocky deposit, thus postdating the emplacement of the hummocky deposit (). A similar relationship can also be seen where the horizontal sediment sequence drapes over a thick package of lope sediment located south of Basin 1 (). Basin 2 extends 550 m north of the hummocky deposit and has an average depth of 58.5 m ( and ). A similar thin veneer of horizontally bedded sediment 75-95 cm thick overlies the chaotic facies in this basin ( and ).
Figure 4. (top) CHIRP imagery which extends across Basin 2 of Lake Tennyson. Location of traverse line is shown on . Red box shows extent of enhanced imagery presented in lower panel. Black arrow indicates coring location. Dashed red line indicates location where the CHIRP imagery from the top panel of crosses this traverse. (bottom) Enlarged and enhanced CHIRP imagery showing 1 m thick horizontally layered sediment overlying sediment with a chaotic structure (separated by dashed line) at a distal position relative to the hummocky deposit. Red arrow indicates coring location.
A large, 5-7 m thick sediment package at the southern end of the lake pinches out toward the lake shore ( and lower left panel of ). Inferred sedimentary features apparent from the seismic facies are chaotic, but this package extends beneath the upper sediments of Basin 1 (characterised as slope sediment; ). Based on the location of the CHIRP profiles that define this slope sediment package relative to the drainage gullies that cut through moraines circumscribing the southern margin of the lake (southwest of the lake; ), it likely represents eroded, reworked material deposited on the lake margin which subsequently slumped toward the basin. This slumped material extends beneath the thin upper horizontally layered sediments ( and ) that cover the complete slope sediment package at the site of core TC-04B (). The slope sediment package reflections are internally chaotic and cannot be differentiated from the (chaotic) signal extending south from the hummocky deposit using CHIRP imagery (; ). Strong reflectors within the inferred slump deposits suggest that two phases of slumping/sediment redistribution may have occurred ().
Figure 5. (top) CHIRP imagery across the thick sediment deposit on Lake Tennyson’s southern margin. shows the location of the traverse path. Black arrows point to a strong internal reflector within the overall structure indicating two phases of sediment emplacement. Red arrow points to upper boundary of the thick slope deposit where it extends beneath the upper horizontal sediments. Vertical dashed red lines mark locations at which and the lower left panel of this figure intersect this cross-section. (bottom left) CHIRP imagery showing the thick deposit of sediment on Lake Tennyson’s southern slope. shows traverse path for imagery. Black-bordered box indicates extent of enhanced imagery in the lower right panel. Dashed red line marks location at which the image in the top panel intersects this cross-section. Black arrow indicates location of core TC-04B. (bottom right) Enhanced CHIRP imagery from the bottom left panel (extent indicated by black-bordered box) showing the internally chaotic structure of the thick slope deposit. Above the dashed red line, an upper layer of bedded sediments (50 cm thick) parallel to the slope overlies the thick deposit. Note that the enlargement of CHIRP facies around TC-04B (lower right) displays evidence for multiple depositional events and sedimentation phases.
Sediment cores
Stratigraphy
Two cores were extracted from each of Basins 1 and 2 (). The general stratigraphy of the upper sediments (<50 cm depth) of both basins appears similar with greyish-brown horizontally laminated muds dominant. Laminations were on the order of millimetre to multi-millimetre thick, alternating between dominantly silt with fine clay bands. A dark grey massive clay layer ∼2-4 cm thick was observed in all cores providing an important correlation tie point (). Despite being positioned on the toe slope of the slump (), the clay layer was still present in core TC-04B (). The CHIRP imagery indicates that the upper 50 cm of the sediment record at this location correlates with the horizontal layers observed in Basin 1 (B).
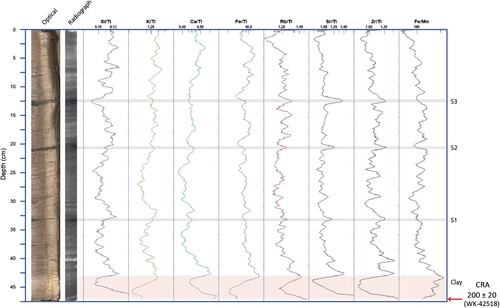
Figure 6. Summary logs and positions of radiocarbon samples for the Lake Tennyson sediment cores. Bathymetric map indicates coring sites. Radiocarbon dates are shown as conventional radiocarbon age (CRA) with the associated lab identifier, and their calibrated range can be found in as cal. yr BP at 2σ from the SHCal20 curve (Hogg et al. Citation2020) as produced in Calib8.2. Ages marked * indicate samples measured using bulk carbon AMS. Arrow points to distinct interface between folded and horizontal layers in TC-06A. Dashed lines represent inferred correlation between cores based on the stratigraphic context of sediment layers (see text). Correlated sand layers in TC-06A and TC-06B are labelled S1 – S3.
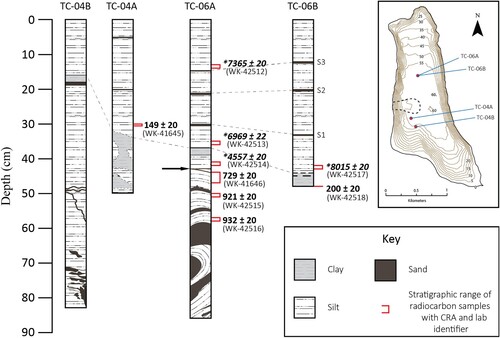
Distinct fine to very-fine sand bands ranging from 1 mm to 10 mm-thickness were present in all of the Lake Tennyson cores, often displaying abrupt upper and lower contacts. In cores TC-06A and TC-06B, the same three layers were identified and correlated (labelled S1 – S3, ). Normal grading within the sand layers and sharp lower contacts at the base of these layers were observed. The lake sediments displayed soft sediment deformation in cores TC-06A and TC-06B a few cm below the massive clay marker layer. This deformation was most obvious in core TC-06A (from Basin 2) where isoclinal folding of at least ∼30 cm of sediment at the bottom of the core was observed (). CHIRP imagery across Basin 2 indicates that ∼1 m of horizontally bedded upper sediments are underlain by a chaotic facies ( and ), with the thickness of planar bedded, undisturbed layers appearing to be laterally variable across the basin. Disruption of stratigraphy in the lower part of the TC-06A core is observed from optical and radiograph images obtained during the µ-XRF core scanning, showing a disrupted sedimentary fabric below 42 cm depth, with multiple breaks in sedimentary layering, and undisturbed laminations above that depth (Figure 8) at the approximate centre of Basin 2 ( and ). Core TC-04B, positioned on the toe of the slope sediment (, bottom), shows soft sediment deformation in the form of sand lenses between 65 cm depth and the core base as well as thin (1-2 mm thick) wavy sand layers at ∼ 50 cm depth (). Deformation was observed within lower half of core TC-04A (including the distinct clay unit; ), however some mobilisation of fluidised outer-core sediments was noted during core collection in the field.
Grain size
Grain size in the Lake Tennyson sediment cores were quantitatively measured for TC-04A and TC-04B, whereas grain size changes are only qualitatively noted and described using sediment core logs TC-06A and TC-06B (). In general, core TC-04A showed variable sand and silt concentrations. The clay layer common to all cores was marked by two clay peaks in TC-04A at 34.5 cm depth and 40.5 cm depth separated by a rise in silt concentration (). The upper thin sand layers in the stratigraphic column in TC-04A registered only as minor sand percentage increases. Two additional minor sand layers located slightly above the clay layer at 24.5 cm depth and immediately below it at 48 cm depth in TC-04A ().
Figure 7. Analyses run on cores TC-04A (top), TC-04B and TC-06A(bottom). Summary stratigraphic log is shown with depth scale to the left, with grain size presented for TC-04A and B. Loss-on-ignition (LOI) was run for all cores, while Sulphur was only run for TC-04A and B. Total organic carbon (TOC), total nitrogen (TN), and carbon/nitrogen ratio (TOC/TN) for core TC-04A are also presented. Blue shaded area of TOC/TN indicates ratios between 4 and 10, indicative of aquatically-sourced sedimentary organic matter. Red marker to right of diagrams shows the stratigraphic range and position of radiocarbon samples. Radiocarbon dates are shown as conventional radiocarbon age (CRA) with the associated lab identifier, and their calibrated range can be found in as cal. yr BP at 2σ from the SHCal20 curve (Hogg et al. Citation2020) as produced in Calib8.2.
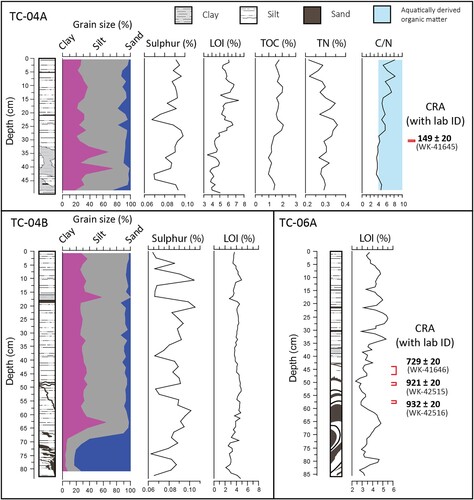
The grain size profile for TC-04B revealed similar variability in sand content to TC-04A throughout the upper 64 cm, with values ranging from 0 to 15% (). Below this depth, sand content in core TC-04B abruptly increased from 3 to 83% corresponding with the deformed, lower sand layers. Changes in the relative abundance of silt and clay explain the majority of the variation in mean grain size above 64 cm depth (). Two abrupt increases in clay relative to silt were observed at 16.5 and 62.5 cm depth in core TC-04B. The uppermost of these clay spikes are positioned within the distinct clay layer recognised in all cores (). The lowermost clay spike was observed within the lower deformed sediments of core TC-04B.
Organic matter geochemistry and loss-on-ignition
TOC % was low throughout core TC-04A, with values varying between 1.0 and 2.1%. Organic matter content variability is best seen in LOI %, which was measured at 1 cm resolution. LOI % and TOC % are lowest through the clay layer at the core base and increase throughout the upper 32 cm of the core (). In core TC-04B, LOI % is similar through and above the clay layer (0-17 cm depth; ). LOI % values below this layer are consistently low with a minimum of 2.1% recorded in the deformed sands near the core base (). Core TC-06A displayed large decreases in LOI% over sandy layers and considerable variation through the folded sediment layers (). TN % values in core TC-04A were also low, ranging between 0.1 and 0.4% (). The associated TOC/TN ratio through this core was mostly between 3.5 and 8 (). Elemental Sulphur values observed in TC-04A and TC-04B were also low, with values not exceeding 0.1% ().
Micro-XRF elemental chemistry
A subset of elements from the µ-XRF scanning of cores TC-06A and TC-06B were chosen based on their common application in paleolimnological studies (e.g. Kylander et al. Citation2011; Liu et al. Citation2014; Davies et al. Citation2015). Correlation matrices were used to evaluate the strength of all relationship pairings. For core TC-06A, the correlation matrix was only constructed for the undeformed upper 40 cm to avoid ‘double-counting’ of folded lower sediments. Correlation results (Table 2) show that K, Ti, Fe, and Mn all had strong positive relationships with each other, suggesting an association with detrital input (Kylander et al. Citation2011). The matrices revealed that Si (a common element in silicate rocks such as greywacke) was only moderately correlated with these elements and was more aligned with Ca (suggestive of a biological origin, possibly from lacustrine diatoms).
Chemostratigraphy of the undeformed sediments above the clay layer in both TC-06A and TC-06B can be correlated (Figures 8–11); however, elemental profiles below the clay layer were not interpreted due to the deformation of the sediment. Detrital elements K, Ti, and Fe show almost identical signals to Si, Ca, and Rb ( and ). Sr and Zr (associated with coarser grain sizes) deviate from this pattern generally showing relative enrichment through the sand layers while other elements exhibited depletion. Through the distinct sand layers (; s1, s2, and s3), the inc/coh ratio dropped to lower values while Sr, which has a strong sand affinity, increased. There is a close correlation of Fe with Mn (Table 2) and both series can be directly compared with Fe/Ti to assess sediment and lake bottom water redox state, taking advantage of the increased solubility of Mn relative to Fe under reducing conditions (Davison Citation1993; Davies et al. Citation2015). Many peaks in Fe/Ti align with peaks in the Fe/Mn ratio ( and ) suggesting that minerogenic sediment input of Fe and Mn is the dominant control on that ratio rather than bottom water oxia/anoxia (Davison Citation1993). More work to monitor Lake Tennyson at different depths through the year is required to substantiate this interpretation.
Figure 8. Micro-XRF core scanning data for core TC-06A. All elemental data is normalised to incoherent scattering (inc). Dashed line indicates depth below which sediments are deformed. Radiocarbon dates are shown as conventional radiocarbon age (CRA) with the associated lab identifier, and their calibrated range can be found in as cal. yr BP at 2σ from the SHCal20 curve (Hogg et al. Citation2020) as produced in Calib8.2.
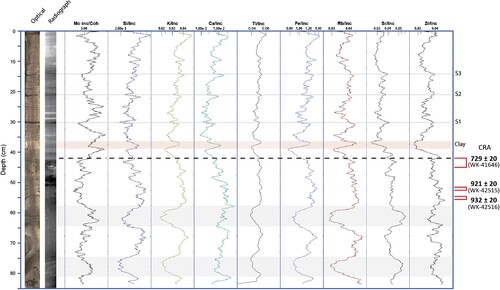
Figure 9. ITRAX-XRF data for core TC-06B. All individual elemental data is normalised to incoherent scattering. Radiocarbon dates are shown as conventional radiocarbon age (CRA) with the associated lab identifier, and their calibrated range can be found in as cal. yr BP at 2σ from the SHCal20 curve (Hogg et al. Citation2020) as produced in Calib8.2.
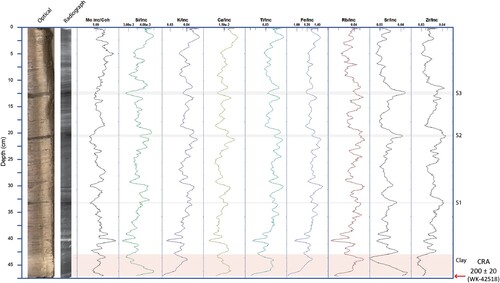
Figure 10. Ti-normalised elemental data and the Fe/Mn ratio for core TC-06A. Dashed line indicates depth below which, sediments are deformed. Radiocarbon dates are shown as conventional radiocarbon age (CRA) with the associated lab identifier, and their calibrated range can be found in as cal. yr BP at 2σ from the SHCal20 curve (Hogg et al. Citation2020) as produced in Calib8.2.
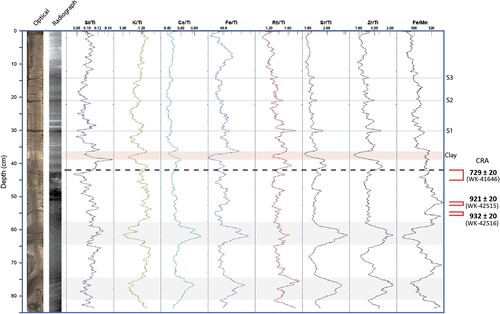
Figure 11. Ti-normalised elemental data and the Fe/Mn ratio for core TC-06B. Radiocarbon dates are shown as conventional radiocarbon age (CRA) with the associated lab identifier, and their calibrated range can be found in as cal. yr BP at 2σ from the SHCal20 curve (Hogg et al. Citation2020) as produced in Calib8.2.
Radiocarbon ages
Results from five macroscopic organic samples and four bulk sediment subsamples from the Lake Tennyson cores are presented in and (ages calibrated using SHCal20; Hogg et al. Citation2020). The youngest 14C date comes from macroscopic organic material (bark) in horizontally laminated silts from core TC-04A and is dated to 149 ± 20 14C y BP (). This laminated silt package is stratigraphically higher than an inorganic clay layer common to all cores (). A leaf (Fuscospora cliffortioides) sampled from the base of the clay layer in TC-06B () provided a young post-deformation age of 200 ± 20 14C y BP. The uppermost macroscopic organic sample in TC-06A was positioned near the top of the deformed sediments () and returned an age of 729 ± 20 14C y BP. Organic samples below that date returned ages of 921 ± 20 and 932 ± 20 14C y BP, with mean age increasing with depth (). Bulk organic samples from TC-06A and TC-06B produced much older 14C ages than those from the macroscopic organics, with ages ranging from 4,557 ± 20–8,015 ± 20 14C y BP (), despite being stratigraphically positioned in younger sections of the core ().
Table 1. Radiocarbon sample details and results for macroscopic organics and bulk sediment samples from the Lake Tennyson sediment cores. The asterisk indicates a calibrated age that overlaps with the modern part of the calibration curve (post 1950 CE). All calibrations undertaken with Calib8.2 and the SH20Cal curve.
Discussion
The aim of our investigation was to evaluate the potential of the Lake Tennyson basin sedimentary record for use in future paleoseismic and paleoenvironmental studies. Consequently, we now consider the importance of the preliminary geophysical, stratigraphic and sedimentological records with respect to paleoseismicity and palaeoclimatology applications.
Lake sediments can represent important sources of information relating to climatic variability and catchment-scale dynamics (Cohen Citation2003; Davies et al. Citation2015). At Lake Tennyson, the potential of the sediment record in this context is limited by the short duration covered by the undisturbed upper portion of the sediment cores. The undeformed sediments only represent the last few hundred years, but this part of the sequence is potentially useful for analysing annual to decadal climate variability. Climate reconstructions at this resolution are hindered by the paucity of age control and also a lack of understanding about modern seasonal rainfall and sedimentation traits linked to potential thresholds for creating laminations of a given thickness and/or with certain grain size traits and lake sediment chemistry (see section on micro XRF chemostratigraphy). Future work should consider undertaking detailed in situ monitoring of local meteorology and river flows into the lake, with a simultaneous deployment of sediment traps and subaqueous current monitoring in a similar fashion to what has been done for calibrating palaeoclimate records at other Southern Alps lake sites (Roop et al. Citation2016). Despite current limitations of interpreting stratigraphy and sedimentology, a range of useful proxies were identified from the output of the µ-XRF core scanning that could be applied to understand short-term responses of the catchment to hydroclimatic conditions and seismic events.
Paleoseismic potential
The post-glacial sediments infilling Lake Tennyson are well suited to reconstruction of past seismic events that impacts on the basin sediments and associated landforms. A general pattern of age reversal was observed for bulk organic samples that were 14C dated relative to selected macrofossils from the Lake Tennyson cores (). This pattern may be explained by the incorporation of older carbon (e.g. relic carbon from older organic deposits) into younger sediments via catchment erosion and in-wash as the lake sediments were observed to be highly inorganic. As such, we have elected to focus development of the stratigraphic age model using only the AMS 14C ages on the macroscopic organic samples. Correlations of the core stratigraphy enabled by the CHIRP survey indicate the most recent centuries in the past millennium are well represented by an undisrupted upper stratigraphic sequence at Lake Tennyson. A seismic event is presumed to have caused a soft sediment deformation event after the late thirteenth Century CE (see WK-41646 in Core TC-06A; ). Additional ages are needed to constrain the timing (maximum age) of this inferred co-seismic event.
The large hummocky deposit encountered in the CHIRP subsurface imagery () is likely the product of a subaerial landslide derived from the erosional scarp on the western side of the lake that is cut by the Awatere Fault (). The chaotic seismic facies in the CHIRP imagery (inferred to be a hummocky landslide deposit), as well as the inferred slump deposits located on the southern slope of the lake, extend in all directions and beneath the upper horizontal layers observed in Basins 1 and 2 (, and ). This suggests that a major event that caused lake-wide soft sediment deformation occurred within the last ∼650 years.
The deformation inferred from the CHIRP imagery is supported by observations made from the sediment cores (isoclinal folding in core TC-06A; ) that correlate to depths of the chaotic seismic facies (). Consequently, the chaotic seismic facies and deformed basal core sediments are interpreted as co-seismic slumps associated with the large landslide event apparent in and . Observations of similar folded sediments and chaotic facies in the CHIRP profiles have been attributed to a seismic trigger in a range of studies of this type (Shilts and Clague Citation1992; Chapron et al. Citation1999; Schnellmann et al. Citation2002). Whether or not a single event is represented by the slump deposits imaged beneath Basins 1 and 2 is uncertain, and more detailed evaluations of the CHIRP facies and boundary delineations between units will help clarify this issue. Nevertheless, the distinct stratigraphic boundary within the slumped sediment on the southern slope () suggests there may be at least two co-seismic events represented in the stratigraphy. Additional and deeper targeted lake sediment coring is required to properly assess the proposed connection between the chaotic seismic facies and soft sediment deformation events.
The hummocky landslide deposit () provides an important clue to the seismic-event source. As indicated in , the Awatere Fault runs directly through the associated erosional scarp on the western lake edge. It would follow that a rupture along this fault zone could have caused the shaking event responsible for subaqueous slumping, soft sediment deformation and landsliding apparent in the CHIRP images and associated sediment cores. The timing of the co-seismic event which caused the soft sediment deformation observed in core TC-06A and the associated CHIRP imagery, is constrained by radiocarbon ages. The pre-deformation age of 729 ± 20 14C y BP (approx. 1280-1318CE and 1356-1384CE; ) was obtained from the upper limit of the folded sediment in core TC-06A while the age of 200 ± 20 14C y BP (range of calibration outcomes between mid-1600s to modern; see ) was obtained from undeformed sediments in the adjacent core (TC-06B) which can be correlated via the clay layer (). There may be an unconformity associated with the seismic event that majorly deformed the lake sediments below 45 cm depth. The reversed sequence of 14C ages on bulk sediments above that horizon, which are excluded from our age modelling, also suggests that progressive sloughing of older sediments with relic organic material in the catchment around the lake may have occurred after this seismic episode. Nevertheless, the timing of this palaeoseismic event overlaps with previously identified evidence on the Awatere Fault (McCalpin Citation1996), where further age control is also needed.
In addition to the mass slumping event, episodic sand influx (s1 to s3; ) in the undeformed sections of the core (see ) may represent seismically-triggered turbidites (Howarth et al. Citation2014). The sharp lower stratigraphic contacts observed at the base of some of these sand layers supports this interpretation. The absence of better age control through these sections of the cores, however, does not allow for robust dating and correlation of inferred co-seismic events lake-wide, or for determining if erosion of older sediments occurred when coarser sand layers were deposited. It is possible that the sand layers relate to aseismic processes such snow/debris avalanches on the steep valley walls, and/or flood events. To make any further inferences relating to these event layers in that type of context would require correlation with lakes from nearby catchments to determine if they are locally or regionally expressed. Nevertheless, a transect of cores from north to south across the fault that cuts across Lake Tennyson would be a good starting point for replicating the signatures we have identified. In addition, improved chronologies that tie contemporary sedimentary structures to well-dated, known-magnitude seismic episodes (Mcginty et al. Citation1997) would help establish the thresholds for ground motions required to generate lacustrine turbidites and sand influx layers at this site.
Potential of lake sediments to detect catchment erosion, biological variability and environmental change in North Canterbury
Major and trace elements in the sediments at Lake Tennyson exhibited high-frequency variability above the clay layer in cores TC-06A and B (<200 ± 20 14C y BP). These signals may capture annual to decadal variability associated with sand influx events (matching the geochemical anomalies highlighted in and ). However, the absence of a robust chronology for the sediment records does not allow further refinement of the timing (or cause) of the inferred events. The sparsity of macrofossils indicates the need for further sediment cores to obtain sufficient 14C-datable material for robust age model development. Given that the CHIRP stratigraphy can be traced laterally across Lake Tennyson also means that the development of a composite core-based chronology, supported by cross correlation of core stratigraphy, would be advantageous for extending and refining environmental change proxy records at this site.
Normalised µ-XRF elemental counts peak in association with sand layers in the cores are reduced in concentration through the lower clay layer ( and ). Counts of Si also decreased relative to Ti through most of the sand layers. This is important because Si is one of the major elements in the surrounding greywacke bedrock. Thus, decreases in Si associated with catchment-derived episodic sand layers indicate that there is likely a strong biogenic signal which is being diluted across sand influx events. The inc/coh ratio generally exhibited an inverse profile to detrital elements such as K and Ti ( and ). It is therefore likely that organic matter concentration is controlled by dilution due to the influx of lithogenic sediment derived from the catchment rather than by climate-related biomass production.
The close correlation of Fe with Mn () suggests that they may be controlled by redox processes (Davison Citation1993; Cuven et al. Citation2011). The Fe/Mn profiles in and can be compared with Fe/Ti to assess sediment and lake bottom water redox state, taking advantage of the increased solubility of Mn relative to Fe under reducing conditions (Davison Citation1993; Davies et al. Citation2015). Many peaks in Fe/Ti align with peaks in Fe/Mn suggesting that minerogenic sediment input of Fe and Mn is the dominant control of that ratio (Davison Citation1993). However, the relationship between Fe/Ti and Fe/Mn appears to couple and decouple throughout the elemental profiles (, ) suggesting that both detrital sediment input and the lake bottom water redox state may have affected the Fe/Mn ratio to different degrees at different times during lake history. More monitoring work of Lake Tennyson throughout the year is required to interpret those proxies.
Table 2. Cross correlation results of selected µ-XRF derived elements from Lake Tennyson cores. Strong correlations are noted for TC-06a series meeting or exceeding a p-value threshold of 0.05 (95% confidence interval).
Muds in the Lake Tennyson cores are highly minerogenic as indicated by low TOC% and LOI% (). The associated TOC/TN ratios through TC-04A were mostly between 3.5 and 8%, with occasionally lower values that suggest the small amount of organic matter present in the sediment was mostly of aquatic origin (). Most of the µ-XRF core scan elemental signals evaluated in this study were also observed to co-vary, and the elemental relationships were largely indicative of minerogenic inputs to the lake (, ). In particular, the covariance of K, Fe, Rb, Sr, Zr, and Ti indicates that allochthonous sediment influx, rather than authigenic processes, is the factor controlling the lake sediment geochemical signature, most likely as a response to variations in sediment grain sizes (which tend to have individual elemental affinities) (Kylander et al. Citation2011). This suggests that catchment erosion and subsequent in-wash dominate the elemental geochemical records. Considering the catchment setting, this may relate to variations in snow melt, and/or precipitation (in addition to co-seismic erosion pulses).
Although many of the peaks in Fe/Mn aligned with those in Fe/Ti, this relationship was not consistent as these ratios were observed to couple and decouple throughout the cores ( and ). This suggests that lake bottom waters were variably oxygen-rich and oxygen-depleted, whereby reduced conditions drove increased Mn mobility relative to Fe (Davies et al. Citation2015; Peti and Augustinus Citation2022). Periods of higher Fe/Mn may therefore reflect periods of reduced wind-driven mixing and a stable thermocline, whilst reduced Fe/Mn events infer increased wind-driven mixing (Rothwell et al. Citation2006; Haberzettl et al. Citation2007; Davies et al. Citation2015). Further work should be undertaken to ascertain the veracity and paleoclimatic significance of these inferred changes in in-lake processes in association with development of a well-resolved chronology of the cores before robust paleoclimatic inferences are made from these high-resolution elemental records.
Glaciolacustrine laminated silts and clays with fine sand stringers have been exposed in terrestrial excavations we undertook in front of and behind ridges of beach gravels along the Lake Tennyson southern shoreline. This sediment extends under the modern gravel beach and berm facies, and it underpins peat deposits that occasionally exceed 1 m thickness with minimum ages of early Holocene/late glacial age at the glaciolacustrine sediment/peat contact. Drop stones in the laminated glaciolacustrine sediments indicate that this part of the Lake Tennyson stratigraphy is glacial in origin and likely captures ice recession from the basin. Within the palaeolacustrine sedimentary sequences exposed on land, there are microscale soft sediment deformation features (e.g. overturned folds of cm-scale) with axial hinges orientated parallel to the long axis of the lake (and perpendicular to the strike of the Awatere Fault). Visual observations of the bathymetry and exposed sediments in the shallow water reach along the western half of the southern lake shore suggests this glaciolacustrine sequence may be laterally continuous for at least several hundred metres. Short cores and sediment exposures conducted along the shoreline show the glaciolacustrine sediments are at least 1 m thick, and therefore there is potential to extend the history of Lake Tennyson into the late Pleistocene.
Conclusions
Combining CHIRP subsurface imagery with multiproxy sediment core-derived palaeoenvironmental data sets revealed numerous examples of co-seismic subaerial sediment influx and sediment deformation in the stratigraphy of Lake Tennyson. The site proved to be well-suited for reconstruction of paleoseismic events related to the rupture of the Awatere Fault (or faults located nearby) whereby it was possible to constrain the most recent major seismic event to between 200 ± 20 and 729 ± 20 14C y BP (between the late thirteenth century CE and mid-twentieth Century). The presence of a hummocky landslide deposit in the lake is linked to a slope failure adjacent to a trace of the Awatere Fault that cuts across the lake.
The nature of Lake Tennyson lake sediments and basin architecture requires a more spatially extensive and deeper coring effort to enable construction of a long and robust paleoseismic record for the Awatere Fault. Future work should involve collection of cores to the north and south of the fault to enable assessment of the extent of sediment deformation throughout the lake. In addition, greater core depths may also reach quasi-laminated sediments of glacial age, allowing for age bracketing of past seismic events prior to the last millennium. The uppermost sand layers in the cores may also represent co-seismic turbidites that overlap with the historical record of seismic events (Mcginty et al. Citation1997), which would offer a possible calibration for paleoseismic proxies inferred from the lake sediment stratigraphy.
Improved chronological control for the inferred co-seismic events in the Lake Tennyson sediment cores is needed in combination with well-dated paleoseismic records from the surrounding region (R. M. Mason et al. Citation2006; van Dissen and Nicol Citation2009; Langridge et al. Citation2017) in order to evaluate whether they are a regional or local seismic signatures or features derived from sediment influx associated with floods or snowmelt. 210Pb dating of the upper sediments may be a viable method of establishing a core chronology in the absence of datable organic material, as aliquots of pollen for 14C dating may be problematic due to reworking of older sediments from the surrounding catchment slopes. There is also potential to link the recent Lake Tennyson sediments to local mountain beech tree ring records that may have been impacted by movement of splays of the Awatere Fault. A cross-disciplinary study examining forest and lake response to episodic disturbance regimes from seismicity is therefore a logical offshoot of this work, and could help to test the hypothesis that there are multiple seismically-generated sand layers in the lake stratigraphy. The use of tree rings and tree cohorts to date past earthquakes has previously been applied for understanding Alpine Fault ruptures (Wells et al. Citation1998, Citation1999).
Overall, the potential of the Lake Tennyson sediments for palaeoenvironmental reconstructions is limited by the depth and extent to which sediments remain undeformed in Lake Tennyson. The greatest potential for recent prehistoric palaeoseismic and palaeoclimatic records are within the upper ∼1 m of sediment in the CHIRP imagery, and this would likely cover most of the last millennium. However, the resolution is high over this time interval, so environmental change reconstructions at the annual to decadal-scale may be possible, and older undisturbed sediments may yet be recovered, making the site a valuable addition to the national network of paleoclimate data (A. M. Lorrey and Bostock Citation2017). Biogenic silica production variability and changing lake bottom water redox state also appear to be well represented in the µ-XRF core scans, suggesting windiness proxies could be developed for the site.
The majority of the elemental signatures in the Lake Tennyson sediments revealed in µ-XRF core scans are representative of clastic sedimentation and are thus likely representative of erosion-driven sediment influx sourced from the surrounding catchment. The paleoclimate research potential for the lake sediments therefore partly lies in the interpretation of climatic drivers of increased or decreased erosion, but with the significant caveat that seismic signals may manifest in the lacustrine sediment in a similar way. There are also abundant peat sequences interspersed within the moraines on the southern apron of Lake Tennyson. Some of these near the southern lake shore are superimposed on finely-laminated glaciolacustrine sediments (with embedded drop stones) that indicate an ice-proximal and post-glacial lacustrine history is recorded in Lake Tennyson. The extent and thickness of these glacial sediments is unclear, though there may be opportunities to create a ‘patchwork’ of onshore-offshore records to reconstruct climate and environmental change since the end of the last ice age more comprehensively at Lake Tennyson. That effort would usefully link with burgeoning cosmogenic exposure age data from the site (Woolley Citation2016; Stuthridge Citation2022) and help refine our understanding of how glaciers in this catchment have changed through time.
Acknowledgements
The authors thank Andrew Willsman (NIWA) for operating the boat used to acquire CHIRP imagery and for taking cores and for producing the Lake Tennyson bathymetric contours.
Disclosure statement
No potential conflict of interest was reported by the author(s).
Data availability statement
All ITRAX and bathymetric data will be made available on reasonable request.
Additional information
Funding
References
- Augustinus P, D’costa D, Deng Y, Hagg J, Shane P. 2011. A multi-proxy record of changing environments from ca. 30 000 to 9000 cal. a BP: Onepoto maar palaeolake, Auckland, New Zealand. Journal of Quaternary Science. 26(4):389–401. doi:10.1002/jqs.1463.
- Barrell DJA. 2011. Quaternary glaciers of New Zealand (pp. 1047–1064). doi:10.1016/B978-0-444-53447-7.00075-1.
- Berntsson A, Rosqvist GC, Velle G. 2014. Late-Holocene temperature and precipitation changes in Vindelfjällen, mid-western Swedish Lapland, inferred from chironomid and geochemical data. The Holocene. 24(1):78–92. doi:10.1177/0959683613512167.
- Burnett AP, Soreghan MJ, Scholz CA, Brown ET. 2011. Tropical East African climate change and its relation to global climate: a record from Lake Tanganyika, Tropical East Africa, over the past 90+ kyr. Palaeogeography, Palaeoclimatology, Palaeoecology. 303(1–4):155–167. doi:10.1016/j.palaeo.2010.02.011.
- Chapron E, Beck C, Pourchet M, Deconinck J-F. 1999. 1822 earthquake-triggered homogenite in Lake Le Bourget (NW Alps). Terra Nova. 11(2–3):86–92. doi:10.1046/j.1365-3121.1999.00230.x.
- Chinn TJH. 2001. Distribution of the glacial water resources of New Zealand. Journal of Hydrology (NZ). 40(2):139–187.
- Cohen AS. 2003. Paleolimnology: the history and evolution of lake systems. Oxford: Oxford University Press.
- Croudace IW, Rindby A, Rothwell RG. 2006. ITRAX: description and evaluation of a new multi-function X-ray core scanner. Geological Society, London, Special Publications. 267(1):51–63. doi:10.1144/GSL.SP.2006.267.01.04.
- Croudace IW, Rothwell RG, editors. 2015. Micro-XRF studies of sediment cores (Vol. 17). Dordrecht, Netherlands: Springer. doi:10.1007/978-94-017-9849-5.
- Cuven S, Francus P, Lamoureux S. 2011. Mid to Late Holocene hydroclimatic and geochemical records from the varved sediments of East Lake, Cape Bounty, Canadian High Arctic. Quaternary Science Reviews. 30(19–20):2651–2665. doi:10.1016/j.quascirev.2011.05.019.
- Davies SJ, Lamb HF, Roberts SJ. 2015. Micro-XRF core scanning in palaeolimnology: recent developments (pp. 189–226). doi:10.1007/978-94-017-9849-5_7.
- Davison W. 1993. Iron and manganese in lakes. Earth-Science Reviews. 34(2):119–163. doi:10.1016/0012-8252(93)90029-7.
- Evans G, Augustinus P, Gadd P, Zawadzki A, Ditchfield A. 2019. A multi-proxy μ-XRF inferred lake sediment record of environmental change spanning the last ca. 2230 years from Lake Kanono, Northland, New Zealand. Quaternary Science Reviews. 225:106000. doi:10.1016/j.quascirev.2019.106000.
- Guyard H, Chapron E, St-Onge G, Anselmetti FS, Arnaud F, Magand O, Francus P, Mélières M-A. 2007. High-altitude varve records of abrupt environmental changes and mining activity over the last 4000 years in the Western French Alps (Lake Bramant, Grandes Rousses Massif). Quaternary Science Reviews. 26(19–21):2644–2660. doi:10.1016/j.quascirev.2007.07.007.
- Haberzettl T, Corbella H, Fey M, Janssen S, Lücke A, Mayr C, Ohlendorf C, Schäbitz F, Schleser GH, Wille M, et al. 2007. Lateglacial and Holocene wet—dry cycles in southern Patagonia: chronology, sedimentology and geochemistry of a lacustrine record from Laguna Potrok Aike, Argentina. The Holocene. 17(3):297–310. doi:10.1177/0959683607076437.
- Hogg AG, Heaton TJ, Hua Q, Palmer JG, Turney CS, Southon J, Bayliss A, Blackwell PG, Boswijk G, Bronk Ramsey C, et al. 2020. SHCal20 Southern Hemisphere Calibration, 0–55,000 Years cal BP. Radiocarbon. 62(4):759–778. doi:10.1017/RDC.2020.59.
- Hogg AG, Hua Q, Blackwell PG, Niu M, Buck CE, Guilderson TP, Heaton TJ, Palmer JG, Reimer PJ, Reimer RW, et al. 2013. SHCal13 Southern Hemisphere Calibration, 0–50,000 Years cal BP. Radiocarbon. 55(4):1889–1903. doi:10.2458/azu_js_rc.55.16783.
- Howarth JD, Barth NC, Fitzsimons SJ, Richards-Dinger K, Clark KJ, Biasi GP, Cochran UA, Langridge RM, Berryman KR, Sutherland R. 2021. Spatiotemporal clustering of great earthquakes on a transform fault controlled by geometry. Nature Geoscience. 14(5):314–320. doi:10.1038/s41561-021-00721-4.
- Howarth JD, Fitzsimons SJ, Norris RJ, Jacobsen GE. 2014. Lake sediments record high intensity shaking that provides insight into the location and rupture length of large earthquakes on the Alpine Fault, New Zealand. Earth and Planetary Science Letters. 403:340–351. doi:10.1016/j.epsl.2014.07.008.
- Imboden DM, Wüest A. 1995. Mixing mechanisms in lakes. In: Lerman A, Imboden DM, Gat JR, editors. Physics and chemistry of lakes. Springer Berlin Heidelberg; p. 83–138. doi:10.1007/978-3-642-85132-2_4.
- Jouve G, Francus P, Lamoureux S, Provencher-Nolet L, Hahn A, Haberzettl T, Fortin D, Nuttin L. 2013. Microsedimentological characterization using image analysis and μ-XRF as indicators of sedimentary processes and climate changes during Lateglacial at Laguna Potrok Aike, Santa Cruz, Argentina, Santa Cruz, Argentina. Quaternary Science Reviews. 71:191–204. doi:10.1016/j.quascirev.2012.06.003.
- Kylander ME, Ampel L, Wohlfarth B, Veres D. 2011. High-resolution X-ray fluorescence core scanning analysis of Les Echets (France) sedimentary sequence: new insights from chemical proxies. Journal of Quaternary Science. 26(1):109–117. doi:10.1002/jqs.1438.
- Lamb SH, Bibby HM. 1989. The last 25 Ma of rotational deformation in part of the New Zealand plate-boundary zone. Journal of Structural Geology. 11(4):473–492. doi:10.1016/0191-8141(89)90024-2.
- Langridge R, Ries W, Litchfield N, Villamor P, Van Dissen R, Barrell D, Rattenbury M, Heron D, Haubrock S, Townsend D, et al. 2016. The New Zealand active faults database. New Zealand Journal of Geology and Geophysics. 59(1):86–96. doi:10.1080/00288306.2015.1112818.
- Langridge RM, Howarth JD, Carey JM, Zondervan A, Strong DT. 2017. Reconnaissance geology of lake McRae, Marlborough: landslides, lake sediments and paleo-earthquakes. Lower Hutt, Wellington: GNS Science, 55.
- Liu X, Colman SM, Brown ET, Henderson ACG, Werne JP, Holmes JA. 2014. Abrupt deglaciation on the northeastern Tibetan Plateau: Evidence from Lake Qinghai. Journal of Paleolimnology. 51(2):223–240. doi:10.1007/s10933-013-9721-y.
- Lodolo E, Menichetti M, Bartole R, Ben-Avraham Z, Tassone A, Lippai H. 2003. Magallanes-Fagnano continental transform fault (Tierra del Fuego, southernmost South America): MAGALLANES-FAGNANO FAULT IN TIERRA DEL FUEGO. Tectonics. 22(6). doi:10.1029/2003TC001500.
- Lorrey A, Williams P, Salinger J, Martin T, Palmer J, Fowler A, Zhao J, Neil H. 2008. Speleothem stable isotope records interpreted within a multi-proxy framework and implications for New Zealand palaeoclimate reconstruction. Quaternary International. 187(1):52–75. doi:10.1016/j.quaint.2007.09.039.
- Lorrey AM, Vargo L, Purdie H, Anderson B, Cullen NJ, Sirguey P, Mackintosh A, Willsman A, Macara G, Chinn W. 2022. Southern Alps equilibrium line altitudes: four decades of observations show coherent glacier–climate responses and a rising snowline trend. Journal of Glaciology. 68(272):1127–1140. doi:10.1017/jog.2022.27.
- Lorrey AM, Bostock H. 2017. The climate of New Zealand through the quaternary. In: Shulmeister J, editor. Landscape and quaternary environmental change in New Zealand. Paris: Atlantis Press; p. 67–139. doi:10.2991/978-94-6239-237-3_3.
- Lorrey A, Fowler A, Salinger J. 2007. Regional climate regime classification as a qualitative tool for interpreting multi-proxy palaeoclimate data spatial patterns: a New Zealand case study. Palaeogeography, Palaeoclimatology, Palaeoecology. 253(3–4):407–433. doi:10.1016/j.palaeo.2007.06.011.
- Lurton X, Jackson DR. 2004. An introduction to underwater acoustics. The Journal of the Acoustical Society of America. 115(2):443–443. doi:10.1121/1.1639324.
- Marshall MH, Lamb HF, Huws D, Davies SJ, Bates R, Bloemendal J, Boyle J, Leng MJ, Umer M, Bryant C. 2011. Late Pleistocene and Holocene drought events at Lake Tana, the source of the Blue Nile. Global and Planetary Change. 78(3–4):147–161. doi:10.1016/j.gloplacha.2011.06.004.
- Mason DPM, Little TA, VanDissen RJ. 2006. Refinements to the paleoseismic chronology of the eastern Awatere Fault from trenches near Upcot Saddle, Marlborough, New Zealand. New Zealand Journal of Geology and Geophysics. 49(3):383–397. doi:10.1080/00288306.2006.9515175.
- McCalpin JP. 1992. Glacial and postglacial geology near Lake Tennyson, Clarence River, New Zealand. New Zealand Journal of Geology and Geophysics. 35(2):201–210. doi:10.1080/00288306.1992.9514514.
- McCalpin JP. 1996. Tectonic geomorphology and Holocene paleoseismicity of the Molesworth section of the Awatere Fault, South Island, New Zealand. New Zealand Journal of Geology and Geophysics. 39(1):33–50. doi:10.1080/00288306.1996.9514693.
- Mcginty P, Robinson R, Taber J, Reyners M. 1997. The 1990 Lake Tennyson earthquake sequence, Marlborough, New Zealand. New Zealand Journal of Geology and Geophysics. 40(4):521–535. doi:10.1080/00288306.1997.9514781.
- McLea WL. 1996. The late-Quaternary pollen record of south-east Nelson, South Island, New Zealand. New Zealand Journal of Botany. 34(4):523–538. doi:10.1080/0028825X.1996.10410133.
- Meyers PA. 1994. Preservation of elemental and isotopic source identification of sedimentary organic matter. Chemical Geology. 114(3–4):289–302. doi:10.1016/0009-2541(94)90059-0.
- Meyers PA, Teranes JL. 2002. Sediment organic matter. In: Last WM, Smol JP, editors. Tracking environmental change using lake sediments. Dordrecht, Netherlands: Springer; p. 239–269. doi:10.1007/0-306-47670-3_9.
- Peti L, Augustinus PC. 2022. Micro-XRF-inferred depositional history of the Orakei maar lake sediment sequence, Auckland, New Zealand. Journal of Paleolimnology. 67(4):327–344. doi:10.1007/s10933-022-00235-y.
- Rattenbury MS, Townsend DB, Johnston MR. 2006. Geology of the Kaikoura area. Lower Hutt, Wellington: Institute of Geological & Nuclear Sciences 1:250 000 geological map 13. GNS Science, 70.
- Roop HA, Levy R, Dunbar GB, Vandergoes MJ, Howarth J, Fitzsimons S, Moon HS, Zammit C, Ditchburn R, Baisden T, Yoon HI. 2016. A hydroclimate-proxy model based on sedimentary facies in an annually laminated sequence from Lake Ohau, South Island, New Zealand. Journal of Paleolimnology. 55(1):1–16. doi:10.1007/s10933-015-9853-3.
- Rothwell RG, Hoogakker B, Thomson J, Croudace IW, Frenz M. 2006. Turbidite emplacement on the southern Balearic Abyssal Plain (western Mediterranean Sea) during Marine Isotope Stages 1–3: an application of ITRAX XRF scanning of sediment cores to lithostratigraphic analysis. Geological Society, London, Special Publications. 267(1):79–98. doi:10.1144/GSL.SP.2006.267.01.06.
- Schnellmann M, Anselmetti FS, Giardini D, McKenzie JA, Ward SN. 2002. Prehistoric earthquake history revealed by lacustrine slump deposits. Geology. 30(12):1131. doi:10.1130/0091-7613(2002)030.
- Shilts WW, Clague JJ. 1992. Documentation of earthquake-induced disturbance of lake sediments using subbottom acoustic profiling. Canadian Journal of Earth Sciences. 29(5):1018–1042. doi:10.1139/e92-084.
- Stephens T, Atkin D, Augustinus P, Shane P, Lorrey A, Street-Perrott A, Nilsson A, Snowball I. 2012. A late glacial antarctic climate teleconnection and variable Holocene seasonality at Lake Pupuke, Auckland, New Zealand. Journal of Paleolimnology. 48(4):785–800. doi:10.1007/s10933-012-9644-z.
- Stuiver M, Reimer PJ. 1993. Extended 14 C data base and revised CALIB 3.0 14 C age calibration program. Radiocarbon. 35(1):215–230. doi:10.1017/S0033822200013904.
- Sturman AP, Tapper NJ. 2006. The weather and climate of Australia and New Zealand. Oxford: Oxford University Press.
- Stuthridge G. 2022. The glacial history of the upper Clarence Valley, North Canterbury, New Zealand.
- van Dissen R, Nicol A. 2009. Mid-late Holocene paleoseismicity of the eastern Clarence Fault, Marlborough, New Zealand. New Zealand Journal of Geology and Geophysics. 52(3):195–208. doi:10.1080/00288300909509886.
- Wells A, Stewart GH, Duncan RP. 1998. Evidence of widespread, synchronous, disturbance-initiated forest establishment in Westland, New Zealand. Journal of the Royal Society of New Zealand. 28(2):333–345. doi:10.1080/03014223.1998.9517569.
- Wells A, Yetton MD, Duncan RP, Stewart GH, Ecology AW, Group E, Division ES, Box PO. 1999. Prehistoric dates of the most recent Alpine fault earthquakes, New Zealand. Geology. 27(11):995–998. doi:10.1130/0091-7613(1999)027<0995:PDOTMR>2.3.CO;2.
- Werne JP, Lyons TW, Hollander DJ, Formolo MJ, Sinninghe Damsté JS. 2003. Reduced sulfur in euxinic sediments of the Cariaco Basin: sulfur isotope constraints on organic sulfur formation. Chemical Geology. 195(1–4) 2003, 159–179. https://doi.org/10.1016/S0009-2541(02)00393-5.
- Woodward CA, Gadd PS. 2019. The potential power and pitfalls of using the X-ray fluorescence molybdenum incoherent: coherent scattering ratio as a proxy for sediment organic content. Quaternary International. 514:30–43. doi:10.1016/j.quaint.2018.11.031.
- Woolley J-MS. 2016. Last glacial maximum to Holocene environmental history of the Lake Tennyson area, North Canterbury, New Zealand [University of Auckland]. https://catalogue.library.auckland.ac.nz/permalink/f/gkavgk/uoa_alma21266191000002091.
- Yang JS. 1991. The Kakapo Fault—A major active dextral fault in the central North Canterbury - Buller regions of New Zealand. New Zealand Journal of Geology and Geophysics. 34(2):137–143. doi:10.1080/00288306.1991.9514451.
Appendix
Explanation of standard chemical proxies
Organic matter (OM) in the lake sediments can be sourced from aquatic and terrestrial biota. The amount and type of these biota are affected by environmental and climatic conditions and retain their source characteristics following sedimentation (Meyers and Teranes Citation2002; Cohen Citation2003). TOC is a useful indicator of the degree of overall biological productivity within and around the lake or bog and can be used to infer relative paleoenvironmental conditions (e.g. temperature, precipitation, and nutrient availability) (Meyers Citation1994; Meyers and Teranes Citation2002; Cohen Citation2003; Stephens, Atkin, Augustinus, Shane, Lorrey, Street-Perrott, Nilsson, & Snowball, Citation2012). Similarly, total nitrogen (TN) can indicate paleoproductivity but relates more to OM sourced from aquatic phytoplankton (richer in N than terrestrial OM) (Meyers and Teranes Citation2002; Stephens, Atkin, Augustinus, Shane, Lorrey, Street-Perrott, Nilsson, & Snowball, Citation2012). The relative contribution of aquatic and terrestrial sources to sedimentary OM can be distinguished using the TOC/TN ratio. OM sourced from aquatic phytoplankton tends to exhibit TOC/TN ratios between 4 and 10 whereas OM sourced from terrestrial vascular plants exhibits TOC/TN values greater than 20 (Meyers Citation1994; Meyers and Teranes Citation2002).
Total Sulphur (TS) can be used as an elemental proxy for paleoproductivity much like TOC and TN. However, because TS is also affected by benthic redox conditions, values can also relate to thermocline stability (i.e. lake mixing and turbulence) (Davies et al. Citation2015; Peti and Augustinus Citation2022; Werne et al. Citation2003). Sulphur is supplied to lakes as inorganic sulphates and organic S-bearing compounds from the surrounding catchment (Cohen Citation2003). Under anoxic conditions, dissolved sulphate can be converted to reduced sulphur (H2S) allowing it to be incorporated into either pyrite (FeS2; requires sufficient Fe) or sedimentary OM and subsequently buried during sedimentation (Werne et al. Citation2003). Because TS is enhanced in anoxic waters, it must be considered alongside proxies such as TOC, TN, Fe, and Mn in order to make more reliable inferences relating to paleoproductivity and/or former redox conditions.
There was a significant drift with respect to nitrogen measurements made on TC-04A, leading to an increasing trend through the bottom 17 cm of core that consequently had an impact on the C/N ratio. A correction was applied by measuring a repeat sample at the beginning and end of the drifting sample set and assuming a linear drift between. Because of this technical issue, only core TC-04A carbon and nitrogen data are presented.