
 ?Mathematical formulae have been encoded as MathML and are displayed in this HTML version using MathJax in order to improve their display. Uncheck the box to turn MathJax off. This feature requires Javascript. Click on a formula to zoom.
Abstract
While considerable attention has been paid to the impact of Covid-19 on mortality and fertility, few studies have attempted to evaluate the pandemic’s effect on international migration. We analyse the impact of Covid-19 on births, deaths, and international migration in Spain during 2020, comparing observed data with estimated values assuming there had been no pandemic. We also assess the consequences of three post-pandemic scenarios on the size and structure of the population to 2031. Results show that in 2020, excess mortality equalled 16.2 per cent and births were 6.5 per cent lower than expected. Immigration was the most affected component, at 36.0 per cent lower than expected, while emigration was reduced by 23.8 per cent. If net migration values recover to pre-pandemic levels in 2022, the size and structure of the population in 2031 will be barely affected. Conversely, if levels do not recover until 2025, there will be important changes to Spain’s age structure.
Introduction
The impact of the Covid-19 pandemic has been massive and was unforeseen. As of 31 December 2021, about 5.4 million deaths and more than 286 million confirmed cases had been officially recorded (WHO Citation2022), although the real figures were probably much higher. During 2020–21, Spain was one of the most affected countries in Europe, with 90,035 deaths and 6.7 million confirmed cases (National Center of Epidemiology Citation2022). Research on the demographic consequences of the pandemic has focused particularly on excess deaths (e.g. Bramajo et al. Citation2020; Weinberger et al. Citation2020; Basellini et al. Citation2021; Modig et al. Citation2021) and the effect on life expectancy (e.g. Ghislandi et al. Citation2020; Trias-Llimós et al. Citation2020; Esteve et al. Citation2021; Aburto et al. Citation2022). Other researchers have studied the importance of household structure (Esteve et al. Citation2020; Boertien et al. Citation2021), population density (Bhadra et al. Citation2021), and social and economic factors (Zazueta-Borboa and Jaramillo-Molina Citation2020; Mogi and Spijker Citation2022; López-Gay et al. Citation2022) in the propagation of the virus.
There is also evidence of pandemic-related fertility decline in different European countries, including Spain (Luppi et al. Citation2020; Esteve et al. Citation2021; INE Citation2021), although Aassve et al. (Citation2021) did find increases in fertility (albeit not statistically significant) in several high-income countries during the last months of 2020. As economic recessions and uncertainty are associated with decreases in fertility levels (Sabater and Graham Citation2019; Matysiak et al. Citation2021), the question remains whether the economic downturn and health conditions resulting from the Covid-19 pandemic will have a lasting impact on fertility intentions.
Currently, there is extensive knowledge on how Covid-19 has affected mortality and fertility. However, less attention has been paid to the impact of the pandemic on international migration, even though it is now the most important demographic component of population growth in ageing societies with low fertility (Lee Citation2011; Billari and Dalla-Zuanna Citation2012; Newsham and Rowe Citation2019). This gap is due to the lack of up-to-date migration register data and the difficulty in modelling migration. In Spain, the National Institute of Statistics (INE) did not publish the migration data for 2020 until July 2021, following their usual schedule of biannual publication, as it is more complex to monitor migration flows than vital statistics. In the case of mortality, daily registration of deaths was implemented at the beginning of the pandemic, while the INE also began publishing monthly birth data earlier than usual. However, restrictions on mobility, border closures (Guadagno Citation2020; IOM Citation2020), and the economic slowdown caused by the pandemic (Nicola et al. Citation2020) would have had important effects on international migration. It is well known that economic recessions affect migration flows between countries (Tilly Citation2011; Villarreal Citation2014; Abel Citation2018). These flows will therefore be strongly conditioned over the coming years by the trajectory of the pandemic, international and domestic macroeconomic conditions, and migration policies (Charles-Edwards et al. Citation2021; Wilson et al. Citation2021).
Our research attempts to fill the gap on the combined impacts of the pandemic on international migration, mortality and fertility. Specifically, this paper has two objectives. The first is to quantify the impact of Covid-19 on the demographic components (immigration, emigration, births, and deaths) in Spain during 2020. To do this, we compare the observed data with a population projection that assumes there has been no pandemic. The second objective is to quantify the effect that Covid-19 could have on population growth and structure in the next 10 years on the basis of three possible scenarios: Short-, Medium-, and Long-term impact. The three projections are then compared with a scenario without a pandemic, whose horizon is set according to observed trends during the last five years and the official pre-pandemic projections to 2031 made by the INE in 2018. For comparative purposes, we also add the medium scenario of the official INE projection made in 2020, which is the most up-to-date population projection and already includes the effect of Covid-19 on demographic dynamics. The main issue, however, with this projection is that it underestimates immigration, emigration, and deaths and overestimates fertility, as it was conducted with data observed until mid-2020. Specifically, the INE projected excess mortality only until mid-2020, assumed zero international migration during the second half of the same year, and did not project a decline in fertility. Our results should, therefore, be more precise, as our models of demographic trends also include observed data for the second half of 2020. Our projection method is taken from the INE and is based on the cohort component method. In the next two sections, we explain the methods and hypotheses used in the projections in more detail. We then begin the Results section by comparing the absolute values of the demographic components registered in 2020 with our projection of the expected figures for the same year if there had not been a pandemic. This is followed by our projections to 2031 that include the estimates of the demographic consequences that the pandemic could have according to the three scenarios. We conclude our paper by discussing the results.
Method
The analysis is based on publicly available age- and sex-specific population counts, fertility, mortality, immigration, and emigration register data from the INE (www.ine.es). In the case of migration data, there are two official sources: the Residential Variation Statistics (EVR) and the Migration Statistics (EM). The former corresponds to registered migratory movements and the latter (that has existed since 2008) uses a series of statistical procedures to correct some of the problems associated with the EVR data, such as over-registration due to temporary mobility. The SM data are used as a reference for the projections. In the scenario without the pandemic, the starting population equals that recorded on 1 January 2020, while the population on 1 January 2021 is used in the remaining scenarios where the Covid-19 effects are introduced.
The cohort component method is used to project the demographic components by cohort on a single-age and year-by-year basis. This method was first implemented by Cannan (Citation1895) and Whelpton (Citation1936), although the specific method used for this study is taken from the INE (Citation2018, Citation2020). We establish as a base the starting population and obtain the population corresponding to later dates under certain hypotheses, set on the basis of a retrospective analysis of the trends observed in each component, academic literature, and official projections. Starting from the initial population () according to sex s and age x, the population at age x + 1 in year t + 1 is projected (
) for three age groups: those born during year t (equation (1)); the population aged 0–99 years (equation (2)); and those aged 100+ (equation (3)):
(1)
(1)
(2)
(2)
(3)
(3) In equation (1),
,
, and
are, respectively, the probability of dying, the probability of emigrating, and the number of immigrants of sex s and cohort b, the cohort which shifts from birth to age 0 over the t to t + 1 projection interval. In equation (2),
,
, and
are, respectively, the probabilities of dying and emigrating and the number of immigrants of sex s and age x over the t to t + 1 projection interval. For the open-ended age group in equation (3),
,
, and
are the probabilities of dying and emigrating and the number of immigrants of sex s and aged 99 and older over the t to t + 1 projection interval. In equation (1),
is the sex-specific number of births, which is obtained by:
(4)
(4) where r is the sex ratio at birth in the case of males (or 1−r for females),
is the population of females aged 15–49 years, and
are the age-specific fertility rates.
For the fertility projection, following the same model strategy as the INE, we use a Beta probability distribution, whereby the lower age limit α is set at 15 years and the upper age limit β at 49 years. The total period fertility rate (TFR) values are distributed according to the observed age-specific fertility schedule. Women’s mean age at maternity and the distribution of fertility by age are kept the same in all scenarios because their variation has practically no effect on the total number of births (see the Lowest scenario of the sensitivity analysis in the supplementary material). The fertility function is therefore as follows:
(5)
(5) where D(β) is the TFR up to age β, the upper limit of the age range, and g(x) is the age-specific fertility schedule defined in the age interval (α β).
We also project life expectancy at birth (e0) by sex for each year of the period 1 January 2020 to 31 December 2030 through a linear regression of a logit function, from a past theoretical minimum fixed to minus infinity to a maximum that would be reached in a theoretical future fixed at infinity, far from the horizon year 2030. To this end, we first need to set the minimum and maximum limits of e0 in the logistic function that allow us to adjust the value of our horizon to what the INE projected for the year 2030: 82.5 for men and 87.2 for women. This is the same method recommended by the World Bank for projecting e0 (INE Citation2018, Citation2020):
(6)
(6) By setting the minimum limit of e0 in the logistic function to 40 years for both sexes and the maximum limits to 85.9 years for men and 89.9 years for women, we are able to adjust the logistic function to reach values for 2030 that are identical to those obtained by the INE in their 2018–68 projections. The maximum values correspond to those from the INE for 2061 (men) and 2055 (women) and are close to what the United Nations (UNDESA Citation2019) estimated for Spain for the same period (medium variant).
To calculate the life expectancies at birth for each year of the projection period, following the method used by the INE we transform the life expectancies for the period prior to baseline (1991–2019) () using the results from the previous logit function (see also Bulatao et al. Citation1989; Martínez-Guzmán et al. Citation2015; INE Citation2018, Citation2020). This is done by applying Ordinary Least Squares regression and estimating the parameters α (the intercept) and β (the slope):
(7)
(7) This provides us with an estimate of eo for each projection year after substituting the logit function of the life expectancy trend observed since 1991 in the following equation:
(8)
(8)
To obtain the annual probabilities of dying, , for the period 2020–30, which are needed to estimate the yearly number of deaths by age and sex, we use, as per INE (Citation2018, Citation2020), Coale and Demeny’s annual model life tables (East sector for men and West sector for women, as published by UNDESA [Citationn.d.]). We first calculate a life table for the average of the last three years (2017–19) to avoid the variability of using only the last observed year and then use a linear interpolation between the 2017–19 life table and the model table, using 400 tables. We then extract the values of
that fit the figures of the e0 projected for each year from 2020 to 2030 by the logit function.
Emigration is projected using emigration rates by cohort and sex, , for each year of the projection (equation (9)). To set emigration levels, we use the gross migraproduction rate (GMR), whose values we are able to change year by year according to our hypotheses. The GMR can be defined as the number of movements taken over a person’s lifetime. This indicator was first proposed by Rogers (Citation1975) and later used as a summary measure of migration by Willekens and Rogers (Citation1978) and Rees et al. (Citation2000), among others. The interpretation is the same as for the TFR, but for migration (emigration in our case) instead of births. It is calculated in the same way as the TFR: that is, by summing the age-specific migration rates. Finally, we distribute the GMR by age using the age-specific emigration schedule, based on the average of the last three years observed:
(9)
(9) where
is the GMR by sex for year t, and
is the age-specific emigration schedule by sex s.
Regarding immigration, we introduce inflows and distribute them by sex and cohort according to the observed age-specific immigration schedule for the last three years:
(10)
(10) where
is the flow of immigrants in year t, and
is the age-specific immigration schedule by sex. To set the number of flows, we use a lineal interpolation between the last observed year and the horizon of our projection (2030).
Scenarios and hypotheses
To explore the effect that Covid-19 could have on population growth and structure over the current decade, we devise three impact scenarios (1–3). The ensuing projections are then compared with a scenario where we assume that the pandemic never took place (scenario 0) as well as with the official projections made by the INE in 2020 (scenario 4):
0. The No pandemic scenario, based on the observed data over the previous five years and the official population projections produced by the INE in 2018, prior to the pandemic;
1. A Short-term impact scenario, where the demographic trends recuperate to equal the No pandemic scenario levels in 2022;
2. A Medium-term impact scenario, where the demographic trends do not fully recuperate to the No pandemic projection until 2025;
3. A Long-term impact scenario, where the demographic trends do not fully recuperate to the No pandemic projection until 2030; and
4. The INE medium scenario, taken from the official population projections of 2020, which already include the effect of the pandemic.
Scenario 0: No pandemic
The projection horizon for the TFR is set at 1.30 in 2030, that of the flow of immigrants at 536,631, and that of emigrants at 333,488, adjusting the GMR by 0.68 for men and 0.57 for women ( and ). These values correspond to the average of the last five years observed, the period 2015–19, and are equal to those used in the INE Citation2018 official population projection. Other authors have also used a five-year average to set their hypothesis (e.g. Abel Citation2018). For the trend of the projection period, we make a linear interpolation between the years 2020 and 2030. Our TFR horizon coincides with the INE low-fertility scenario from the 2018–68 pre-pandemic population projection in the year 2030, and the migration components with the medium scenario for the same year. In our No pandemic projection, immigration shows a downward trend from 2020 to 2030 because the observed values in 2018 and 2019 were exceptionally high, so a minor decrease in the following years would be expected. This downward trend is supported by three arguments: first, a decrease was observed at the start of the 2008–14 economic recession, when the annual flow of immigrants was also exceptionally high and similar to 2018–19; second, the unemployment rate in Spain during the first months of 2020 was about 15 per cent, so with the Spanish baby boom generation (1958–77) still at working age, an annual inflow of 700,000 people was not expected for several years; third, the projected value for our horizon year 2030 is similar to the official projection made by the INE prior to the pandemic. For e0, we use the values for 2030 according to the INE medium scenario from their 2018–68 pre-pandemic population projection: 82.47 years for men and 87.32 years for women.
Figure 1 (a) Total fertility and (b) life expectancy at birth in Spain: observed 2000–20 and projected to 2030 according to five scenarios
Notes: The projection of demographic components ends on 31 December 2030. The INE projection category corresponds to the medium scenario of the 2020 projection.
Source: INE and authors’ projections.
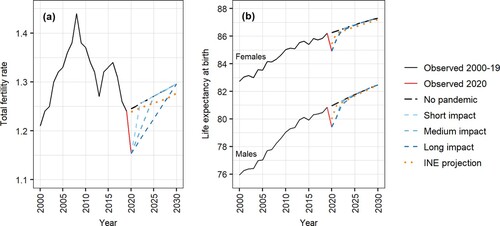
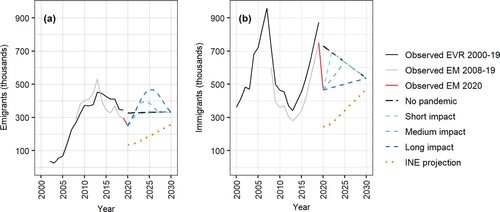
Figure 2 (a) Emigration and (b) immigration in Spain: observed 2000–20 and projected to 2030 according to five scenarios
Notes: The projection of demographic components ends on 31 December 2030. The INE projection category corresponds to the medium scenario of the 2020 projection. Two sources of observed migration counts were included in the charts (Residential Variation Statistics (EVR) and Migration Statistics (EM) (see Method section for more details)).
Source: As for .
Scenario 1: Short-term impact
Published data show substantial declines in the values of demographic components during 2020 compared with 2019, not only in the case of life expectancy, but also total fertility, immigration flows, and emigration flows. The Short-term impact scenario (‘Short-impact’) is based on a generally optimistic view of the impacts of the pandemic in Spain and other countries with high vaccination rates, given the proven vaccine effectiveness against hospitalization, admission to intensive care, and death caused by Covid-19 (Kim and Lee Citation2022; Omer and Malani Citation2022). For 2021, we apply observed excess mortality, as provisional data on deaths have recently become available. After this date, build-up of immunity in the population through natural infection and mass vaccination is expected to minimize the excess mortality directly caused by Covid-19. Hence, the level of eo in Spain is assumed to be the same in 2022 as in the No pandemic scenario. Likewise, we also assume that there will be no economic recession or entry restrictions large enough to affect fertility levels or international migration to and from Spain. Therefore, as for mortality, the values of the No pandemic scenario will be recovered in 2022 for the remaining components.
Scenario 2: Medium-term impact
In this scenario, we apply excess mortality for 2022 that is 75 per cent lower than the figures observed in 2021, as we assume that there will still be some excess mortality this year due to Covid-19-related comorbidities (Ayoubkhani et al. Citation2021), spillover impact of the pandemic into other areas of health and social care leading to loss of life (Rathnayake et al. Citation2021), and possible outbreaks of new and resistant strains, as happened with the Delta and Omicron variants, lowering the efficacy of vaccines (Sheikh et al. Citation2021; Omer and Malani Citation2022). There is no excess mortality from 2023 onwards. In contrast, the projected fertility and migration assumptions in this ‘Medium-impact’ scenario take into account the impact of a possible economic recession until the middle of the projection period, a similar trend to that observed during the economic recession of 2008–14. As a result, the TFR and the flow of immigrants are not expected to arrive at No pandemic scenario values until 2025. As for emigration, a slight increase (due to the hypothetical economic downturn) and a subsequent decrease are projected, with values converging to the No pandemic scenario in the middle of the projection period.
Scenario 3: Long-term impact
In our Long-term impact scenario (‘Long-impact’), we assume a 50 per cent lower excess mortality in 2022 than was registered in 2021. We take the same arguments as in the Medium-impact scenario, but assume that these factors have a stronger effect on the mortality outcomes. In this scenario, we also assume prolonged economic stagnation during the 2020s decade, perhaps compounded by border entry restrictions, making Spain a less attractive country for international migration. Under these assumptions, fertility and immigration flows will not converge to the No pandemic projection until 2030. In fact, our Long-impact scenario assumes a significant increase in emigration until the middle of the projection period due to a prolonged economic recession (similar to that observed during the economic recession of 2008–14), followed by a reduction that is expected to converge to the values of the No pandemic scenario by 2030, when the economic and health situation will have recovered.
Scenario 4: INE medium scenario
The official INE projections for 2020–70 were published in September 2020 and included data observed up to July 2020. Comparing the projection of the demographic components for the whole of 2020 with the actual data recorded later, we can see that the official projection assumptions underestimated migration and excess mortality and overestimated fertility. These issues carried over into the subsequent years of the projection. From these projections, we select the medium scenario for the period 2020–31.
Results
The demographic impact of the pandemic in 2020
Between 1 January 2020 and 1 January 2021, the resident population in Spain should have increased by around 338,419 inhabitants, according to the results of our No pandemic projection (). However, the recorded growth was just 66,081 people, a difference of −272,338. Due to the excess mortality in 2020 (a decline of −1.5 years in e0 in males and −1.3 years in females), there was an excess of 69,738 deaths (+16.2 per cent), with 498,699 deaths recorded compared with the expected 428,961 deaths. According to the National Center of Epidemiology (Citation2022), there were 54,182 deaths due to Covid-19 in 2020, about 15,500 fewer than the excess mortality we estimate. We also observe a reduction in fertility and total births, with a TFR of 1.19 (−4.8 per cent) and 339,206 (−6.5 per cent) births in 2020, compared with a TFR of 1.25 and 362,643 births in the No pandemic scenario. As a result, the natural population change, which should have been about −66,318 persons, slumped a further 91,066 to −157,384.
Figure 3 (a) Observed and expected (No pandemic) values of demographic components in 2020 and (b) difference between observed and expected values in 2020, Spain
Source: As for .
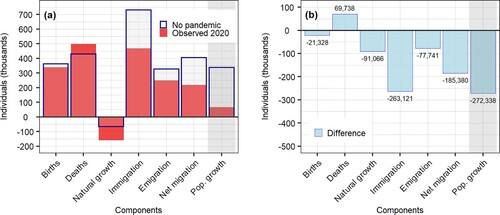
However, the most affected demographic component and the one that had the most important effect in reducing population growth was immigration. In 2020, an inflow of 731,039 people was expected. However, the number of immigrants was only 467,918, a difference of −263,121 (−36.0 per cent). Emigration also declined, although to a lesser extent. The flow of emigrants registered in 2020 was 248,561, 77,741 less (−23.8 per cent) than the 326,302 emigrants in the No pandemic scenario. As a result, the expected net migration balance of 404,737 was reduced to 219,357 migrants (−185,380).
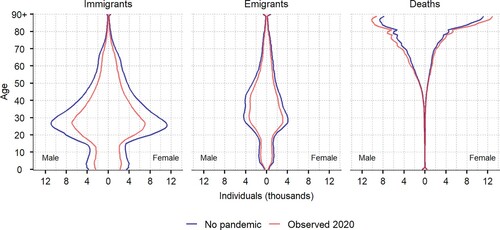
Regarding the variations in the demographic components by age and sex (), the losses due to immigration were concentrated mainly in the young adult age groups and, to a lesser extent, among children and the middle-aged adult population. We do not observe notable differences by sex. The variation in the emigration component affected mainly the 30–49 age group in the case of men and the 30–39 group in the case of women, with little effect at the remaining ages. Excess deaths are most apparent from the age of 60 among men and from the age of 70 in women. They increase progressively with age to peak around age 87 in the case of men and 90+ among women. Although not shown in , the disruption in births has left a lasting dent in the base of the Spanish population pyramid.
Figure 4 Immigrants, emigrants, and deaths by age and sex in Spain: observed and expected (No pandemic) in 2020
Source: As for .
The demographic impact of the pandemic in the coming years: Projections to 2031
In evaluating the effect that the pandemic could have during the 2020s decade, we first consider the number of births according to our No pandemic scenario. As (a) shows, births would have been relatively stable between 1 January 2020 and 1 January 2031 without the pandemic, at around 360,000–370,000 newborns per year. There would have been a slight decline until the middle of the projection period, due to small cohorts reaching reproductive ages (partially offset by immigration), followed by a small increase in births thereafter, due mainly to the progressive inflow of immigrants. So how does this compare with the three pandemic scenarios? According to the Short-impact scenario, there would have been a decline in the number of births in 2021 due to reduced fertility and immigration during that year. Despite this scenario projecting a recovery in fertility and immigration levels in 2022, births do not reach the values of the No pandemic scenario over the period 2022–30 because of the decline in the flow of immigrants of reproductive age in both 2020 and 2021. However, the difference in births between the two scenarios is negligible and the evolution of the trend over time is similar. If either the Medium- and Long-impact scenarios were to hold, substantially fewer babies would be born, especially in the latter scenario, with 30,000 fewer births expected annually compared with the No pandemic scenario. However, births would recover slightly according to the Medium-impact scenario, especially after 2026. Finally, the INE medium scenario shows a continued decline in the number of births. Even though the INE’s expected fertility is higher than ours, their migration assumptions are lower and, as a result, they assume that there will be fewer women of reproductive age.
Figure 5 (a) Births, (b) deaths, (c) natural growth, and (d) net migration: demographic components in Spain, observed 2000–20 and projected to 2030 according to five scenarios
Notes: The projection of demographic components ends on 31 December 2030. The INE projection category corresponds to the medium scenario of the 2020 projection.
Source: As for .
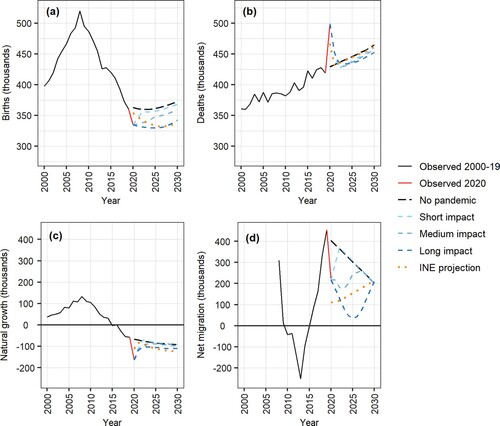
With regard to mortality ((b)), the No pandemic scenario shows a linear increase in deaths due to population ageing and larger cohorts reaching the older age groups. The excess mortality in 2021 equates to 20,000 deaths in all three pandemic scenarios compared with the No pandemic projection. The government reported 35,853 Covid-19-related deaths during the same year (National Center of Epidemiology Citation2022). This difference of just over 15,800 individuals is due to a portion of the older population that would have died in 2021 from other causes instead dying prematurely from the virus (frailty selection). In the Short- and Medium-impact scenarios, the number of registered deaths is expected to be slightly lower compared with the No pandemic scenario from 2022 onwards, since the increase in mortality in 2020 and 2021 reduced the number of older people in the population. The two scenarios show almost identical results, since the increasing mortality in the Medium-impact scenario would have a small impact on the total number of deaths, and the migration and fertility assumptions would have only a small impact on the number of deaths because they affect mainly the young population. If the impact of the pandemic were more long term, a small excess of deaths during 2022 would be likely, but, for the reason already discussed, there would be a small drop in the number of deaths from 2024 onwards. The INE scenario already underestimated mortality in 2020 and did not predict excess mortality in 2021, so there are no major differences with respect to the No pandemic scenario from 2021 onwards.
As the number of deaths exceeds the number of births due to population ageing, future natural population change will be negative in all scenarios ((c)). This dynamic predates 2020, as a negative balance has been recorded in Spain since 2015. However, excess mortality and lower births will exacerbate the already recessionary natural population dynamics. Even in the No pandemic scenario, the annual natural population loss would have increased from 66,317 people in 2020 to just over 92,600 in 2030. While all three pandemic scenarios show a larger decline until 2022 compared with the No pandemic scenario, this is no longer the case thereafter, because much of the reduction in births is expected to be offset by a decline in the number of deaths. Only in the Long-impact scenario is there a greater reduction than in the No pandemic scenario. This is also the case according to the INE scenario due to the reduction in births, again because of the low international migration in their assumptions.
When comparing natural change with net migration ((d)), we can see that the size of the first component is minor compared with the second. Once Spain recovered from the 2008–14 economic recession, net migration increased again until the start of the pandemic. According to the No pandemic scenario, whose end year is based on average migration for 2015–19, the migration balance would have decreased from 404,736 in 2020 to 203,143 net migrants in 2030. This expected decline would have been due to the slowdown in immigration, projected with a downward trend as values were exceptionally high in the previous two years, as mentioned in the Scenarios and hypotheses section. In the Short-impact scenario, the migration balance will recover to similar values to the No pandemic projection in 2022. In the Medium-impact scenario, the migratory balance is reduced to 177,688 people in 2023 and increases again until it reaches the values of the No pandemic scenario in the middle of the projection period. In the Long-impact scenario, the migratory balance is reduced to 34,461 individuals in 2025 due to a more severe and prolonged post-pandemic economic recession, and it is not expected to recover to the No pandemic scenario values until 2030. Lastly, we can observe the INE’s low net migration projection for the 2020s, although their 2030 horizon coincides with ours.
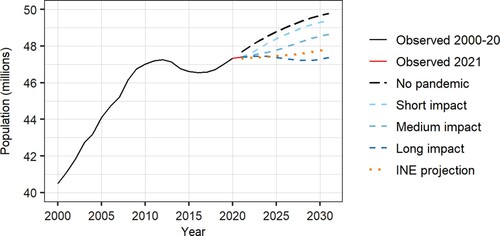
During the period of economic growth between 2000 and 2008, the Spanish population grew from 40.5 to 45.7 million inhabitants, mainly as a result of the large influx of foreign migrants (). Throughout the subsequent economic recession, the decline in migration flows and, to a lesser extent, in fertility led to slower population growth and even depopulation from 2012 to 2016. In recent years, the improvement in the economy has reactivated the flow of immigrants, again leading to Spanish population growth. According to the results of our projection, in the absence of a pandemic, the resident population in Spain would have been expected to rise from 47.33 million inhabitants in 2020 to 49.77 million in 2031. We can compare this with a scenario where the pandemic has only a short-term impact on demographic dynamics in Spain (i.e. until 2022), and the population is still expected to grow to 49.14 million. If, instead, the negative consequences of the pandemic were to last until 2025 (Medium-impact scenario), the number of residents in Spain would increase to 48.64 million people. However, if the effect of the ensuing economic recession on fertility and international migration lasted until 2030, the Spanish population would stay relatively constant during the current decade, reaching only 47.38 million inhabitants on 1 January 2031. The INE Citation2020 projections show the population increasing slightly between 2020 and 2031, to 47.84 million inhabitants.
Figure 6 Observed population 2000–21 (January 1) and projected to 2031 (January 1) according to five scenarios, Spain
Notes: The population projection ends on 1 January 2031, while the projection of the demographic components ends on 31 December 2030. The INE projection category corresponds to the medium scenario of the 2020 projection.
Source: As for .
Given the particular age schedules of mortality, fertility, and migration, the Covid-19 pandemic will also have consequences for the population structure, in particular with respect to the speed of population ageing. Although results show that the excess mortality initially led to only a small reduction in the proportion of older people between 1 January 2020 and 1 January 2021, the impact of reductions in fertility and net migration on the population structure during 2020 was greater. To get a better picture of the potential impact of the pandemic on the age structure over the coming years, we therefore analyse for each scenario the following three ageing indicators that highlight different aspects of population ageing. First, the ageing index (population aged 65+ / population aged <16) is useful for capturing the effect of the increasing older population in relation to trends in fertility and the immigration of young children. Second, the double ageing ratio (population aged 85+ / population aged 65+) depicts the possible long-term effect of excess mortality during the pandemic on the population structure within the older age groups, as the oldest old were hit hardest. Third, the total dependency ratio (TDR = population aged <16 and 65+ / population aged 16–64) captures the changing burden of the dependent young and older population on the working-age population.
Results show that the ageing index would have increased from 1.26 in 2020 to 1.82 in 2031 under the No pandemic scenario ((a)) due to the baby boom generations reaching retirement age and, to a lesser extent, the fall in the number of people aged <16 caused by a reduction in the size of reproductive-age cohorts after 2024. Between 2020 and 2021, we see no change in the ageing index when the No pandemic scenario is compared with observed data: the excess mortality at older ages was ‘compensated’ by the reduction in the denominator due to lower immigration and fewer births. In the Short-impact scenario, we observe that the ageing index varies very little with respect to the No pandemic scenario over the course of the decade, although it is slightly higher in 2031. If the age-specific trends in demographic components follow the Medium- or Long-impact scenarios, the index will increase to 1.87 or 1.93, respectively, in 2031, again as a result of fewer births and lower net migration. In comparison, the ageing index is expected to rise to 1.96 according to the INE scenario.
Figure 7 (a) Ageing Index, (b) double ageing ratio, and (c) total dependency ratio: observed 2020–21 (January 1) and projected to 2031 (January 1) according to five scenarios, Spain
Notes: The population projection ends on 1 January 2031, while the projection of the demographic components ends on 31 December 2030. The INE projection category corresponds to the medium scenario of the 2020 projection.
Source: As for .
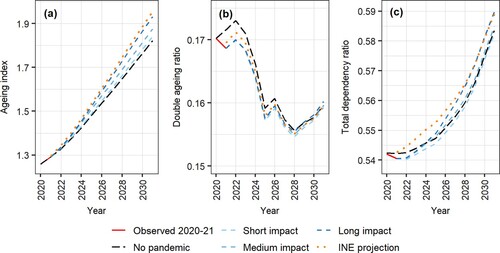
Regarding the double ageing ratio, after an initial decline due to Covid-related mortality in 2020, there are no major differences between scenarios throughout the projection period ((b)). If there had not been a pandemic, the double ageing ratio would have increased slightly from 0.170 to 0.173 between 2020 and 2022, after which it would have fallen to 0.159 in 2031. The declining, but seesawing, trend in all scenarios is due mostly to historical fertility patterns. While the population aged 85+ is expected to increase over the current decade, the progressive arrival of the baby boom generation (1958–77) at ages 65 years and older has a larger impact on the ratio. The small bump in 2026, the drop during the following two years, and the subsequent increase are due to circumstantial change in the population structure resulting from a sudden increase in births in 1940 (after the Spanish Civil War), a sharp drop during the 1941–42 post-war period, and a recuperation thereafter. Regarding the observed data between 2020 and 2021, the double ageing ratio decreased as a result of the excess mortality of the oldest old during the pandemic. This effect will clearly diminish over time due to the incorporation of new cohorts into the 85+ age group as well as because a large proportion of the older people who died prematurely in 2020 and 2021 as a consequence of Covid-19 would likely have died within the next 10 years anyway, given their high mortality. A harvesting effect during this period is unlikely, given the lack of evidence on a national scale of the excess deaths being followed by a period of fewer deaths than expected, even in the short term during the first wave of the pandemic (Rivera et al. Citation2020; Andrasfay and Goldman Citation2021; Cerqua et al. Citation2021). However, while few differences in the double ageing ratio can be discerned between the three pandemic scenarios, the expected level in the first years of the INE projection is slightly higher, as they project lower Covid-19-related excess mortality.
The TDR increases from 0.542 to 0.583 between 2020 and 2031 in the scenario without a pandemic ((c)). As the observed values show, between 2020 and 2021 there is a small decrease in dependency, due mainly to the excess mortality among the old-age population. This slightly lower level of dependency is maintained during the first years of each scenario, as the mortality effect of the pandemic is still noticed, especially in the Short-impact scenario. However, the decrease in immigration in the Short- and Medium-impact scenarios, together with a small increase in emigration in the latter, levels the TDRs to the No pandemic scenario by 2031. In the case of the Long-impact scenario, the TDR at the end of the projection period is higher than in the No pandemic scenario, reaching a value of 0.589 as the number of net migrants is much lower in comparison with the other two scenarios. The TDR of our Long-impact scenario converges to that of the INE scenario, although the level of dependency remains lower until 2027 due to the projected higher mortality from Covid-19 and lower decline in net international migration in the former.
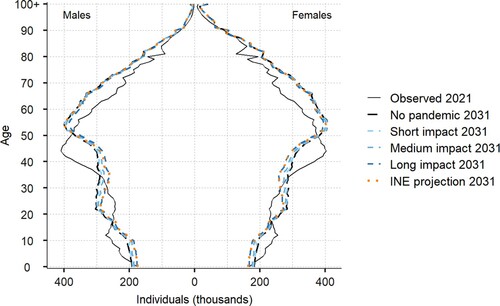
Lastly, one common way to inspect changes in the population structure is using population pyramids. As shows, a considerable reduction in the population aged <15 can be observed between 2020 and 2031, while the 15–34-year-old age group is expected to experience an increase in its size, the 35–49-year-olds a decrease, and the 50–84-year-olds a considerable increase in their relative proportion. The fact that the structure of the Spanish population is so unbalanced is the result of historical developments: increased longevity; a baby boom between the late 1950s and mid-1970s; a rapid fall in fertility since 1975, which reached an all-time low in the 1990s; and very high immigration between 2000 and 2008. Comparing the No pandemic scenario with the other scenarios, we see that there are practically no variations among the population aged 65+, meaning that the impact of Covid-19-related excess mortality on the population structure will likely be negligible in this age group in the medium term. Likewise, few differences can be observed between ages 50 and 64. In the case of the Short-impact scenario, there are no significant variations in the other age groups, except for a small reduction around age 10 due to fewer births as a result of declining fertility rates during 2020 and 2021. In the Medium- and Long-impact scenarios, we do observe an important reduction in the 20–44 age group compared with the No pandemic scenario due to a lower inflow of migrants and, to a lesser extent, an increase in emigration. According to these two scenarios, there will be 14.16 and 13.58 million people aged 20–44 in 2031, respectively, compared with 14.63 million if there had not been a pandemic. There will also be a reduction in the <10 age group due to fewer births as a result of lower fertility and a lower contribution of immigrants to the population of childbearing age. The age structure of the INE projection to 2031 shows similar results to our Long-impact scenario.
Figure 8 Population pyramid on 1 January 2021 and projected to 1 January 2031 according to five scenarios, Spain
Notes: The population projection ends on 1 January 2031, while the projection of the demographic components ends on 31 December 2030. The INE projection category corresponds to the medium scenario of the 2020 projection.
Source: As for .
Conclusions and discussion
Spain has been one of the most affected European countries in terms of excess mortality caused by the Covid-19 pandemic (WHO Citation2022; Aburto et al. Citation2022). According to our results, there were 69,738 deaths more than expected in 2020 if there had not been a pandemic, and that led to a decrease in life expectancy at birth of 1.5 years for men and 1.3 years for women. These figures are very close to estimates made by Aburto et al. (Citation2022), Esteve et al. (Citation2021), and Trias-Llimós et al. (Citation2020). According to official government data, there were 54,182 deaths due to Covid-19 in 2020 (National Center of Epidemiology Citation2022): close to 15,500 fewer deaths than our results showed. This finding raises three issues. First, the Spanish government may have under-reported deaths. Reporting of Covid-19 cases depends on the testing regime and definition of ‘Covid-19 death’. Particularly during the initial stages of the pandemic, deaths due to Covid-19 would have been missed because of limited testing availability, changing definitions, and inconsistent and incomplete reporting (Karanikolos and McKee Citation2020). Using excess mortality data avoids miscounting of deaths due to the under-reporting of other health conditions left untreated due to the pandemic (Malouche and Ben Romdhane Citation2020). At the same time, behavioural changes during the pandemic may also have led to fewer deaths from other causes, such as road traffic injuries (Karanikolos and McKee Citation2020). The observed excess mortality, therefore, provides an indication of the ‘net death toll’ of the pandemic.
Second, the saturation of the health system could have played a role in the postponement of treatment of other health conditions and produced an increase in deaths from other causes. The cause-specific data needed to pursue this interesting line of research have recently become available. Third, other studies have shown that Covid-19 can leave long-term sequelae, in particular dyspnoea (difficulty in breathing) (Shoucri et al. Citation2021). Although long Covid-19 does not itself result in death, research has shown that patients who were hospitalized or had existing comorbidities were more likely to die during the following months (Liu et al. Citation2021; Shoucri et al. Citation2021). However, the underlying cause of death may not necessarily have been (registered and coded as) Covid-19 (Singh Citation2021).
Despite the (false) baby boom heralded by some Spanish media as a consequence of home confinement, the observed TFR was only 1.19 in 2020 rather than the expected 1.25 had there not been a pandemic; this was equivalent to 23,300 fewer births. Although the number of births was already declining prior to the pandemic, by an annual average of 4 per cent between 2016 and 2019, births were 10 and 20 per cent lower in November and December 2020, respectively, compared with a year earlier, and even 21 per cent lower in January 2021 than in January 2020 (INE Citation2021). The collapse of the hospital system, possibility of infection, and health and economic uncertainty probably caused a number of couples to reconsider whether it was the right time to have children. Since March 2021, however, the number of births has been very similar to that of the previous two years, which might reflect a rebound following postponement during the very first months of the outbreak (Aassve et al. Citation2021; INE Citation2021).
Despite the increase in deaths and reduction in births, the most affected demographic component was immigration, with a decline of almost 263,100 individuals recorded. Moreover, this reduction was concentrated among young adults of working and reproductive age, affecting the population age structure and natural change potential, although the number of emigrants also declined by 77,700, thereby slightly offsetting the reduction in immigrants. It is clear that home confinement, border closures, and the poor economic situation have had a major impact on international migration, especially immigration. In addition, it is well known that immigration mitigates fertility decline because migrants are usually of childbearing age and their fertility tends to be higher than in the native population (Del Rey and Grande Citation2015). Hence, Spanish policymakers should pay attention to fertility consequences of both the decline in immigration and the acceleration of emigration during the pandemic and ensuing economic downturn, just as Sabater and Graham (Citation2019) recently advocated in the aftermath of the economic recession of 2008–14. As a result of these demographic changes, the overall population growth between 2020 and 2021, while remaining positive, declined considerably.
The evolution of the pandemic and its economic consequences during this decade will be decisive for the growth of the Spanish population and its demographic structure, as well as for the sustainability of the welfare system because the first baby boom cohorts will soon be entering the age of retirement. The excess mortality that took place in 2020 and 2021 as a result of the pandemic will have little impact on the population structure, levels of ageing, or the TDR in a decade’s time. However, the reduction in net migration will intensify the pressure of population ageing and increase the need for labour, especially in low- and middle-skilled jobs (Hooper Citation2019). The decline in net migration will have a greater impact in those areas where population shrinkage occurs, as they will show high levels of ageing and a low proportion of people of working and childbearing age. Although less significant in quantitative terms, a sustained decline in fertility levels will also have an impact. According to our Short-impact scenario, if in 2022 the net migration and fertility rates recover to the levels that we would expect if there had been no pandemic, the fundamental demographic events of 2020 and 2021 will have few repercussions on population growth and structure over the next 10 years. If the values of the No pandemic scenario are not recovered until 2025, the population will still increase, albeit with important reductions in the <10 and 20–39 age groups. In the most pessimistic Long-impact scenario (that assumes no recovery in the demographic components until 2030), the number of inhabitants will stagnate, and the above-mentioned age groups will be affected even more, and this will have repercussions for economic sustainability. Under this scenario, the TDR is set to increase faster than under the other scenarios, thus leading to a greater reduction in the effective number of taxpayers relative to beneficiaries if productivity and tax rates stay the same (Lee et al. Citation2014).
This paper has demonstrated how the pandemic affected mortality, fertility, and international migration in Spain during 2020. On one hand, our results show that immigration (rather than mortality or fertility) was hit the hardest and also that the reduction in this component could have an important impact on the demographic structure in a decade’s time. On the other hand, the disruption in births and deaths during 2020 and 2021 was lower and will barely affect the population size and structure in the coming years. Our results could be extrapolated to other ageing countries with low fertility and where international migration is the main component sustaining population growth. Regarding the limitations of this study, it is common knowledge that population projections always present uncertainty, especially regarding migration (Bongaarts and Bulatao Citation2000; Abel Citation2018). In the case of our estimates from the No pandemic scenario for 2020, this uncertainty is low because it pertains to only a one-year interval, especially for the mortality and fertility components. However, projecting to 2031 presents a greater degree of uncertainty. This is why we performed a sensitivity analysis on the No pandemic and Medium-impact scenarios by decreasing and increasing by 10 per cent the projected change in 2030 in total fertility, growth in life expectancy, emigration, and immigration (see supplementary material). In terms of absolute numbers, variation in net migration, the component with the highest uncertainty, showed the greatest impact on population change, followed by fertility, while the sensitivity analysis indicated almost no effect on mortality outcomes. That is why the results of this (and any other) projection should be taken as a simulation exercise that poses different hypothetical population scenarios, in this case in the context of the pandemic.
Finally, we would like to point out that although we used the same methods as the INE for comparative purposes, we are aware of alternative methods of producing scenario-based forecasts. For instance, Keilman (Citation2020) advocates (additionally) computing probabilistic population forecasts of fertility, mortality, and international migration because other projections based on scenarios do not quantify uncertainty. The aim of a probabilistic forecast is not so much to present estimates of future trends that are more accurate than from a deterministic forecast but rather to give the user a more complete picture of prediction uncertainty. Keilman particularly recommends taking a Bayesian approach when combining expert opinions with empirical data (see also Bijak Citation2010; Schmertmann et al. Citation2014; Kontis et al. Citation2017).
Supplementary Material
Download PDF (370.1 KB)Disclosure statement
No potential conflict of interest was reported by the authors.
Notes
1 Miguel González-Leonardo is based at the International Institute for Applied Systems Analysis (Wittgenstein Centre for Demography and Global Human Capital), and Jeroen Spijker is based at the Centre d’Estudis Demogràfics. Please direct all correspondence to Miguel González-Leonardo, International Institute for Applied Systems Analysis, Schloßpl. 1, 2361 Laxenburg, Austria; or by E-mail: [email protected]
2 The authors gratefully acknowledge funding from IIASA and the National Member Organizations that support the institute. Funding for this work was also provided by the European Commission’s Horizon 2020 Framework Programme under H2020 Excellent Science and H2020 European Research Council (grant number ERC-2019-CoG-GA864616-HEALIN) and by the Ministerio de Ciencia e Innovación (grant numbers PID2020-113665RB-I00, PID2020-113934RB-I00, and RYC-2013-14851).
References
- Aassve, A., N. Cavalli, L. Mencarini, S. Plach, and S. Sanders. 2021. Early assessment of the relationship between the COVID-19 pandemic and births in high-income countries, Proceedings of the National Academy of Sciences 118(36): e2105709118. https://doi.org/10.1073/pnas.2105709118
- Abel, G. J. 2018. Non-zero trajectories for long-run net migration assumptions in global population projection models, Demographic Research 38(54): 1635–1662. https://doi.org/10.4054/DemRes.2018.38.54
- Aburto, J. M., J. Schöley, I. Kashnitsky, L. Zhang, C. Rahal, T. I. Missov, M. C. Mills, et al. 2022. Quantifying impacts of the COVID-19 pandemic through life-expectancy losses: A population-level study of 29 countries, International Journal of Epidemiology 51(1): 63–74. https://doi.org/10.1093/ije/dyab207
- Andrasfay, T. and N. Goldman. 2021. Reductions in 2020 US life expectancy due to COVID-19 and the disproportionate impact on the Black and Latino populations, Proceedings of the National Academy of Sciences 118(5): e2014746118. https://doi.org/10.1073/pnas.2014746118
- Ayoubkhani, D., K. Khunti, V. Nafilyan, B. Maddox, T. Humberstone, I. Diamond, and A. Banerjee. 2021. Post-COVID syndrome in individuals admitted to hospital with COVID-19: Retrospective cohort study, BMJ 372(693): 1–10. https://doi.org/10.1136/bmj.n693
- Basellini, U., D. Alburez-Gutierrez, E. Del Fava, D. Perrotta, M. Bonetti, G. C. Camarda, and E. Zagheni. 2021. Linking excess mortality to mobility data during the first wave of COVID-19 in England and Wales, SSM – Population Health 14: 1–18. https://doi.org/10.1016/j.ssmph.2021.100799
- Bhadra, A., A. Mukherjee, and K. Sarkar. 2021. Impact of population density on COVID-19 infected and mortality rate in India, Modeling Earth Systems and Environment 7: 623–629. https://doi.org/10.1007/s40808-020-00984-7
- Bijak, J. 2010. Forecasting International Migration in Europe: A Bayesian View, Vol. 24. Berlin: Springer Science & Business Media.
- Billari, F. C. and G. Dalla-Zuanna. 2012. Is replacement migration actually taking place in low fertility countries?, Genus 67(3): 105–123. https://www.jstor.org/stable/genus.67.3.105
- Boertien, D., J. M. Aburto, I. Permanyer, A. López Gay, and A. Esteve. 2021. La influencia de los hogares en la propagación de COVID-19 a través de una simulación [The influence of households on the spread of COVID-19 using a simulation], Coyuntura Demográfica 19: 95–101. http://coyunturademografica.somede.org/la-influencia-de-los-hogares-en-la-propagacion-de-COVID-19-a-traves-de-una-simulacion/
- Bongaarts, J. and R. A. Bulatao. 2000. Beyond Six Billion: Projecting the World’s Population, 1st ed. Washington, DC: National Academies Press.
- Bramajo, O., M. Infantino, R. U. Venegas, W. D. Cardona-Maya, and P. Richly. 2020. The role of population structure when measuring COVID-19 impact across countries, medRxiv. https://www.medrxiv.org/content/medrxiv/early/2020/12/02/2020.11.30.20239947.full.pdf
- Bulatao, R. A., E. Bos, P. W. Stephans, and M. T. Vu. 1989. Projecting Mortality for all Countries. PPR Working Paper Series. Washington, DC: World Bank. https://documents1.worldbank.org/curated/en/823691468765597525/pdf/multi0page.pdf
- Cannan, E. 1895. The probability of a cessation of the growth of population in England and Wales during the next century, The Economic Journal 5(20): 505–515. https://doi.org/10.2307/2956626
- Cerqua, A., R. Di Stefano, M. Letta, and S. Miccoli. 2021. Was there a COVID-19 harvesting effect in northern Italy?, in C. Bernini and S. Emili (eds), Regions Between Challenges and Unexpected Opportunities. Scienze Regionali No. 61. Milan: FrancoAngeli, pp. 15–33.
- Charles-Edwards, E., T. Wilson, A. Bernard, and P. Wohland. 2021. How will COVID-19 impact Australia’s future population? A scenario approach, Applied Geography 134: 102506. https://doi.org/10.1016/j.apgeog.2021.102506
- Del Rey, A. and R. Grande. 2015. A longitudinal analysis of reproductive behavior, in A. Domingo, A. Sabater and R. Verdugo (eds), Demographic Analysis of Latin American Immigrants in Spain: From Boom to Bust. Cham: Springer. https://doi.org/10.1007/978-3-319-12361-5
- Esteve, A., A. Blanes, and A. Domingo. 2021. Consecuencias demográficas de la COVID-19 en España: entre la novedad excepcional y la reincidencia estructural [Demographic consequences of COVID-19 in Spain: Between exceptional novelty and structural recurrence], Panorama Social 33: 9–23. https://www.funcas.es/wp-content/uploads/2021/07/Panorama-Social-33.pdf
- Esteve, A., I. Permanyer, D. Boertien, and J. W. Vaupel. 2020. National age and coresidence patterns shape COVID-19 vulnerability, Proceedings of the National Academy of Sciences 117(28): 16118–16120. https://doi.org/10.1073/pnas.2008764117
- Ghislandi, S., R. Muttarak, M. Sauerberg, and B. Scotti. 2020. News from the front: Excess mortality and life expectancy in two major epicentres of the COVID-19 pandemic in Italy, Vienna Yearbook of Population Research, (20). https://doi.org/10.1553/populationyearbook2022.res2.1
- Guadagno, L. 2020. Migrants and the COVID-19 Pandemic: An Initial Analysis. Geneva: International Organization for Migration. https://www.iom.int/sites/default/files/documents/mrs-60.pdf
- Hooper, K. 2019. Spain’s Labour Migration Policies in the Aftermath of Economic Crisis. Brussels: Migration Policy Institute Europe. https://www.migrationpolicy.org/research/spain-labor-migration-aftermath-economic-crisis
- INE. 2018. Population Projections of Spain 2018-2068. Methodology. Madrid: Instituto Nacional de Estadística. https://www.ine.es/en/metodologia/t20/meto_propob_2018_2068_en.pdf
- INE. 2020. Proyecciones de Población 2020-2070 [Population Projections 2020-2070]. Metodología. Madrid: Instituto Nacional de Estadística. https://www.ine.es/metodologia/t20/meto_propob_2020_2070.pdf
- INE. 2021. Estadística experimental – Estimación Mensual de Nacimientos (EMN) [Experimental Statistics - Monthly Birth Estimates]. Notas de Prensa. Madrid: Instituto Nacional de Estadística. https://www.ine.es/prensa/experimental_emn.pdf
- IOM. 2020. COVID-19 Analytical Snapshot #3: Travel Restrictions & Mobility. Understanding the Migration & Mobility Implications of COVID-19. Geneva: International Organization for Migration. https://www.iom.int/sites/default/files/our_work/ICP/MPR/COVID-19_analytical_snapshot_3_-_travel_restrictions_and_mobility.pdf
- Karanikolos, M. and M. McKee. 2020. How comparable is COVID-19 mortality across countries?, Eurohealth 26(2): 45–50. https://apps.who.int/iris/handle/10665/336295
- Keilman, N. 2020. Uncertainty in population forecasts for the twenty-first century, Annual Review of Resource Economics 12: 449–470. https://doi.org/10.1146/annurev-resource-110319-114841
- Kim, D. and Y. J. Lee. 2022. Vaccination strategies and transmission of COVID-19: Evidence across advanced countries, Journal of Health Economics 82: 102589. https://doi.org/10.1016/j.jhealeco.2022.102589
- Kontis, V., J. E. Bennett, C. D. Mathers, G. Li, K. Foreman, and M. Ezzati. 2017. Future life expectancy in 35 industrialised countries: Projections with a Bayesian model ensemble, The Lancet 389(10076): 1323–1335. https://doi.org/10.1016/S0140-6736(16)32381-9
- Lee, R. D. 2011. The outlook for population growth, Science 333(6042): 569–573. https://doi.org/10.1126/science.1208859
- Lee, R. D., A. Mason, Members of the NTA Network, R. Lee, A. Mason, E. Amporfu, C.-B.An, et al. 2014. Is low fertility really a problem? Population aging, dependency, and consumption, Science 346(6206): 229–234. https://doi.org/10.1126/science.1250542
- Liu, B., D. Jayasundara, V. Pye, T. Dobbins, G. J. Dore, G. Matthews, J. Kaldor, et al. 2021. Whole of population-based cohort study of recovery time from COVID-19 in New South Wales Australia, The Lancet Regional Health - Western Pacific 12: 100193. https://doi.org/10.1016/j.lanwpc.2021.100193
- López-Gay, A., J. Spijker, H. V. S. Cole, A. G. Marques, M. Triguero-Mas, I. Anguelovski, M. M. Marí-Dell’Olmo, et al. 2022. Sociodemographic determinants of intraurban variations in COVID-19 incidence: The case of Barcelona, Journal of Epidemiology and Community Health 76: 1–7. https://doi.org/10.1136/jech-2020-216325
- Luppi, F., B. Arpino, and A. Rosina. 2020. The impact of COVID-19 on fertility plans in Italy, Germany, France, Spain, and the United Kingdom, Demographic Research 43(47): 1399–1412. https://doi.org/10.4054/DemRes.2020.43.47
- Malouche, D. and H. Ben Romdhane. 2020. Estimating excess mortality associated with COVID-19 pandemic: A 151 cross-countries study, SSRN Papers 150. https://doi.org/10.2139/ssrn.3731481
- Martínez-Guzmán, G., M. M. Bustillo-Díaz, A. Rangel-Huerta, G. Juárez-Díaz, A. Ata-Pérez, N. Quiroz-Hernández, R. González-Velázquez, et al. 2015. Logistic methods in calculating mortality index in Hidalgo México, Applied Mathematics 6(8): 1193–1199. https://doi.org/10.4236/am.2015.68110
- Matysiak, A., T. Sobotka, and D. Vignoli. 2021. The great recession and fertility in Europe: A subnational analysis, European Journal of Population 37(1): 29–64. https://doi.org/10.1007/s10680-020-09556-y
- Modig, K., A. Ahlbom, and M. Ebeling. 2021. Excess mortality from COVID-19: Weekly excess death rates by age and sex for Sweden and its most affected region, European Journal of Public Health 31(1): 17–22. https://doi.org/10.1093/eurpub/ckaa218
- Mogi, R. and J. Spijker. 2022. The influence of social and economic ties to the spread of COVID-19 in Europe, Journal of Population Research, 1–17. https://doi.org/10.1007/s12546-021-09257-1
- National Center of Epidemiology. 2022. Incidencias acumuladas e indicadores de transmisibilidad [Cumulative incidences and transmissibility indicators]. https://cnecovid.isciii.es/covid19/resources/casos_hosp_uci_def_sexo_edad_provres.csv
- Newsham, N. and F. Rowe. 2021. Projecting the demographic impact of Syrian migration in a rapidly ageing society, Germany, Journal of Geographical Systems 23: 231–261. https://doi.org/10.1007/s10109-018-00290-y
- Nicola, M., Z. Alsafi, C. Sohrabi, A. Kerwan, A. Al-Jabir, C. Iosifidis, M. Agha, et al. 2020. The socio-economic implications of the coronavirus pandemic (COVID-19): A review, International Journal of Surgery 78: 185–193. https://doi.org/10.1016/j.ijsu.2020.04.018
- Omer, S. B. and P. N. Malani. 2022. Booster vaccination to prevent COVID-19 in the era of Omicron: An effective part of a layered public health approach, JAMA 327(7): 628–629. https://doi.org/10.1001/jama.2022.0892
- Rathnayake, D., M. Clarke, and V. I. Jayasinghe. 2021. Health system performance and health system preparedness for the post-pandemic impact of COVID-19: A review, International Journal of Healthcare Management 14(1): 250–254. https://doi.org/10.1080/20479700.2020.1836732
- Rees, P., M. Bell, O. Duke-Williams, and M. Blake. 2000. Problems and solutions in the measurement of migration intensities: Australia and Britain compared, Population Studies 54(2): 207–222. https://doi.org/10.1080/713779082
- Rivera, R., J. Rosenbaum, and W. Quispe. 2020. Excess mortality in the United States during the first three months of the COVID-19 pandemic, Epidemiology and Infection 148: E264. https://doi.org/10.1017/S0950268820002617
- Rogers, A. 1975. Introduction to Multiregional Mathemetical Demography. New York: John Wiley
- Sabater, A. and E. Graham. 2019. International migration and fertility variation in Spain during the economic recession: A spatial Durbin approach, Applied Spatial Analysis and Policy 12(3): 515–546. https://doi.org/10.1007/s12061-018-9255-9
- Schmertmann, C., E. Zagheni, J. R. Goldstein, and M. Myrskylä. 2014. Bayesian forecasting of cohort fertility, Journal of the American Statistical Association 109(506): 500–513. https://doi.org/10.1080/01621459.2014.881738
- Sheikh, A., J. McMenamin, B. Taylor, and C. Robertson. 2021. SARS-CoV-2 Delta VOC in Scotland: Demographics, risk of hospital admission, and vaccine effectiveness, The Lancet 397(10293): 2461–2462. https://doi.org/10.1016/S0140-6736(21)01358-1
- Shoucri, S., M. L. Purpura, C. DeLaurentis, M. A. Adan, D. A. Theodore, A. L. Irace, S. Y. Robbins-Juarez, et al. 2021. Characterising the long-term clinical outcomes of 1190 hospitalised patients with COVID-19 in New York City: A retrospective case series, BMJ Open 11(6): e049488. https://doi.org/10.1136/bmjopen-2021-0494
- Singh, B. 2021. International comparisons of COVID-19 deaths in the presence of comorbidities require uniform mortality coding guidelines, International Journal of Epidemiology 50(2): 373–377. https://doi.org/10.1093/ije/dyaa276
- Tilly, C. 2011. The impact of the economic crisis on international migration: A review, Work, Employment and Society 25(4): 675–692. https://doi.org/10.1177/0950017011421799
- Trias-Llimós, S., T. Riffe, and U. Bilal. 2020. Monitoring life expectancy levels during the COVID-19 pandemic: Example of the unequal impact of the first wave on Spanish regions, PLoS ONE 15(11): e0241952. https://doi.org/10.1371/journal.pone.0241952
- UNDESA (United Nations Department of Economic and Social Affairs). 2019. World Population Prospects: The 2019 Revision. New York.
- UNDESA (United Nations Department of Economic and Social Affairs). n.d. Model Life Tables. https://www.un.org/development/desa/pd/data/model-life-tables (accessed: 27 October 2022)
- Villarreal, A. 2014. Explaining the decline in Mexico-U.S. migration: The effect of the Great Recession, Demography 51(6): 2203–2228. https://doi.org/10.1007/s13524-014-0351-4
- Weinberger, D. M., J. Chen, T. Cohen, F. W. Crawford, F. Mostashari, D. Olson, V. E. Pipzer, et al. 2020. Estimation of excess deaths associated with the COVID-19 pandemic in the United States, March to May 2020, JAMA Internal Medicine 180(10): 1336–1344. https://doi.org/10.1001/jamainternmed.2020.3391
- Whelpton, P. K. 1936. An empirical method of calculating future population, Journal of the American Statistical Association 31(195): 457–473. https://doi.org/10.2307/2278370
- WHO. 2022. WHO coronavirus (COVID-19) dashboard. https://covid19.who.int/table
- Willekens, F., A. Rogers. 1978. Spatial Population Analysis: Methods and Computer Programs. Research Report 78–18, Laxenburg, Austria: International Institute for Applied Systems Analysis.
- Wilson, T., J. Temple, and E. Charles-Edwards. 2021. Will the COVID-19 pandemic affect population ageing in Australia?, Journal of Population Research, 1–15. https://doi.org/10.1007/s12546-021-09255-3
- Zazueta-Borboa, J. D. and M. E. Jaramillo-Molina. 2020. El impacto desigual de la pandemia: Determinantes socioeconómicas y de salud en las tasas de fatalidad del COVID19 en México [The unequal impact of the pandemic: Socioeconomic and health determinants of COVID-19 fatality rates in Mexico], Revista de Adminitración Pública 55(2): 91–108. https://inap.mx/wp-content/uploads/2020/12/rap152.pdf