
 ?Mathematical formulae have been encoded as MathML and are displayed in this HTML version using MathJax in order to improve their display. Uncheck the box to turn MathJax off. This feature requires Javascript. Click on a formula to zoom.
Abstract
Effective government services rely on accurate population numbers to allocate resources. In Colombia and globally, census enumeration is challenging in remote regions and where armed conflict is occurring. During census preparations, the Colombian National Administrative Department of Statistics conducted social cartography workshops, where community representatives estimated numbers of dwellings and people throughout their regions. We repurposed this information, combining it with remotely sensed buildings data and other geospatial data. To estimate building counts and population sizes, we developed hierarchical Bayesian models, trained using nearby full-coverage census enumerations and assessed using 10-fold cross-validation. We compared models to assess the relative contributions of community knowledge, remotely sensed buildings, and their combination to model fit. The Community model was unbiased but imprecise; the Satellite model was more precise but biased; and the Combination model was best for overall accuracy. Results reaffirmed the power of remotely sensed buildings data for population estimation and highlighted the value of incorporating local knowledge.
Introduction
Census omissions due to geographic inaccessibility disproportionately affect Indigenous populations and cultural minorities as well as vulnerable populations living with insecurity due to armed conflict (Fein Citation1990; Car-Hill Citation2013; Dias and Verona Citation2018). Incomplete enumeration of these populations creates challenges for planning essential services, such as healthcare, education, and housing. Because achieving a full-coverage national population census is challenging even for the most developed countries, there is an increasing trend towards less costly methods that rely on administrative records and household surveys to supplement census field enumerations (Ericksen and Kadane Citation1986; Myrskyla Citation1999; Jardim Citation2001; Valente Citation2010). Even post-enumeration surveys (Hogan and Wolter Citation1988; Breiman Citation1994; UN Citation2010), which are used to estimate census omissions, are themselves dependent on access to regions where census coverage is being assessed. When entire regions are difficult to access and administrative records are incomplete, these approaches may be less effective for assessing coverage errors (which are needed to provide accurate and complete demographic estimates).
In situations where census counts are outdated or incomplete, modelled population estimates can provide a relatively low-cost alternative for obtaining up-to-date population estimates (UNFPA Citation2020). This provides stop-gap support in planning essential services for undercounted populations, with the ultimate aim of informing future census planning to achieve full-coverage enumeration. There is a degree of uncertainty associated with all modelled population estimates—dependent on population characteristics, input data, and modelling strategy—and recent work has focused on implementing statistical methods that accurately account for this estimation uncertainty (Leasure et al. Citation2020). Building on previous methods for modelled population estimates (Mossoux et al. Citation2018; Wardrop et al. Citation2018; Weber et al. Citation2018; Engstrom et al. Citation2020), these hierarchical Bayesian methods have been extended to use various types of input data, ranging from routine household surveys to satellite-derived building footprints and other geospatial data (Dooley et al. Citation2021; Boo et al. Citation2022). The increasing availability of remotely sensed maps of human settlements and building footprints is providing a valuable source of information for estimating populations with fine-grained spatial resolution, particularly in regions that are difficult to access (Palacios-Lopez et al. Citation2021; Kashyap et al. Citation2022).
In Colombia there are areas, mainly in the Amazonía, Orinoquía, and Pacífica regions, which are characterized by their poor accessibility, low population density, large territorial extent, and dense forest. In addition, some have security problems, mostly because of armed conflict. The sum of these conditions results in greater challenges for both the planning and operation of routine household surveys and the decennial Population and Housing Unit Census of Colombia. In addition, administrative records in these areas are often incomplete, and the administrative boundaries between municipalities are not well defined. In response to these obstacles, the National Administrative Department of Statistics in Colombia (DANE) implemented a data collection method called ‘routes’ (rutas in Spanish) for the 2018 Population and Housing Unit Census.
The routes method consisted of working groups travelling through the territory, along rivers, bridleways, or logging roads that encompassed an area of influence containing each of the existing communities and settlements. The routes were developed using information from a series of social cartography workshops (see Paulston and Liebman Citation1994 for a discussion of the social cartography concept) and other sources, such as the third National Agricultural Census, territorial planning documents, and administrative development plans (DANE Citation2014, Citation2021a, Citation2021b, Citation2022a). The social cartography workshops collected information directly from community representatives about the locations and basic characteristics of difficult-to-access population settlements: for instance, the approximate numbers of housing units and people (DANE Citation2014).
We combined community knowledge obtained from social cartography workshops with building maps derived from satellite imagery, as well as other geospatial covariates, to estimate total population sizes for locations in Colombia that were not fully accessible to census enumerators; this affected mainly enumerations of minority ethnic groups in remote locations. Our primary objectives were to:
Estimate total population sizes and numbers of buildings for each census enumeration area not fully covered during the census;
Provide robust estimates of uncertainty with our estimates; and
Assess the relative contributions of local knowledge and remote-sensing observations to the accuracy of modelled population estimates.
To achieve these objectives, we developed a bespoke hierarchical Bayesian statistical model that was trained using full-coverage census enumerations from nearby areas.
Methods
This work was approved by the Ethics and Research Governance Online committee at the University of Southampton (ERGO 61486 and 72234). All data were aggregated and fully anonymized so that individuals could not be identified at any stage of analysis. The data and Bayesian model code for all analyses are provided at doi.org/10.17605/OSF.IO/DW4VR (Sanchez-Cespedes et al. Citation2022).
Data
Population and housing census
We used counts of people and dwellings from the 2018 Population and Housing Unit Census of Colombia, primarily from the Amazonía, Orinoquía, and Pacífica regions. In the census, municipalities from the study regions were divided into operational coordination areas called routes, and each of these was divided into operational units, which we refer to here as census enumeration areas. The enumeration areas were the spatial unit of analysis for our statistical models. In total, there were 394 routes, consisting of 1,302 enumeration areas spanning 145 municipalities (out of 1,121 nationally) and 23 administrative departments (out of 33 nationally). On average (standard deviation in parentheses) there were 3.3 (±1.9) enumeration areas per route, 8.9 (±11.3) per municipality, and 56.6 (±68.4) per department.
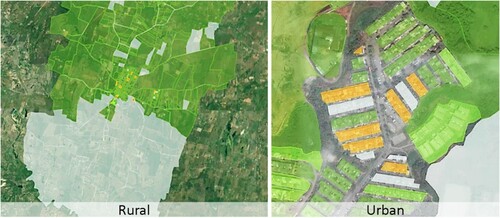
During the census fieldwork, the number of enumerated properties was verified and controlled by a geographic monitoring system that assigned a colour to each enumeration area according to the percentage of expected properties from the census frame that were actually enumerated by census workers (DANE Citation2014, Citation2021a, Citation2021b, Citation2022a). Enumeration areas with 90 per cent or more on this indicator were coded as green, those in a range of 0–90 per cent were coded as orange, and units that were not visited were coded as grey (). We used the green enumeration areas (n = 508) to train the models because these areas were considered to be fully enumerated, whereas the orange and grey enumeration areas (n = 628 and 166, respectively) were not fully enumerated and hence needed estimates of total population.
Figure 1 Maps showing percentage of expected properties from the census frame that were actually enumerated by census workers: rural and urban areas, Colombia 2018
Notes: Left-hand panel: In rural areas, census enumeration areas in which 90 per cent or more of expected properties were enumerated during census fieldwork are shown in green, areas where 0–90 per cent were enumerated are shown in orange, and areas where no property was enumerated are shown in grey. Right-hand panel: In urban areas, colours are the same as for rural areas, but the indicator was the percentage of expected dwellings in a census enumeration area.
Source: The methodology for determining census coverage is described by DANE (Citation2022a). The image is taken from the Geovisor tool used by DANE to monitor census coverage.
Social cartography workshops
Ethnic minority groups occupy approximately 35 million hectares, one-third of the national territory of Colombia, with many living in regions that are difficult to access. To involve these groups in the census activities, DANE implemented 90 social cartography workshops with ethnic community representatives—66 with Indigenous communities and 24 with Afro-Colombian communities—which were held between 2011 and 2014 for the National Agricultural Census and updated in 2016 and 2017 for the 2018 Population and Housing Unit Census (DANE Citation2014, Citation2021a, Citation2021b, Citation2022a). The objective of the social cartography workshops was to establish the locations of ethnic minority communities and their characteristics to support operational planning for the census (e.g. number of census takers and supervisors, costs, and times). To achieve successful community engagement, 14 separate agreements were reached between DANE, Afro-Colombian organizations, and Indigenous organizations (DANE Citation2014).
The ethnic minority organizations oversaw the logistical aspects of the social cartography workshops and summoned community representatives. The workshop participants were selected by each organization as community leaders who were knowledgeable about the populations in these areas. The organizations guided participants in producing estimates of numbers of dwellings, families, and people living in each community (, left-hand panel), alongside documenting logistical constraints for census enumerators in accessing these remote communities. During the workshops, the DANE team led cartographic exercises to help participants locate their communities on the map. Working in small groups based on Indigenous reservations, community councils, and geographic zones, the groups mapped communities and estimated numbers of dwellings, families, and people by reaching consensus within their small groups. These exercises identified and located 12,067 communities: 8,010 Indigenous, 3,200 Afro-Colombian, and 857 colonist. This information was used to construct the sampling frame for the census in these remote areas, alongside information from the 2014 National Agricultural Census and municipal development plans (DANE Citation2021a, Citation2021b, Citation2022a).
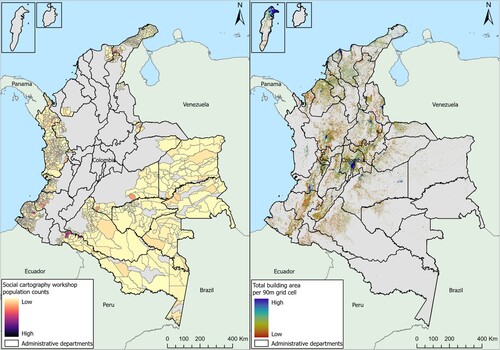
Figure 2 Maps of the study area in Colombia, 2018, showing two important predictor variables: Left-hand panel shows community-based estimates of population size in each enumeration area; Right-hand panel shows remotely sensed building coverage for 90 m pixels
Source: National boundaries were obtained from Global Administrative Areas (GADM Citation2019) and the subnational boundaries from DANE (Citation2022b). The maps were created using ESRI ArcGIS pro v.2.5. Community-based estimates of population size in each enumeration area were obtained from social cartography workshops. Remotely sensed building coverage for 90 m pixels was obtained from World Settlement Footprint 3D.
Remotely sensed building coverage (hectares)
We used estimates of total building area per 90 m grid cell, obtained from World Settlement Footprint 3D (, right-hand panel; Esch et al. Citation2020; Esch et al. Citation2022). This provided essential information about where buildings were located in these remote areas and gave an indication of how many buildings were likely in each location. These data were derived from Sentinel-1 and Sentinel-2 satellite imagery collected at 10 m spatial resolution between 2017 and 2019 with full coverage of Colombia, in combination with 12 m digital elevation data and radar imagery collected by the TanDEM-X mission.
The estimated building areas were validated using building models with very high resolution (<50 cm), which are available for 19 regions worldwide (Esch et al. Citation2022). The accuracy assessments showed a slight bias towards overestimation globally, with mean errors (ME) ranging from −6.48 to 12.99 per cent. Cartagena, Colombia, was included as one of the validation sites: its estimated building areas were the least biased of all validation sites, with an ME of 0.29 per cent. Building area estimates were also the most accurate in Cartagena with a mean absolute error (MAE) of 6.52 per cent and root mean squared error (RMSE) of 8.98 per cent. For comparison, MAE ranged from 6.52 to 17.29 per cent and RMSE ranged from 8.98 to 23.79 per cent globally. It should be noted that most of the validation sites were urban areas, whereas our study was focused on remote rural communities. Two of the validation sites were rural areas of Bavaria, Germany (ME = 0.93 per cent, MAE = 6.79 per cent, RMSE = 10.24 per cent), and Gyeonggi, South Korea (ME = 3.06 per cent, MAE = 9.93 per cent, RMSE = 14.19 per cent), which were below or near the average accuracy values among the validation sites.
Other geospatial covariates
We included a set of six additional geospatial covariates that had full coverage across the study area and were likely to be correlated with population densities. Our final set of covariates was selected from a larger set of covariates based on expert opinion and avoiding the inclusion of correlated covariates in the model. The six geospatial covariates, , that we selected were: (1) school density; (2) poverty index; (3) elevation; (4) night-time lights; (5) distance to populated centres; and (6) total area of the census enumeration area. Covariates were defined as the mean values within each enumeration area (except for (6)); these were then log transformed, scaled, and centred.
School densities were calculated for every 100 m grid square based on school locations obtained from the Ministry of National Education of Colombia. The poverty index represented the proportion of households in each route that were determined to have unsatisfied basic needs (INDEC Citation1984; Feres and Mancero Citation2001) based on their responses to the census questionnaire (DANE Citation2020). Digital elevation data were obtained at 30 m resolution from NASA’s Shuttle Radar Topography Mission (Farr et al. Citation2007) via Google Earth Engine (Gorelick et al. Citation2017). Night-time lights were obtained at 500 m resolution from the Visible Infrared Imaging Radiometer Suite (VIIRS; Elvidge et al. Citation2017) via the Google Earth Engine image collection ‘NOAA/VIIRS/DNB/MONTHLY_V1/VCMSLCFG’. Monthly night-time lights values were averaged to give a yearly value for 2018. Distances to populated city centres were calculated as straight-line distances to city centroids from the centroid of each census enumeration area. Geospatial analyses were conducted using ArcGIS software (Esri Citation2017).
Statistical analysis
We chose a hierarchical Bayesian modelling framework to take advantage of its flexibility to develop bespoke model structures for our data and also to account for uncertainty in population estimates. Accounting for uncertainty is essential for any population estimates in these remote areas where information is scarce, because the uncertainty intervals may provide important context when using population estimates for decision-making (e.g. planning government services, health initiatives, household surveys, and census activities).
We compared four hierarchical Bayesian models using a consistent base model structure and set of geospatial predictor variables across models. We varied whether or not we included additional predictors derived from the social cartography workshops and remotely sensed buildings data, to isolate the contributions of these two sources towards improving model fit. These were all hierarchical models with two levels: one level to estimate the number of buildings and a second level to estimate the total population (i.e. aggregate counts for each enumeration area, not building-specific estimates). The directed acyclic graph () illustrates both sub-models and relationships between all parameters and data in the model ( and ). Models were fitted using training data from 489 census enumeration areas (out of 508 green areas), selected because they were fully enumerated during the census, hosted social cartography workshops, and were located in regions where some enumeration areas were not fully enumerated. This approach included an unavoidable assumption that relationships between predictors and populations were the same in enumerated areas as in under-covered areas.
Figure 3 Directed acyclic graph (DAG) showing relationships between data (squares) and parameters (circles)
Notes: The hierarchical model structure has a sub-model to estimate counts of buildings (B) that feeds into a sub-model of population (P). Solid lines indicate stochastic relationships, while dashed lines indicate deterministic relationships. Black-filled nodes were not included in every model. Key parameters included people per building () and buildings per hectare (
). Parameters and data are defined in Tables 1 and 2.
Source: Authors’ own.
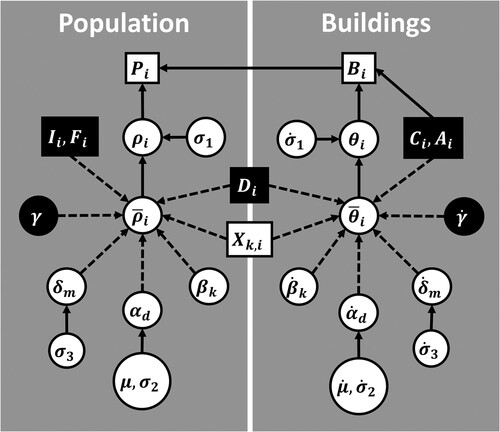
Table 1 Definitions of symbols for data
Table 2 Definitions of symbols for parameters
Base model
The Base model for total population, , in enumeration area
was:
(1a)
(1a) where
is the number of buildings (occupied or not) and
is the average number of people per building (log scale). We included a log-normal regression on
with a random intercept by administrative department,
, and municipality,
, along with the effects,
, of six geospatial covariates,
, selected a priori (). The random intercept by department
estimates the average number of people per building (log scale) for department
(assuming covariates equal zero), while the term
estimates deviations from this average for each municipality,
, within a department. The residual variance term
quantifies variation in
(people per building) that is not explained by the model. The priors for all models are provided in a separate subsection later.
The Base model for buildings, , was:
(1b)
(1b) where
is the total area (hectares) of enumeration area
, and
is the average number of buildings per hectare (log scale). The remaining parameters are comparable to those in population sub-model (1a), and this sub-model includes the same set of geospatial covariates,
. The number of buildings,
, was observed during the census in accessible areas, and the model estimated this parameter for inaccessible areas. We include a dot above the parameter symbols to distinguish them from population sub-model (1a).
Our three additional models differed in whether or not they included local knowledge from community workshops, remotely sensed building coverage from satellite imagery, or both. One of the key challenges was estimating the number of buildings , and we had several resources at our disposal to inform this portion of the model. The census recorded counts of buildings, although with incomplete coverage in some areas. We also had community-based estimates of the number of dwellings,
, from the social cartography workshops, as well as satellite-based measurements of building coverage,
.
Community-based model
This model used information gathered from the social cartography workshops to help inform the models of population and buildings:
(2a)
(2a) where
, and
, are the numbers of individuals, dwellings, and families, respectively, reported to be in enumeration area
during the social cartography workshops. We used these reports to help estimate average numbers of people per building,
.
The Community model estimated building counts, , as a function of the community-based estimates of dwellings,
, and the total area,
, of each enumeration area:
(2b)
(2b) where
is defined as the number of buildings
per hectare
. Note that the full specifications for random intercept parameters
and
are not shown here, but they were the same as in the Base model.
Satellite-based model
This model used the Base model for total population:
(3a)
(3a)
The number of buildings, , was estimated as a function of the remotely sensed building coverage,
, and the total area,
, of each enumeration area:
(3b)
(3b) Notice that unlike in the Community model, building density,
, is now defined as the building count per hectare of building coverage,
, rather than the building count per total area of the enumeration area,
(i.e. like the Community model parameter
). The satellite-based estimates of building coverage strongly constrain the portion of each enumeration area where buildings may be present.
Combined model
This model was the same as the Community model for estimating total population:
(4a)
(4a) where
, and
, are numbers of individuals, dwellings, and families reported during the social cartography workshop to be within enumeration area
.
The building sub-model combined community-based estimates of dwellings, , with the satellite-based estimates of building coverage,
, in an attempt to better approximate the observed total building counts,
, from the census:
(4b)
(4b)
Priors, implementation, and diagnostics
All priors used in these models were designed to be minimally informative within a realistic range of parameter values:
(5)
(5) The same priors were used across all models to ensure comparability of results. We chose uniform priors for standard deviations rather than the half-Cauchy priors suggested by Gelman (Citation2006), to avoid a long tail that included unrealistic parameter space on the log scale.
We implemented statistical models using JAGS software (Plummer Citation2003; Eddelbuettel Citation2021) from the R statistical programming environment (R Core Team Citation2020) with the runjags and coda packages (Plummer et al. Citation2006; Denwood Citation2016). Model convergence was assessed using the potential scale reduction factor (PSRF) statistics (Gelman and Rubin Citation1992). All models were run until they achieved PSRF < 1.1, indicating convergence (Brooks and Gelman Citation1998).
We used randomized 10-fold out-of-sample cross-validation to assess model fit and robustness of uncertainty intervals. This iterative procedure involved fitting models to subsets of the data that each excluded a random 10 per cent of the locations and then predicting values for these out-of-sample locations to assess prediction accuracy. This procedure was repeated 10 times, omitting a different subset of the data each time, until all data had been withheld once. We used out-of-sample predictions, , to estimate the following measures:
(6)
(6)
These out-of-sample fit statistics were calculated for the response variables (i.e. population, , and buildings,
) and used for comparing models. Robustness of uncertainty intervals was assessed by calculating the proportion of out-of-sample observations that fell within their 95 per cent prediction intervals, with the expectation that about 95 per cent of observations should fall within the prediction intervals.
Results
All models achieved convergence, including 10-fold cross-validation models. Uncertainty intervals appeared robust, if not a bit conservative, because they contained approximately the expected proportion of out-of-sample observations, suggesting appropriately specified error structures for the models (). For prediction intervals of less than 95 per cent, a greater than expected proportion of out-of-sample observations fell within the prediction intervals indicating that prediction intervals may be conservative at these (wider than necessary) uncertainty levels. We provide maps of predicted populations and building counts from the Combined model in for all of the census enumeration areas where the routes method was conducted, to show the geographic variation in model outputs.
Figure 4 Predicted counts from the Combined model of population (left-hand panel) and building counts (right-hand panel) for all census enumeration areas where the routes method was conducted, Colombia 2018
Source: National boundaries were obtained from Global Administrative Areas (GADM Citation2019) and the subnational boundaries from DANE (Citation2022b). The maps were created using ESRI ArcGIS pro v.2.5. See Data subsection for information on data sources used to calculate values displayed in this map.
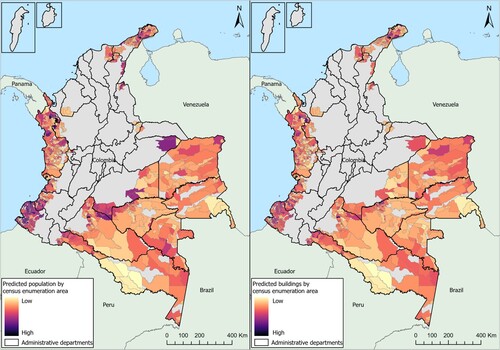
Table 3 Proportion of out-of-sample observations that were within each model’s prediction intervals
Model comparison
We compared models in terms of bias, imprecision, inaccuracy, and percentage variance explained, (). The Base model explained 51.4 per cent of variance in building counts and 54.3 per cent of variance in population counts observed during the census (bottom panel). The Base model included a set of geospatial predictors that was incorporated in all models but did not include local knowledge from social cartography workshops or remotely sensed buildings. All models contained a positive bias for estimates of total population and building counts, although the degree of bias varied between models (). This positive bias was most pronounced for enumeration areas with the lowest population sizes.
Figure 5 Comparisons of model fit across four models (Base, Satellite, Community, and Combined) for the two response variables (population and buildings) in each hierarchical model
Notes: Fit statistics were calculated using out-of-sample predictions from 10-fold cross-validations. Bias, imprecision, and inaccuracy are reported as proportions of the predicted values. R-squared values quantify the proportion of variance explained by each model. Note that x-axes do not start at zero.
Source: See Data subsection for information on data sources used to calculate values in this figure.
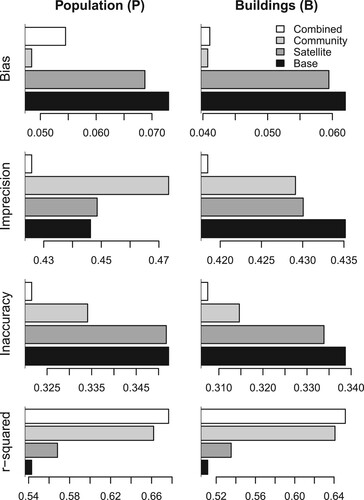
The Satellite model included satellite-derived estimates of building coverage for every 90 m grid square. This information increased the variance explained to 53.4 per cent for building counts and 56.8 per cent for population counts. Compared with the Base model, the remotely sensed building coverage helped primarily to reduce the imprecision of estimated building counts. It also slightly reduced the bias of building counts and population estimates compared with the Base model.
The Community model included estimates of people, families, and dwellings provided by local community members during the social cartography workshops. This information increased the variance explained to 64.1 per cent for buildings and 66.2 per cent for total population. While this was a noticeable increase in variance explained compared with the Base and Satellite models, it is important to note that this model produced more imprecise population estimates than any other model (i.e. more random noise). Conversely, the Community model produced the least biased estimates of building counts and population estimates of any model.
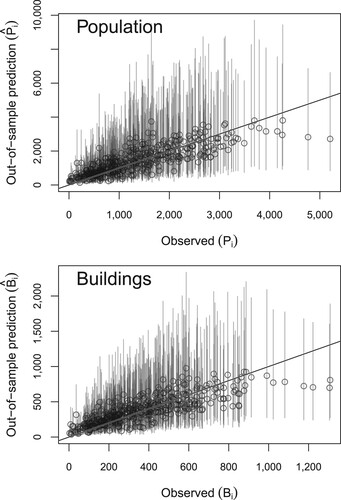
The Combined model explained the largest proportion of variance in out-of-sample observations, with 65.1 per cent of variance in building counts and 67.9 per cent of variance in population counts explained. This model was the most precise of any model, although it gave slightly more biased population estimates than the Community model. The Combined model showed the highest overall accuracy (i.e. a measure that incorporates both bias and imprecision) of any model we tested. The predicted values and prediction intervals from this model are plotted against out-of-sample observations in . This shows that model predictions performed reasonably well for unobserved locations and that the prediction intervals accurately represented uncertainty in the population estimates.
Figure 6 Model fit for the Combined model showing out-of-sample model predictions vs observed data from census enumeration areas that were fully enumerated (≥90 per cent coverage), Colombia 2018
Notes: The diagonal line is a 1:1 relationship where predictions are equal to observations. Vertical lines show 95 per cent prediction intervals.
Source: See Data subsection for information on data sources used to calculate values in this figure.
Covariate effects
Estimated covariate effects on the expected values of buildings per hectare () and buildings per built hectare (
) are shown in , while covariate effects on expected values of people per building (
) are shown in . One trivial result from that is important to note was that covariates containing the unit of area used as the denominator for buildings per hectare (i.e. total area,
, or building coverage,
) always had significant negative effects as expected. We also want to emphasize that strong covariate effects do not necessarily imply causality, because these data were observational rather than experimental. We defined ‘significant’ effects as
estimates where at least 95 per cent of the marginal posterior mass was either above or below zero.
Figure 7 Covariate effects ( and
) on the expected values of buildings per hectare (
) or buildings per built hectare (
) for all four models, Colombia
Notes: Covariates are defined in the Methods section and Table 1: Schools (x1), Poverty (x2), Elevation (x3), NightLights (x4), DistToCenter (x5), and Area (x6). BldgCover refers to building coverage.
Source: See Data subsection for information on data sources used to calculate values in this figure.
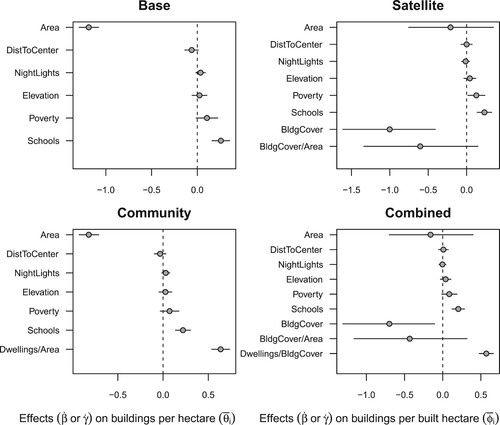
Figure 8 Covariate effects ( and
) on the expected values of people per building (
) for all four models, Colombia
Notes: Covariates are defined in the Methods section and Table 1: Schools (x1), Poverty (x2), Elevation (x3), NightLights (x4), DistToCenter (x5), and Area (x6).
Source: See Data subsection for information on data sources used to calculate values in this figure.
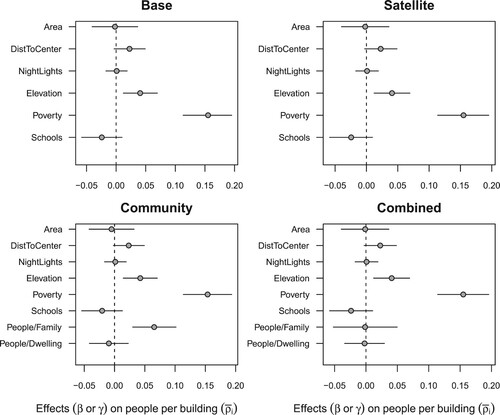
Another general pattern worth noting was that the effects of geospatial covariates from the Base model were found to be very similar (although not always identical) in the other models. The poverty index and elevation always had significant positive relationships with numbers of people per building, . Numbers of schools always had a significant positive relationship with buildings per hectare,
. Distance to city centre showed a slight positive relationship with numbers of people per building, and the poverty index had a slight positive relationship with building per hectare. In models that did not contain satellite-based estimates of building coverage, the intensity of night-time lights had a slight positive relationship with buildings per hectare, but this slight effect was not present in models that included remotely sensed building areas.
In the Community model, the numbers of dwellings per hectare reported during the social cartography workshops had a significant positive effect on expected values of buildings per hectare, . Reported values of individuals per family had a significant positive effect on expected values of people per building,
, but reported values of individuals per dwelling did not. This latter result may have been due to correlation (r = 0.65) between the two covariates.
In the Satellite model, total building coverage had a significant negative effect on expected values of buildings per hectare, , as expected, because building density was defined in this model as buildings per hectare of building coverage. The proportion of the total enumeration area covered by buildings had a slight negative relationship with expected values of buildings per hectare,
, but this was not significant at the 95 per cent level.
The Combined model included a covariate measuring dwellings per building coverage that combined information from the social cartography workshops with information from remotely sensed buildings. This covariate had a significant positive relationship with expected values of buildings per hectare, . The covariate of reported individuals per family from the social cartography workshops did not have a significant effect on people per building in the Combined model although it did in the Community model.
Discussion
We have demonstrated a novel approach, combining information from space-based Earth observations with local knowledge gathered from social cartography workshops to fill census gaps in locations where access was challenging for fieldworkers. We were encouraged by the degree to which local knowledge contributed to model fit, and it was reassuring that we were able to fine-tune population estimates based on the relatively imprecise information on remotely sensed buildings. On one hand, the Community model exhibited the most unbiased estimations for both population sizes and building counts; on the other hand, the Satellite model increased precision of population estimates compared with the Community model. When both types of information were used simultaneously, we obtained unbiased estimates similar to the Community model along with increased precision and accuracy, achieving the highest r-squared across all of the models.
The social cartography workshops in Colombia provide a powerful example of engaging potentially undercounted communities with the census process. Community engagement and social mapping exercises are already used to gather information to support planning for censuses and household surveys (Marcil et al. Citation2016; Green et al. Citation2020; Open Street Maps Citation2022), but we are not aware of a previous example where the data collected have been directly used in population estimation to help address census omissions. The methodological framework that we proposed used local knowledge to improve population estimates, which will guide appropriate resource allocation for essential services back into these communities. To account for the subjective nature of social cartography exercises, our approach incorporated objective information from remote sensing and other geospatial data, and the model was fitted to full-coverage census enumerations from nearby locations to ensure rigorously produced population estimates.
It is important to incorporate knowledge of estimation uncertainty into decision-making processes that are based on modelled population estimates (UNFPA Citation2020), and this is particularly relevant for remote locations where data are sparse. Our hierarchical Bayesian modelling approach provided robust estimates of uncertainty similar to previous work (Leasure et al. Citation2020; Dooley et al. Citation2021; Boo et al. Citation2022). The current model differed from previous examples because it included a sub-model that explicitly estimated building counts for inaccessible locations. This was necessary because we did not have enumerations of buildings from the census cartography nor from remote-sensing data; our remotely sensed building data (Esch et al. Citation2022) measured building coverage for each 90 m grid cell but did not include individual building footprints. Because of the hierarchical nature of the statistical model, the uncertainty around our population estimates also accounted for uncertainty in building estimates.
High-resolution building footprints are available from a variety of sources with global coverage, but costs are often prohibitive. These data sets are increasingly becoming openly available (e.g. Google Citation2022; Microsoft Citation2022) or crowdsourced with incomplete coverage (e.g. Geofabrik GmbH Citation2018; OpenStreetMap Citation2022), but full-coverage high-resolution building footprints are not yet openly available globally. Our approach addressed this limitation in Colombia by using census-based building counts from fully accessible census enumeration areas to train a sub-model to estimate building counts using satellite-based estimates of building coverage (Esch et al. Citation2022), community-based estimates of numbers of dwellings (DANE Citation2014), and other geospatial covariates. We would expect estimation uncertainty for our modelled population estimates to be reduced if high-resolution building footprints were available, and opportunities are now arising to pursue this option (Microsoft Citation2022).
We included a small set of geospatial covariates that was consistent across all of our models so that we could isolate the influences of data from social cartography workshops and remotely sensed building coverage. We evaluated many geospatial covariates before finalizing the set of covariates presented here, but covariate development and selection was beyond the scope of the current study. However, it is important to note that the selection of covariates must be dependent on data availability and the specific context of the population estimation. For example, the intensity of night-time lights may not be a good predictor of populations in remote regions where electricity is not commonly available, whereas it otherwise may provide valuable information. We chose a small set of orthogonal covariates using the best available data for these remote regions of Colombia, but additional work may be able to uncover additional covariates that could improve model fit.
Conclusions
While emphasis is often placed on new technologies such as satellite remote sensing to fill data gaps, we have provided evidence to serve as a reminder that innovative technologies are sometimes most effective when combined with traditional low-tech sources of information, such as local knowledge obtained through community engagement. We have highlighted the importance of social cartography workshops to engage potentially undercounted communities of Colombia in the census process. The statistical approach that we demonstrated incorporated community-based estimates of numbers of dwellings, families, and people with satellite-derived estimates of building coverage and other geospatial covariates to estimate building counts and population sizes in remote regions of Colombia where a full-coverage census enumeration was not possible. This project has provided a step forward in the science of modelled population estimates to support censuses and highlighted the value of community engagement as well as government–academic partnerships in searching for innovative solutions for real-world challenges.
Disclosure statement
No potential conflict of interest was reported by the authors.
Notes
1 Authorship: Lina Maria Sanchez-Cespedes, Douglas Ryan Leasure, and Natalia Tejedor-Garavito contributed equally to the paper.
2 Affiliations: Lina Maria Sanchez-Cespedes, Glenn Harry Amaya Cruz, Gustavo Adolfo Garcia Velez, Andryu Enrique Mendoza, Yenny Andrea Marín Salazar, and Mariana Ospina Bohórquez are all based at the National Administrative Department of Statistics, Bogotá, Colombia. Douglas Ryan Leasure is based at both the Leverhulme Centre for Demographic Science, Department of Sociology, Nuffield College, University of Oxford, UK, and WorldPop, School of Geography and Environmental Sciences, University of Southampton, UK. Natalia Tejedor-Garavito and Andrew J. Tatem are also based at WorldPop. Thomas Esch is based at the German Aerospace Center, Wessling, Germany.
3 Please direct all correspondence to Douglas Leasure, Leverhulme Centre for Demographic Science, 42-43 Park End Street, Oxford, OX1 1JD, UK; or by E-mail: [email protected].
4 Funding: This work was supported by the Colombian National Administrative Department of Statistics (DANE); the Bill & Melinda Gates Foundation under grants OPP1182408 and INV-002697; the UK Foreign, Commonwealth, and Development Office under grant OPP1182408; and the Leverhulme Trust under the grant for the Leverhulme Centre for Demographic Science.
5 Data availability: Data for this publication are available from the Open Science Foundation server: http://doi.org/10.17605/OSF.IO/DW4VR.
6 Acknowledgements: This work was supported by DANE through funding and implementation of the 2018 Population and Housing Unit Census of Colombia and the social cartography workshops, and through allocating staff time to develop geospatial covariates and Bayesian models. We thank the United Nations Population Fund for coordinating a workshop that kick-started this collaboration, particularly Carlos Ramirez, Paulo Lara, and Sabrina Juran. We especially want to thank Juan Daniel Oviedo, director of DANE from August 2018 to August 2022, for encouraging participation in academic research and supporting this collaboration. Finally, we are very grateful to the Censuses and Special Studies Working Group, Humberto Cote, and every person that participated in the social cartography workshops: Alexander Paez, Julio Sanchez, Cesar Maldonado, David Pinilla, Harrison Cuero, Diego Lerma, Liliana Guarnizo, Jose Martinez, Gonzalo Mendoza, Hugo Ramos, Adriana Bolaños, Helen Santamaria, and Oscar Buitrago.
7 Andrew J. Tatem can be found on Twitter at @AndyTatem.
References
- Boo, Gianluca, Edith Darin, Douglas R. Leasure, Claire A. Dooley, Heather R Chamberlain, Attila N. Lázár, Kevin Tschirhart, et al. 2022. High-resolution population estimation using household survey data and building footprints, Nature Communications 13(1): 1–10. https://doi.org/10.1038/s41467-022-29094-x
- Breiman, L. 1994. The 1991 census adjustment: Undercount or bad data?, Statistical Science 9(4): 458–475. https://doi.org/10.1214/ss/1177010259
- Brooks, Stephen P. and Andrew Gelman. 1998. General methods for monitoring convergence of iterative simulations, Journal of Computational and Graphical Statistics 7(4): 434–455. https://doi.org/10.1080/10618600.1998.10474787
- Car-Hill, R. 2013. Missing millions and measuring development progress, World Development 46: 30–44. https://doi.org/10.1016/j.worlddev.2012.12.017
- [DANE] National Administrative Department of Statistics of Colombia. 2014. Dinámica y Ajustes Metodológicos para los Talleres de Cartografía Social y Estructuración de Rutas. [Dynamics and Methodological Adjustments for the Social Cartography Workshops and Routes Structuring]. Bogotá, Colombia: Census and Demographics Directorate, National Administrative Department of Statistics.
- [DANE] National Administrative Department of Statistics of Colombia. 2020. Necesidades Básicas Insatisfechas [Unsatisfied Basic Needs]. Bogotá, Colombia: National Administrative Department of Statistics (DANE). Available: https://www.dane.gov.co/index.php/estadisticas-por-tema/pobreza-y-condiciones-de-vida/necesidades-basicas-insatisfechas-nbi
- [DANE] National Administrative Department of Statistics of Colombia. 2021a. Censo Nacional de Población y Vivienda – CNPV 2018: Documento Metodológico [National Population and Housing Census – CNPV 2018: Methodological Document]. Bogotá, Colombia: National Administrative Department of Statistics (DANE).
- [DANE] National Administrative Department of Statistics of Colombia. 2021b. Lecciones Aprendidas, Censo Nacional de Población y Vivienda – CNPV 2018 en el marco de la NTC PE 1000 [Learned Lessons, National Population and Housing Census – CNPV 2018 within the framework of the NTC PE 1000]. Bogotá, Colombia: National Administrative Department of Statistics (DANE).
- [DANE] National Administrative Department of Statistics of Colombia. 2022a. Estimación de la omisión censal a nivel nacional y subnacional a partir de métodos demográficos, econométricos y geoestadísticos, Metodologías Demográficas Aplicada [Estimation of Census Omission at National and Subnational Levels Based on Demographic, Econometric and Geostatistical Methods], Metodologías Demográficas Aplicada 2.
- [DANE] National Administrative Department of Statistics of Colombia. 2022b. Descarga del Marco Geoestadistico Nacional (MGN). Available: https://geoportal.dane.gov.co/servicios/descarga-y-metadatos/descarga-mgn-marco-geoestadistico-nacional/ (accessed: 21 June 2022).
- Denwood, Matthew J. 2016. Runjags: An R package providing interface utilities, model templates, parallel computing methods and additional distributions for MCMC models in JAGS, Journal of Statistical Software 71(9): 1–25. https://doi.org/10.18637/jss.v071.i09
- Dias, Jr., Claudio S. and Ana P. Verona. 2018. Os indígenas nos Censos Demográficos brasileiros pré-1991 [The indigenous people in the Brazilian Demographic Censuses before 1991], Revista Brasileira de Estudos de População 35(3): 1–9. https://doi.org/10.20947/S0102-3098a0058
- Dooley, Claire A., Heather R. Chamberlain, Douglas R. Leasure, G. M. Membele, Attila N. Lazar, and Andrew J. Tatem. 2021. Description of Methods for the Zambia Modelled Population Estimates from Multiple Routinely Collected and Geolocated Survey Data, Version 1.0. World Pop, University of Southampton. https://doi.org/10.5258/SOTON/WP00707
- Eddelbuettel, Dirk. 2021. JAGS: Just Another Gibbs Sampler for Bayesian MCMC, Version 4.3.0-3build1. Available: https://launchpad.net/ubuntu/(source/jags/4.3.0-3build1
- Elvidge, C. D., K. Baugh, M. Zhizhin, F. C. Hsu, and T. Ghosh. 2017. VIIRS night-time lights, International Journal of Remote Sensing 38(21): 5860–5879. https://doi.org/10.1080/01431161.2017.1342050
- Engstrom, R., D. L. Newhouse, and V. Soundararajan. 2020. Estimating small-area population density in Sri Lanka using surveys and geo-spatial data, PLoS ONE 15(8): e0237063. https://doi.org/10.1371/journal.pone.0237063
- Ericksen, Eugene P. and Joseph B. Kadane. 1986. Using administrative lists to estimate census omissions, Journal of Official Statistics 2(4): 397–414.
- Esch, Thomas, Julian Zeidler, Daniela Palacios-Lopez, Mattia Marconcini, Achim Roth, Milena Mönks, Benjamin Leutner, et al. 2020. Towards a large-scale 3D modeling of the built environment—Joint analysis of TanDEM-X, Sentinel-2 and Open Street Map data, Remote Sensing 12(15): 2391. https://doi.org/10.3390/rs12152391
- Esch, Thomas, Elisabeth Brzoska, Stefan Dech, Benjamin Leutner, Daniela Palacios-Lopez, Annekatrin Metz-Marconcini, Mattia Marconcini, et al. 2022. World settlement footprint 3D - A first three-dimensional survey of the global building stock, Remote Sensing of Environment 270: 112877. https://doi.org/10.1016/j.rse.2021.112877
- ESRI. 2017. ArcGIS Desktop: Release 10.5.1. Redlands, CA: Environmental Systems Research Institute.
- Farr, T. G., P. A. Rosen, E. Caro, R. Crippen, R. Duren, S. Hensley, M. Kobrick, et al. 2007. The shuttle radar topography mission, Reviews of Geophysics 45(2): RG2004. https://doi.org/10.1029/2005RG000183
- Fein, D. J. 1990. Racial and ethnic differences in U.S. census omission rates, Demography 27(2): 285–302. https://doi.org/10.2307/2061454
- Feres, Juan C. and X. Mancero. 2001. El método de las necesidades básicas insatisfechas (NBI) y sus aplicaciones en América Latina. [The Unsatisfied Basic Needs (UBN) Method and Its Applications in Latin America]. Santiago, Chile: United Nations. ISBN: 92-1-321791-9.
- Gelman, A. and D. B. Rubin. 1992. Inference from iterative simulation using multiple sequences, Statistical Science 7: 457–511. https://doi.org/10.1214/ss/1177011136
- Gelman, A. 2006. Prior distributions for variance parameters in hierarchical models (comment on article by Browne and Draper), Bayesian Analysis 1(3): 515–534. https://doi.org/10.1214/06-BA117A
- Geofabrik GmbH. 2018. OpenStreetMap Data Extracts. https://download.geofabrik.de
- Global Administrative Areas (GADM). 2019. University of California, Berkeley. Available: http://www.gadm.org (accessed: 10 October 2019).
- Google. 2022. Google Open Buildings. https://sites.research.google/open-buildings/
- Gorelick, N., M. Hancher, M. Dixon, S. Ilyushchenko, D. Thau, and R. Moore. 2017. Google Earth engine: Planetary-scale geospatial analysis for everyone, Remote Sensing of Environment 202: 18–27. https://doi.org/10.1016/j.rse.2017.06.031
- Green, J. J., H. Hanna, L. Woo, R. Haggard, and A. Buffington. 2020. Using community engagement approaches to bolster 2020 census participation, Choices 35(1): 1–6. https://www.jstor.org/stable/27098553
- Hogan, H. and K. Wolter. 1988. Measuring accuracy in a post-enumeration survey, Survey Methodology 14(1): 99–116.
- [INDEC] Instituto Nacional de Estadística y Censos (Argentina). 1984. La Pobreza en la Argentina: Indicadores de necesidades básicas insatisfechas a partir de los datos del Censo nacional de población y vivienda, 1980. [Poverty in Argentina: Indicators of Unsatisfied Basic Needs Based on Data from the National Population and Housing Census, 1980]. Buenos Aires, Argentina: Instituto Nacional de Estadística y Censos.
- Jardim, Maria de Lourdes T. 2001. Uso de las Variables Sintomáticas para Estimar la Distribución Espacial de Población: Aplicación a los Municipios de Rio Grande do Sul, Brasil. [Use of Symptomatic Variables to Estimate the Spatial Distribution of Population: Application to the Municipalities of Rio Grande do Sul, Brazil]. Notas de Población 71(2). Available: http://hdl.handle.net/11362/12695
- Kashyap, R., R.G. Rinderknecht, A. Akbaritabar, D. Alburez-Gutierrez, S. Gil-Clavel, A. Grow, J. Kim, et al. 2022. Digital and Computational Demography. SocArXiv. https://doi.org/10.31235/osf.io/7bvpt
- Leasure, Douglas R., W. Christopher Jochem, Eric M. Weber, Vince Seaman, and Andrew J. Tatem. 2020. National population mapping from sparse survey data: A hierarchical Bayesian modeling framework to account for uncertainty, Proceedings of the National Academy of Sciences 117(39): 24173–24179. https://doi.org/10.1073/pnas.1913050117
- Marcil, L., K. Afsana, and H. B. Perry. 2016. First steps in initiating an effective maternal, neonatal, and child health program in urban slums: The BRAC Manoshi Project’s experience with community engagement, social mapping, and census taking in Bangladesh, Journal of Urban Health 93: 6–18. https://doi.org/10.1007/s11524-016-0026-0
- Microsoft. 2022. GlobalMLBuildingFootprints. https://github.com/microsoft/GlobalMLBuildingFootprints
- Mossoux, S., M. Kervyn, H. Soulé, and F. Canters. 2018. Mapping population distribution from high resolution remotely sensed imagery in a data poor setting, Remote Sensing 10(9): 1409. https://doi.org/10.3390/rs10091409
- Myrskyla, P. 1999. New statistics made possible by the use of registers, Statistical Journal 16(2-3): 165–180. https://doi.org/10.3233/SJU-1999-162-306
- Open Street Map. 2022. http://www.openstreetmap.org
- Palacios-Lopez, D., F. Bachofer, T. Esch, M. Marconcini, K. MacManus, A. Sorichetta, J. Zeidler, et al. 2021. High-resolution gridded population datasets: Exploring the capabilities of the world settlement footprint 2019 imperviousness layer for the African continent, Remote Sensing 13(6): 1142. https://doi.org/10.3390/rs13061142
- Paulston, R. G. and M. Liebman. 1994. An invitation to postmodern social cartography, Comparative Education Review 38(2): 215–232. https://doi.org/10.1086/447242
- Plummer, Martin. 2003. Jags: A program for analysis of Bayesian graphical models using Gibbs sampling, in K. Hornik, F. Leisch and A. Zeileis (eds), Proceedings of the 3rd International Workshop on Distributional Statistical Computing. Vienna, Austria: Technische Universität Wien, pp. 1–10.
- Plummer, Martyn, Nicky Best, Kate Cowles, and Karen Vines. 2006. CODA: Convergence diagnosis and output analysis for MCMC, R News 6(1): 7–11. Available: https://journal.r-project.org/archive/
- R Core Team. 2020. R: A Language and Environment for Statistical Computing. Vienna, Austria: R Foundation for Statistical Computing. Available: https://www.R-project.org/.
- Sanchez-Cespedes, L. M., D. R. Leasure, N. Tejedor-Garavito, G. H. A. Cruz, G. A. G. Velez, A. E. Mendoza, Y. A. M. Salazar, et al. 2022. Social cartography and satellite-derived building coverage for post-census population estimates in difficult-to-access regions of Colombia, SocArXiv. Available: https://doi.org/10.17605/OSF.IO/DW4VR
- [UNFPA] United Nations Population Fund. 2020. The Value of Modelled Population Estimates for Census Planning and Preparation, Technical Guidance Note. New York: United Nations Population Fund. Available: https://www.unfpa.org/resources/value-modelled-population-estimates-census-planning-and-preparation
- United Nations. 2010. Post Enumeration Surveys, Operational Guidelines. New York: United Nations Secretariat, Department of Economic and Social Affairs, Statistics Division. Available: https://unstats.un.org/unsd/demographic/standmeth/handbooks/Manual_PESen.pdf
- Valente, P. 2010. Comment la population est-elle recensée dans les pays européens en 2010? [Census taking in Europe: How are populations counted in 2010?], Population & Sociétés 467(5): 1–4. https://doi.org/10.3917/popsoc.467.0001
- Wardrop, N. A., W. C. Jochem, T. J. Bird, H. R. Chamberlain, D. Clarke, D. Kerr, L. Bengtsson, et al. 2018. Spatially disaggregated population estimates in the absence of national population and housing census data, Proceedings of the National Academy of Sciences 115(14): 3529–3537. https://doi.org/10.1073/pnas.1715305115
- Weber, E. M., V. Y. Seaman, R. N. Stewart, T. J. Bird, A. J. Tatem, J. J. McKee, B. L. Bhaduri, et al. 2018. Census-independent population mapping in northern Nigeria, Remote Sensing of Environment 204: 786–798. https://doi.org/10.1016/j.rse.2017.09.024