
Abstract
Shrunken pore syndrome (SPS) is a condition in which estimated glomerular filtration rate (eGFR) based upon cystatin C is lower than eGFR based upon creatinine. It has been associated with increased mortality even in the presence of normal GFR in both a cardiac surgical population and a general population. No systematic studies of the variation in eGFRcystatin C/eGFRcreatinine-ratio used for SPS diagnosis have been published. This study aims to evaluate whether early and midterm mortality following elective cardiac surgery varies with the ratio used to identify SPS. Preoperative levels of cystatin C and creatinine were analysed in 4007 patients undergoing elective coronary artery bypass grafting (CABG) and/or surgical aortic valve replacement (sAVR). The eGFRcystatin C/eGFRcreatinine-ratio was calculated based on the equation pairs CKD-EPIcystatin C/CKD-EPIcreatinine and CAPA/LMrev. The overall 1- and 3-year all-cause mortality was 2.9 and 6.8%, respectively. Mean follow-up time was 3.6 years. Mortality markedly and progressively increased with a decrease in the eGFRcystatin C/eGFRcreatinine-ratio for both equation pairs. An increase in mortality was noted already when the ratio decreased from 1.0 to 0.90. To facilitate the clinical decisions based upon the SPS-defining eGFRcystatin C/eGFRcreatinine-ratio, we calculated both the ratios defining the highest combined sensitivity and specificity and the ratios producing a high specificity of 95%, finding different cut-off for these scenarios.
Introduction
Shrunken pore syndrome (SPS) is defined as a condition in which estimated glomerular filtration rate (eGFR) based upon cystatin C is considerably lower than eGFR based upon creatinine in the absence of non-renal influences on the levels of cystatin C or creatinine [Citation1]. SPS has been shown to be a risk factor for early and midterm mortality (2–5 years) independent of eGFR [Citation2–4]. The condition was originally presumed to be present in late pregnancy and particularly in pre-eclampsia [Citation5–7], but was later found to be present in all patient populations studied [Citation2–4,Citation8]. In the first study showing that SPS was a risk factor for mortality, the value of the eGFRcystatin C/eGFRcreatinine-ratio used to identify SPS was set to 0.6 [Citation1]. The same cut-off value was used for both the equation pair used in the Chronic Kidney Disease Epidemiology Collaboration study[Citation9], CKD-EPIcystatin C and CKD-EPIcreatinine, and the equation pair Caucasian Asian Pediatric Adult (CAPA) [Citation10] and Lund Malmö Revised (LMrev), based upon cystatin C and creatinine, respectively [Citation11]. The presence of SPS was strongly associated with early and midterm mortality in a cohort undergoing elective coronary artery bypass grafting (CABG) [Citation2]. The tentative value of the eGFRcystatin C/eGFRcreatinine-ratio used to identify SPS in this investigation was based upon studies of preeclamptic women [Citation1,Citation2,Citation5–7]. However, Dardashti et al. [Citation2] showed that early and midterm survival decreased also when a ratio of 0.7 was used to diagnose SPS. This study aims to evaluate whether early and midterm mortality following elective cardiac surgery varies with different cut-off values for the ratio used to diagnose SPS.
Material and methods
Trial design
This was a retrospective single-centre cohort study with prospectively collected data.
Study population, data collection and blood sampling
The plasma levels of cystatin C and creatinine were measured preoperatively in 4719 patients undergoing CABG, aortic valve replacement (AVR), or CABG + AVR from 1 January 2010 to 31 December 2015, at the Department of Cardiothoracic Surgery at Skåne University Hospital in Lund, Sweden. Emergency operations (defined as surgery within one hour from decision) (n = 116), redo operations (n = 127), and patients with missing preoperative creatinine or cystatin C data (n = 469) were excluded from the study, leaving 4007 patients for the final analysis. Perioperative data were obtained from an in-house quality database. Laboratory data were obtained from the hospital clinical chemistry department. Survival data were obtained from the national tax registry in January 2017. Only patients who have emigrated from the country are lost to follow up in the tax registry, and only 0.1% per year of the healthy population leaves the country in this age category [Citation12]. Follow up was virtually 100% complete with a mean follow up of 3.6 ± 1.8 years.
Laboratory analysis
The plasma level of cystatin C was determined by an automated particle-based immunoassay, adjusted to the international reference preparation ERM-DA 471/IFCC and that of creatinine by an enzymatic colorimetric assay with an IDMS-traceable calibrator. Both assays were run on a Cobas C-system (Roche Diagnostics, Basel, Switzerland). The assays were performed according to the manufacturer’s instruction. The CAPA and the CKD-EPIcystatin C estimating equations, based on cystatin C, were used to estimate GFR, as were the LMrev and CKD-EPIcreatinine estimating equations based on creatinine [Citation9–11].
Statistical analysis
Categorical data were given as proportions, and continuous variables were expressed as the mean ± standard deviation. In skewed distributions, medians and interquartile ranges were reported. Receiver operating characteristic (ROC) curves were used for the CKD-EPIcystatin C/CKD-EPIcreatinine-ratio as well as the CAPA/LMrev-ratio. Youden’s index was used to determine the optimal cut-off from the ROC curves. Testing of proportions was performed using Chi-square tests. Test of equality for ROC curves was performed according to DeLong et al. [Citation13]. Statistical analysis was performed using Statistica software version 13.1 (StatSoft Inc., Tulsa, OK) and Stata version 14.0 (StataCorp LLC, College Station, TX).
Results
Of the 4007 patients studied, 3181 (79%) underwent CABG, 535 (13%) underwent AVR, and 291 (7%) CABG and AVR. The mean preoperative eGFRcystatin C using the equations CKD-EPIcystatin C and CAPA was 63.6 ± 21.8 and 66.0 ± 20.9 mL/min/1.73m2, respectively. The mean preoperative eGFRcreatinine for the equations CKD-EPIcreatinine and LMrev was 74.9 ± 20.1 and 66.7 ± 17.5 mL/min/1.73m2, respectively. Detailed pre- and post-operative characteristics of the study population are shown in and . The 1- and 3-year all-cause mortality was 2.9 and 6.8%, respectively.
Table 1. Preoperative characteristics of the study cohort (n= 4007) presented as either means (± standard deviation) for continuous variables or numbers (percent) for dichotomous variables.
Table 2. Postoperative characteristics of the study cohort (n= 4007) presented as either means (± standard deviation) for continuous variables or numbers (percent) for dichotomous variables.
CKD-EPI estimates
The prevalence of SPS in the population was 299 (7.5%) using the equation pair CKD-EPIcystatin C/CKD-EPIcreatinine with the cut-off of <0.6. Using this cut-off, the 1- and 3-year mortality was 10 and 21%, respectively (). To study the influence of the CKD-EPIcystatin C/CKD-EPIcreatinine-ratio used to diagnose SPS on 1- and 3-year mortality, the mortality at different intervals of the CKD-EPIcystatin C/CKD-EPIcreatinine-ratio was calculated. As can be seen in and , there was a general increase in mortality with a decrease in the ratio. A statistically significant increase in mortality was noted between cut-off values of 0.6–0.7 and 0.7–0.8 for 1-year mortality and at cut-off values of <0.5 and 0.5–0.6, 0.6–0.7 and 0.7–0.8, 0.8–0.9 and 0.9–1.0 for 3-year mortality (, ).
Figure 1. One- and 3-year mortality in percentage at different ratios of CKD-EPIcystatin C/CKD-EPIcreatinine. Error bars indicate standard error of the mean. Horizontal bars indicate statistical significance in Chi-square tests. CKD-EPI: Chronic Kidney Disease Epidemiology Collaboration.
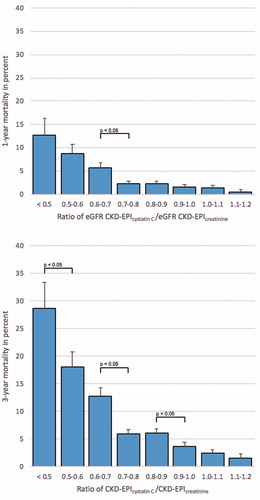
Table 3. Mean eGFR expressed in mL/min/1.73 m2 ± SD and 1- and 3-year mortality (numbers and percentages) at different ratios of CKD-EPIcystatin C/CKD-EPIcreatinine.
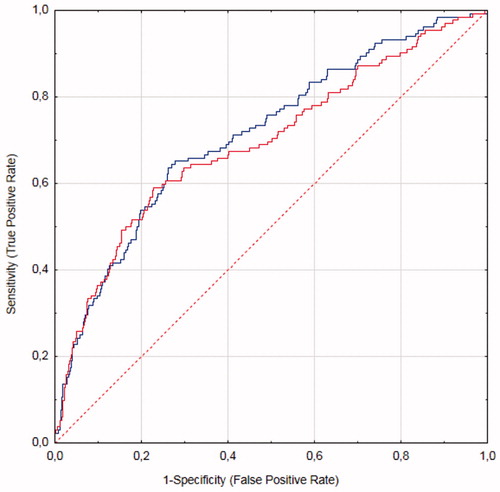
ROC curves plotting CKD-EPIcystatin C/CKD-EPIcreatinine-ratios and survival for 1 and 3 years are shown in and , respectively. The area under the curve (AUC) was 0.713 for 1-year survival and 0.689 for 3-year survival. Youden’s index for the ratio was 0.74 both for 1- and 3-year follow-up. Sensitivity and specificity at a ratio of 0.74 was 64%/74% and 57%/73% for 1- and 3-year follow-up, respectively, and the prevalence of SPS was 1181 (29%) at this cut-off. Mortality at 1- and 3-year follow-up was 6.6% and 14%, respectively, using 0.74 as the cut-off value for identifying SPS.
A high-specificity cut-off was selected to identify the subgroup that might stand most to gain from active intervention preoperatively. A specificity of 95% was chosen that provided sensitivities of 22 and 23% for 1- and 3-year follow up, respectively, with corresponding SPS ratios of 0.56 and 0.58. A mean cut-off value of 0.57 corresponded to a prevalence of 219 (5.5%) for patients with SPS and to 1- and 3-year mortalities of 11 and 24%, respectively.
CAPA-LMrev estimates
The prevalence of SPS in the population was 94 (2.3%) using the equation pair CAPA/LMrev with the cut-off of <0.6. Using this cut-off, the 1- and 3-year mortality was 12 and 27%, respectively (). To study the influence of the CAPA/LMrev-ratio used to diagnose SPS on 1- and 3-year mortality, the mortality at different intervals of the CAPA/LMrev-ratio was calculated. As can be seen in and , there was a general increase in mortality with a decrease in the ratio. A statistically significant increase in 1-year mortality was noted between the groups with SPS of 0.7–0.8 versus 0.8–0.9 and 0.8–0.9 versus 0.9–1.0. The same pattern was seen for 3-year mortality (, ).
Figure 2. One- and 3-year mortality in percentage at different ratios of CAPA/LMrev. Error bars indicate standard error of the mean. Horizontal bars indicate statistical significance in Chi-square tests. CAPA: Caucasian Asian Pediatric Adult; LMrev: Lund Malmö Revised.
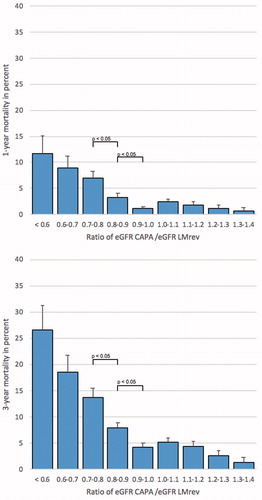
Table 4. Mean eGFR expressed in mL/min/1.73 m2 ± SD and 1- and 3-year mortality (numbers and percentages) at different ratios of CAPA/LMrev.
ROC curves plotting CAPA/LMrev-ratios and survival for 1 and 3 years are shown in and Citation4, respectively. The AUC was 0.694 for 1-year survival and 0.660 for 3-year survival. Youden’s index for the ratio was 0.85 both for 1- and 3-year follow-up. Sensitivity and specificity at a ratio of 0.85 was 59%/77% and 52%/76% for 1- and 3-year follow-up, respectively, and the prevalence of SPS was 908 (23%) at this cut-off. Mortality at 1- and 3-year follow-up was 7.0 and 15%, respectively, using 0.85 as the cut-off value for identifying SPS.
Figure 3. ROC curve plotting ratios of the equation pair CKD-EPIcystatin C/CKD-EPIcreatinine (blue line) and the equation pair CAPA/LMrev (red line) for 1-year mortality. CAPA: Caucasian Asian Pediatric Adult; CKD-EPI: Chronic Kidney Disease Epidemiology Collaboration; LMrev: Lund Malmö Revised; ROC: receiver operating characteristic.
A high specificity cut-off with a specificity of 95% provided sensitivities of 25 and 22% for 1- and 3-year follow-up, respectively, with corresponding SPS ratios of 0.68 and 0.69. A mean cut-off value of 0.685 corresponded to a prevalence of 216 (5.4%) for patients with SPS and to 1- and 3-year mortalities of 12 and 23%, respectively.
Comparison of CKD-EPIcystatin C/CKD-EPIcreatinine and CAPA/LMrev-ratios concerning prevalence and mortality of SPS
Comparison using the cut-off levels derived from the Youden indexes of ROC curves of 0.75 for the CKD-EPIcystatin C/CKD-EPIcreatinine-ratio and of 0.85 for the CAPA/LMrev-ratio showed that of the 1181 patients identified as suffering from SPS by the CKD-EPIcystatin C/CKD-EPIcreatinine-ratio, 868 also suffered from SPS by the CAPA/LMrev-ratio. Using the high-specificity cut-off levels of 0.57 for the CKD-EPIcystatin C/CKD-EPIcreatinine-ratio and 0.685 for the CAPA/LMrev-ratio, we found that, of the 219 patients afflicted by SPS according to the CKD-EPIcystatin C/CKD-EPIcreatinine-ratio, 185 patients also suffered from SPS by the CAPA/LMrev-ratio (). describes 1- and 3-year mortality for patients suffering from SPS using the two different cut-off values for the CKD-EPIcystatin C/CKD-EPIcreatinine- and the CAPA/LMrev-ratios. The highest mortalities are observed for those patient populations identified as suffering from SPS by both ratios.
Table 5. Four-field-matrices showing the overlaps for the two equation pairs used for diagnosing SPS.
Table 6. Four-field-matrices showing 1- and 3-year mortalities in percentages separated by a slash.
Test for equality of ROC curve found no difference between the two estimates (CKD-EPI versus LM-rev) at 1 year (p < .0025) and 3 years (p < .00001).
Discussion
This study focuses on the relationship between mortality and the cut-off value for diagnosing SPS in a well-characterised large population of patients undergoing elective cardiac surgery. Two pairs of commonly used cystatin C- or creatinine-based equations (CKD-EPIcystatin C/CKD-EPIcreatinine and CAPA/LMrev) were used to produce the eGFRcystatin C/eGFRcreatinine-ratios of this study. The findings demonstrate that a progressive decrease in the cut-off value for SPS results in a substantial progressive increase in mortality.
The ratios generated by the two equation pairs differ somewhat. The main reason for this is that one of the four equations, CKD-EPIcreatinine, produces estimated GFR-values that are about 15% higher than the mean estimated GFR-values of the other three GFR-estimating equations, CAPA, LMrev and CKD-EPIcystatin C. A similar relative overestimation by the CKD-EPIcreatinine-equation has been noted in two previous investigations of large Scandinavian populations [Citation2,Citation11].
One aim of this study was to find an optimal cut-off value for SPS. However, varying clinical situations require different cut-off levels. One commonly used rule is that the cut-off value for clinical decision-making should represent the Youden index of ROC curves i.e. the value associated with the highest combined sensitivity and specificity of the test. However, in many clinical situations, the cut-off value requires much higher specificity to limit the risk of treating patients without the disorder. Both these requirements were applied in an effort to find suitable cut-off values for diagnosing SPS using the two pairs of cystatin C- and creatinine-based GFR-estimating equations. The cut-off values, whether based upon Youden index or to generate a high specificity of 95%, varied between the two pairs of GFR-estimating equations. Youden index yielded a cut-off of 0.74 for the equation pair CKD-EPIcystatin C/CKD-EPIcreatinine and 0.85 for the equation pair CAPA/LMrev in this cohort while the high specificity cut-off yielded a cut-off of 0.57 for the equation pair CKD-EPIcystatin C/CKD-EPIcreatinine and 0.69 for the equation pair CAPA/LMrev.
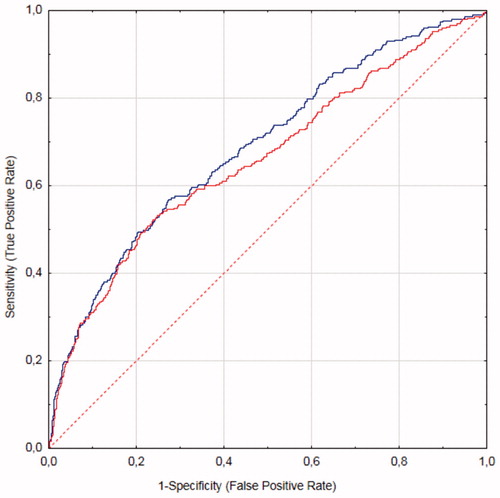
Despite the different cut-off values, 4-field matrices plotting the two equation pairs against each other and using the different cut-off values demonstrates that the two equation pairs identify almost the same patient cohorts. When cut-off values based upon the Youden index were used, 91% of the patients were classified by both equations as either with or without SPS (). When the cut-off values selected for high specificity were used, 98% of the patients were classified by both equations as either with or without SPS (). In accordance, as the two equation pairs identify virtually the same clinically relevant patient cohorts, the highest 1- and 3-year mortality was seen in the group identified as SPS positive by both equation pairs, whereas the group identified by both equation pairs as SPS negative had a low 1-and 3-year mortality (). The virtually equal diagnostic potential of the two equation pairs is also supported by the observation that the areas under the ROC curves for the two pairs do not differ significantly with 1- or 3-year mortality ( and ).
Figure 4. ROC curve plotting ratios of the equation pair CKD-EPIcystatin C/CKD-EPIcreatinine (blue line) and the equation pair CAPA/LMrev (red line) with 3-year mortality. CAPA: Caucasian Asian Pediatric Adult; CKD-EPI: Chronic Kidney Disease Epidemiology Collaboration; LMrev: Lund Malmö Revised; ROC: receiver operating characteristic.
One of our aims was to find the cut-off level with the highest sensitivity and specificity for mortality in this population. As demonstrated in and , the lower the cut-off the higher the mortality, and it can be discussed whether one should use SPS as a categorical variable or as a continuous variable. Many medical conditions are defined as dichotomous events, which can be useful as thresholds in both diagnosis and treatment. Moreover, the impact of different conditions can easily be compared in epidemiological studies if variables are dichotomous. This study includes a homogenous population, and results may differ in other populations. Further studies might provide more insight into optimal cut-off levels, but the present data do not support 0.6 as a single cut-off. Instead, different cut-off levels should be applied to the two equation pairs, and the best trade-off between sensitivity and specificity yields higher cut-off levels. Also, SPS has been associated with other conditions such as right ventricular dysfunction in heart failure [Citation8], and different cut-off levels could apply to this and other conditions.
The data in this study are based on a large and homogenous cohort, and results do not give any indication of how generalisable the findings are. A different or more heterogeneous population could yield a different result. Risch et al. found increased mortality and morbidity using different cut-offs in a study to examine the association between renal clearance of hormones and the ratio of cystatin C/creatinine or eGFRcystatin C/eGFRcreatinine [Citation4]. Purde et al. investigated the presence and outcome of SPS within the framework of the SENIORLAB study, whose aim was to establish laboratory reference intervals in subjectively healthy seniors. They found a marked increase in morbidity and mortality in seniors afflicted by SPS and, interestingly, a retention of low-molecular weight proteins but not in very low-molecular weight proteins, corroborating the findings of Dardashti et al. [Citation2] and Purde et al. [Citation3] that SPS impacts mortality.
This study may be limited by the use of equations estimating GFR instead of actually measuring GFR by injecting substances only excreted by glomerular filtration, such as Cr-EDTA, Inulin or Iohexol [Citation14]. In addition to single molecule measurement, a few studies have been conducted in humans [Citation15–21] in which clearance of different-sized molecules was used to demonstrate a reduction or increase in glomerular pores in various pathological states. Besides the practical problems of a large population, the monetary cost and ethical aspects of these procedures have limited their clinical use. Instead, equations estimating GFR have found widespread use in clinical practice. Other shortcomings of this study are a limited size, a select patient population and limited long-term follow up, which all could further narrow down the interval for a cut-off.
In summary, we found that short- and midterm mortality increases markedly with an increasing degree of SPS. Also, the mathematically optimal cut-off for predicting short- and mid-term mortality with SPS was 0.74 using the equation pair CKD-EPIcystatin C/CKD-EPIcreatinine and 0.85 for the equation pair CAPA/LM-rev. More clinically valuable may be a high specificity (95%) cut-off, which corresponds to a cut-off of 0.57 using the equation pair CKD-EPIcystatin C/CKD-EPIcreatinine and 0.69 for the equation pair CAPA/LM-rev.
Disclosure statement
The authors report no conflict of interest. The authors alone are responsible for the content and writing of the article.
Additional information
Funding
References
- Grubb A, Lindstrom V, Jonsson M, et al. Reduction in glomerular pore size is not restricted to pregnant women. Evidence for a new syndrome: ‘shrunken pore syndrome’. Scand J Clin Lab Invest. 2015;75:333–340.
- Dardashti A, Nozohoor S, Grubb A, et al. Shrunken pore syndrome is associated with a sharp rise in mortality in patients undergoing elective coronary artery bypass grafting. Scand J Clin Lab Invest. 2016;76:74–81.
- Purde MT, Nock S, Risch L, et al. The cystatin C/creatinine ratio, a marker of glomerular filtration quality: associated factors, reference intervals, and prediction of morbidity and mortality in healthy seniors. Transl Res. 2016;169:80–90.
- Risch M, Risch L, Purde MT, et al. Association of the cystatin C/creatinine ratio with the renally cleared hormones parathyroid hormone (PTH) and brain natriuretic peptide (BNP) in primary care patients: a cross-sectional study. Scand J Clin Lab Invest. 2016;76:379–385.
- Strevens H, Wide-Swensson D, Torffvit O, et al. Serum cystatin C for assessment of glomerular filtration rate in pregnant and non-pregnant women. Indications of altered filtration process in pregnancy. Scand J Clin Lab Invest. 2002;62:141–147.
- Strevens H, Wide-Swensson D, Grubb A. Serum cystatin C is a better marker for preeclampsia than serum creatinine or serum urate. Scand J Clin Lab Invest. 2001;61:575–580.
- Kristensen K, Wide-Swensson D, Schmidt C, et al. Cystatin C, beta-2-microglobulin and beta-trace protein in pre-eclampsia. Acta Obstet Gynecol Scand. 2007;86:921–926.
- Christensson A, Grubb A, Molvin J, et al. The shrunken pore syndrome is associated with declined right ventricular systolic function in a heart failure population - the HARVEST study. Scand J Clin Lab Invest. 2016;76:568–574.
- Inker LA, Schmid CH, Tighiouart H, et al. Estimating glomerular filtration rate from serum creatinine and cystatin C. N Engl J Med. 2012;367:20–29.
- Grubb A, Horio M, Hansson LO, et al. Generation of a new cystatin C-based estimating equation for glomerular filtration rate by use of 7 assays standardized to the international calibrator. Clin Chem. 2014;60:974–986.
- Nyman U, Grubb A, Larsson A, et al. The revised Lund-Malmo GFR estimating equation outperforms MDRD and CKD-EPI across GFR, age and BMI intervals in a large Swedish population. Clin Chem Lab Med. 2014;52:815–824.
- Statistics Sweden. Migrations by region, age, gender and years [in Swedish]. Available from: www.scb.se [Accessed Jan 31 2017].
- DeLong ER, DeLong DM, Clarke-Pearson DL. Comparing the areas under two or more correlated receiver operating characteristic curves: a nonparametric approach. Biometrics. 1988;44:837–845.
- Soveri I, Berg UB, Bjork J, et al. Measuring GFR: a systematic review. Am J Kidney Dis. 2014;64:411–424.
- Carrie BJ, Myers BD. Proteinuria and functional characteristics of the glomerular barrier in diabetic nephropathy. Kidney Int. 1980;17:669–676.
- Scandling JD, Myers BD. Glomerular size-selectivity and microalbuminuria in early diabetic glomerular disease. Kidney Int. 1992;41:840–846.
- Deckert T, Kofoed-Enevoldsen A, Vidal P, et al. Size- and charge selectivity of glomerular filtration in Type 1 (insulin-dependent) diabetic patients with and without albuminuria. Diabetologia. 1993;36:244–251.
- Roberts M, Lindheimer MD, Davison JM. Altered glomerular permselectivity to neutral dextrans and heteroporous membrane modeling in human pregnancy. Am J Physiol. 1996;270:F338–F343.
- Blouch K, Deen WM, Fauvel JP, et al. Molecular configuration and glomerular size selectivity in healthy and nephrotic humans. Am J Physiol. 1997;273:F430–F437.
- Zayas CF, Guasch A. Early glomerular dysfunction in human renal allografts. Kidney Int. 2001;60:1938–1947.
- Oberbauer R, Nenov V, Weidekamm C, et al. Reduction in mean glomerular pore size coincides with the development of large shunt pores in patients with diabetic nephropathy. Exp Nephrol. 2001;9:49–53.