
Abstract
The analytical performance and clinical application of measuring insulin and connecting peptide (C-peptide) by point of care (POC) assay were evaluated. A POC assay system (SelexOn, Osang Healthcare Inc., Anyang-si, Korea) was evaluated for precision, linearity, limit of blank (LOB), and limit of detection (LOD). Method comparison was performed with the Cobas Elecsys insulin and C-peptide assay (Roche Diagnostics GmbH, Mannheim, Germany) using 215 and 201 patient specimens for insulin and C-peptide, respectively. For clinical application, insulin resistance indices were studied. Homeostasis model assessment (HOMA) 1 and 2, Quantitative insulin sensitivity check index (QUIKI), fasting insulin resistance index (FIRI), and other indices were evaluated. The coefficient of variation (CV) of imprecision for low, medium, and high concentrations was 10.8%1, 15.99%, and 12.05%, respectively, for insulin and 9.21%, 13.51%, and 13.77%, respectively, for C-peptide. The linearity was validated to 839.78 pmol/L for insulin and to 17.30 nmol/L for C-peptide. LOB and LOD were 8.05 and 9.72 pmol/L for insulin and 0.05 and 0.08 nmol/L for C-peptide, respectively. For the method comparison, the regression equation was y = 1.259x − 8.818 (r = 0.957) for insulin and y = 1.163x – 0.088 (r = 0.985) for C-peptide. The ROC value and overall accuracy were as follows: HOMA2 (C-peptide), 0.809, 79.7%; TyG, 0.788, 73.6%; CPR, 0.775, 74.8%; HOMA1, 0.725, 70.3%; QUIKI, 0.720, 70.3%; FIRI, 0.715, 70.1%; McAuley, 0.658, 65.1%; HOMA2 (Insulin), 0.645, 64.7%; Raynaud, 0.611, 61.4%, respectively. The POC assay system for insulin and C-peptide provided reliable results through a rapid and simple test that could be applied to clinical settings.
Introduction
Type 2 Diabetes mellitus (T2DM) is a heterogeneous metabolic disorder with features of hyperglycemia due to impairments in insulin secretion and insulin action. T2DM is a major health concern around the world, affecting 1 in 11 adults aged 20–79 years (415 million people) globally in 2015 [Citation1,Citation2]. The prevalence of diabetes is increasing globally in both developed and developing countries (425 million in 2017) and is projected to reach 642 million by 2040 [Citation1]. From 1987 to 2009, the prevalence of T2DM increased from 14.6% to 23.6%, which is a 62% increase over 20 years [Citation3]. More than 60% of T2DM patients are in the Asia Pacific region, with a prevalence ranging from 5.4% to 44.8% in 2010 [Citation4]. Risk factors for T2DM include older age, race/ethnicity (Asians, African Americans, American Indians, and Hispanics), male sex, low socioeconomic status, and insulin resistance [Citation5].
Insulin resistance presents as increased insulin concentration, impaired glucose tolerance, hypertension and dyslipidemia (increased TG and decreased HDL cholesterol) [Citation6]. One suggested mechanism is positive feedback caused by desensitization of insulin that leads to high blood glucose concentration, resulting in higher insulin secretion from pancreatic beta cells [Citation7,Citation8].
Insulin resistance is associated with and leads to clusters of abnormalities that increase small dense LDL particles, augment postprandial lipemia, increase renal sodium retention, and are associated with high uric acid concentration, increased resting heart rate due to dysfibrinolysis, polycystic ovarian syndrome and DM [Citation9]. DM is a metabolic disorder with features of high blood glucose concentration caused by impairments in insulin secretion and insulin action and is characterized by the presence of insulin resistance and relative insulin deficiency [Citation10,Citation11].
The gold standard method for measuring insulin resistance is the euglycemic clamp and intravenous glucose tolerance test. This test is only applied in relatively small groups or in epidemiological studies due to high technical requirements and costs [Citation12]. Surrogate markers have been developed to measure insulin resistance, including homeostasis assessment models 1, 2, etc [Citation9]. Most of these indices use variables from laboratory data including levels of fasting insulin, C-peptide, glucose, triglycerides, and others.
Recently, a point of care (POC) method using a lateral flow assay was developed to measure insulin and C-peptide. The analytical performance of the insulin and C-peptide assay was examined. The evaluation included imprecision, linearity, limit of blank (LOB), limit of detection (LOD), and method comparison according to Clinical and Laboratory Standards Institute (CLSI) guidelines [Citation13–16]. For clinical application, we evaluated the insulin resistance indices among DM and controls participating in a routine health program. Surrogate indices for insulin resistance were calculated by combining laboratory data, including fasting concentration of insulin, glucose, C-peptide, and triglyceride levels.
Materials and methods
This study was approved by the Institutional Review Board of Incheon St. Mary’s Hospital, which is a tertiary teaching hospital and affiliated hospital of The Catholic University of Korea. This study was conducted retrospectively with leftover patient samples (n = 233) that were ordered for insulin and C-peptide measurement by the Department of Endocrinology. Normal control samples (n = 151) were from subjects participating in a routine health program. Specimens were from patients or normal controls more than 18 years old after 8 h of fasting, with both EDTA and serum samples.
Diabetic patients were defined as patients taking anti-diabetic medication or diagnosed with diabetes by medical record. Routine health program subject (control) samples came from subjects who had never been diagnosed with diabetes based on medical records and had a fasting blood glucose level of less than 7.0 mmol/L [Citation17]. The normal control group was selected from those without metabolic syndrome and impaired fasting blood glucose.
Patient samples consisted of 215 (92.3%) patients with DM, 6 (2.6%) with impaired glucose tolerance, 2 (0.85%) with gestational DM, and 10 (4.29%), others. Among the 215 patients with DM, 33 (14.1%) also had hyperlipidemia. Among them, 215 patient specimens were used for insulin but only 201 specimens were used for the C-peptide method comparison because 14 cases had insufficient specimen volume. For clinical evaluation, 201 patient samples and 151 normal control samples were used. Patient's laboratory data other than insulin and C-peptide were extracted from medical records. For the 151 normal control samples, all laboratory data were measured. In addition, electronic medical records were searched for demographic, anthropometric, and baseline data including weight, height, drug history, and past history. Body mass index (BMI) was calculated as weight (kg)/height (m2).
Analytical performance
Whole blood samples were used for the POC assay system for insulin and C-peptide. Serum samples were used for the Cobas immunoassay. The POC assay system (SelexOn, Osang Healthcare Inc., Anyang-si, Korea) is composed of a cartridge that detects analytes in a rapid sandwich immunoassay using gold particles attached to a capture antibody and a POC analyzer that interprets information from the cartridge. A camera within the analyzer detects the intensity of the gold particles and allows densitometric analysis. Quantification is performed by comparing signals from the cartridge with an internal calibration curve. The Cobas Elecsys insulin and C-peptide assays were used along with the Cobas e601 analyzer (Roche Diagnostics GmbH, Mannheim, Germany). Claimed performance parameters for the Cobas Elecsys insulin and C-peptide assays were as follows: LOD, 1.39 pmol/L, 0.003 nmol/L; repeatability, CV 3.7%, 1.5%; intermediate precision, CV 4.6%, 2.3%, respectively.
Imprecision was evaluated as stated by CLSI guideline EP-05-A3 [Citation13]. Low, medium, and high concentrations of QC materials of insulin and C-peptide provided by the manufacturer were measured in duplicate twice a day for 20 working days. Within-run, between-run, between-day, and total imprecision were obtained for each concentration. Total imprecision was calculated by the squared root of the total sum, which was derived from addition of the squares of within-run, between-run, and between-day imprecision. The within-laboratory total imprecision was compared to specifications for imprecision due to biological variation [Citation14]. Desirable specifications for imprecision were 10.6% for insulin and 8.3% for C-peptide.
Linearity was evaluated as stated by CLSI guideline EP-06-A [Citation14]. For spiking materials, WHO International standard insulin (NIBSC, code 83/500) and C-peptide (NIBSC, code 13/146) were used to make 5 concentration levels. Low (L, 105.37 pmol/L) and high (H, 839.78 pmol/L) concentrations of insulin and low (L, 0.89 nmol/L) and high (H, 4.23 nmol/L) concentrations of C-peptide were obtained by addition of standard materials. Each concentration was measured two times and the mean values were compared with expected values. First, second, and third order polynomial regression analysis was performed. Criteria for deviation from linearity was defined as 15%. LOB and LOD were verified as stated by CLSI guideline EP-17-A2 [Citation16]. Blank whole blood specimens were spiked at known concentrations by the manufacturer. For verification of LOB and LOD, two blank and two spiked specimens were measured in duplicate for 20 total replicates, respectively. The method comparison was performed as stated by CLSI guideline EP-09-A3 [Citation18].
For normal control samples, blood chemistry tests were analyzed by an AU5800 automatic blood chemistry analyzer (Beckman Coulter, Miami, FL). Fasting blood glucose (FBS), total cholesterol, triglycerides (TG), high-density lipoprotein (HDL) cholesterol, low-density lipoprotein (LDL) cholesterol, glucose, blood urea nitrate (BUN), creatinine (Cr), total protein, albumin, aspartate aminotransferase (AST), alanine aminotransferase (ALT), gamma glutamyl transferase (GGT), and alkaline phosphatase (ALP) were measured.
Clinical applications
As insulin resistance is one of the underlying mechanism among T2DM, the calculated indices were analyzed [Citation7,Citation8]. Insulin resistance indices were selected using baseline measurements of laboratory tests. The equations of indices were as follows with I0 indicating 8 h fasting insulin concentration, G0 indicating 8 h fasting glucose, C0 indicating baseline C-peptide concentration and TG0 indicating fasting baseline triglyceride. Homeostasis model assessment of insulin resistance (HOMA) 1 and 2, C-peptide immunoreactivity (CPR), quantitative insulin sensitivity check index (QUIKI), fasting insulin resistance index (FIRI), and other indices were evaluated. HOMA2 was modeled with a web-based calculator (v2.2.3) (www.dtu.ox.ac.uk/homacalculator) and C-peptide was entered for calculation [Citation19]: TyG index = ln(TG0, mg/dL) × F0 (mg/dL)/2 [Citation20]; CPR = 20(C0 × G0) [Citation21]; Bennett = 1/[(logI0 (μU/ml) × logG0(mg/dL)] [Citation22]; HOMA1 = I0 (μU/ml) × G0 (mmol/L)/22.5 [Citation23]; QUIKI = 1/[(logI0 (μU/mL) + logG0 (mg/dL)] [Citation24]; FIRI = [G0(mmol/L)/I0 (μU/mL)]/25 [Citation25]; McAuley = e(2.63–0.28ln(I0, μU/mL) –0.31ln(TG0, mmol/L) [Citation26]; Raynaud = 40/I0 (μU/mL) [Citation27], respectively.
Statistical analysis
R software, version 3.4.4 (Free Software Foundation, Inc., Boston, MA) was used for calculation of imprecision and linearity calculation and plotting. In addition, t-tests were conducted and p values calculated. MedCalc for Windows, version 18.2.1 (MedCalc Software, Mariakerke, Belgium) was used to calculate linearity, LOB, and LOD, method comparison and area under the receiver operating characteristic curve (ROC). Passing Boblok analysis was used to generate regression equations, and agreement between the methods was plotted using the Bland Altman plot. In case of categorical data, Chi-square or Fischer's exact test were performed.
Results
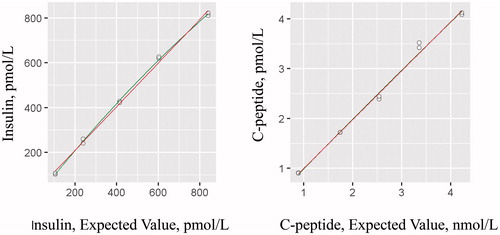
The within laboratory total CV for low (73.06 pmol/L), medium (262.38 pmol/L), and high (520.53 pmol/L) concentrations for insulin was 10.81%, 15.99%, and 12.05%, respectively. For C-peptide, the CV for low (0.38 nmol/L), medium (1.42 nmol/L), and high (3.71 nmol/L) concentration was 9.21%, 13.51%, and 13.77%, respectively (Supplementary Table 1). The claimed linearity was 13.89–1041.75 pmol/L for insulin and 0.066–4.965 nmol/L for C-peptide. In this study, linearity was studied from 105.3 to 839.78 for insulin. The regression equation was y = 0.974x + 15.05 (R2 = 0.996, recovery rate 91–101%). C-peptide linearity was studied from 0.89 to 4.23 nmol/L. The regression equation was y = 0.980x + 0.02 (R2=0.993, recovery rate 86–103%) (). The claimed LOB and LOD was 7.70 and 9.93 pmol/L for insulin and 0.046 and 0.062 nmol/L for C-peptide, respectively. The calculated LOB and LOD was 8.05 and 9.72 pmol/L for insulin and 0.05 and 0.08 nmol/L for C-peptide, respectively.
Figure 1. Linearity of the POC assay system for insulin and C-peptide. The red line and green lines indicate regression lines with linear and non-linear fit, respectively.
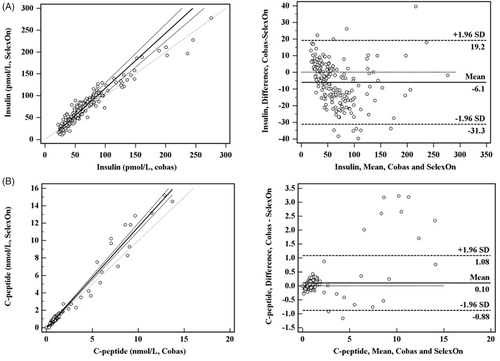
For method comparison, the measuring range was 21.81–275.72 pmol/L for insulin and 0.003–15.21 nmol/L for C-peptide. The correlation coefficient of the POC assay system was 0.957 with a regression equation of y = 1.259x − 8.818 (Sy.x = 2.5173) for insulin and 0.990 with regression equation of y = 1.163x − 0.088 (Sy.x = 2.3554) for C-peptide (). The value of the slope (95% confidence interval) was 1.259 (1.185–1.344) for insulin and 1.163 (1.120–1.204) for C-peptide. The intercept (95% confidence interval) was −8.818 (−12.966 to −5.619) for insulin and −0.088 (−0.1192 to 0.0592) for C-peptide.
Figure 2. Method comparison for POC assay system and Cobas Elecsys immunoassay system by e60l analyzer for (A) insulin (n = 215, r = 0.957) and (B) C-peptide (n = 201, r = 0.985). Measuring range was 21.81–275.72 pmol/L for insulin and 0.003 nmol/L to 15.21 nmol/L for C-peptide. The slope (95% confidence interval) was 1.259 (1.185–1.344) for insulin and 1.163 (1.120–1.204) for C-peptide. The y intercept (95% confidence interval) was −8.818 (−12.966 to −5.619) for insulin and −0.088 (−0.1192 to 0.0592) for C-peptide. SD of residuals (Syx) was 2.3554 and 0.2622 for insulin and C-peptide, respectively.
Baseline characteristics and clinical application
There were 151 routine health program participants in the normal control group and 201 patients in the diabetes group (). Weight, BMI, fasting blood glucose, fasting insulin, and fasting C-peptide were higher in the DM patient group compared to the normal control group. Triglyceride levels were greater in the DM patient group, but total cholesterol and LDL cholesterol levels were lower. HDL cholesterol concentration was not statistically different between groups. AST, ALT, and GGT were higher in the DM patient group but the mean values were within normal reference ranges (Supplementary Table 2). ALP was statistically similar between groups.
Table 1. Baseline characteristics of normal control and diabetes patients.
Except for the Raynaud index, most of the calculated insulin resistance indices were statistically significant in DM patient group (). Among them, the HOMA2 using C-peptide model revealed the highest ROC value of 0.809 with an overall accuracy of 79.7% followed by TyG, CPR, Bennett, HOMA1, QUIKI, FIRI, McAuley, HOMA2 using insulin, and Raynaud indices ().
Table 2. Receiver operating characteristic curve (ROC) of insulin resistance indices (IRI) of diabetes patients. Equation for HOMA2 index was available at internet site and the variables were entered. Other indices were calculated by the equations.
Discussion
We evaluated a POC assay system for insulin and C-peptide that required minimal technical skills and could be performed in resource-limited environments. If necessary, insulin and C-peptide could be measured together with blood glucose for insulin resistance indices or with HbA1c to enhance management of DM. As insulin resistance and diabetes are constantly increasing, POC assay of insulin and C-peptide could expand availability and accessibility of these tests for diagnosis and management of insulin resistance and diabetes. Minimal turn- around time by POC assays could support patient management in clinical settings and pediatric patients might be benefit from small specimen volume.
Most within run, between run and between day CVs were within desired specifications, except for the within run CV of level 2 material for insulin and C-peptide. However, total CV for insulin ranged from 10.81% to 15.99% and that for C-peptide ranged from 9.21% to 13.77% when measured for 20 d. Previous literature reported that the CV for insulin from 11 automated analyzers or ELISA assays ranged from 1.1% to 9.4%, as measured during 5 d [Citation28], and for 8 insulin assays, from 1.0% to 12.9% [Citation29]. In this study, we used a 20 × 2×2 protocol (duplicate assays 2 times a day for 20 working days), that might have increased CV. In the case of C-peptide, within-run CV ranged from 2% to 10% and between-run CV ranged from 2% to 18%, which was in line with previous studies [Citation30]. It may be that the POC device requires independent desirable specification, because the measuring mechanism and its object of POC might differ from centralized automated analyzers.
Validation of LOD revealed that the calculated LOD for insulin was 9.72 pmol/L, compared with 9.93 pmol/L claimed by manufacturer. In the case of C-peptide, the calculated LOD was 0.08 nmol/L, compared with 0.062 nmol/L claimed by manufacturer. The LOD of insulin was within the claimed range by manufacturer, while the LOD of C-peptide was slightly higher than the manufacturer’s claim.
One of the challenges in evaluating the performance of insulin and C-peptide is the lack of a standardized measurement method [Citation30]. In addition, as there are no other tests for insulin and C-peptide using a POC method, we compared the POC assay system with the Roche Cobas Elecsys immunoassay with e601 automated analyzer, which had higher precision and correlation values [Citation20,Citation21]. However, efforts for standardization of C-peptide are underway at several institutions [Citation31,Citation32].
Method comparison revealed that the correlation coefficient was 0.957 for insulin and 0.985 for C-peptide. Previous literature reported that the insulin concentration in serum is higher than that in plasma by a factor of 1.25 with an intercept of +7.77; our findings of corresponding values of 1.26 and −8.81, respectively, were similar [Citation27]. In the low end of the measuring range (below 50 pmol/L), the Cobas Elecsys immunoassay resulted in higher values compared to the POC assay system. At the high end of the measuring range (above 50 pmol/L), the Cobas Elecsys immunoassay resulted in lower values. These results are unexplainable, and further studies are required to identify the presence of possible systemic errors.
Diagnosing insulin resistance with normal glucose or impaired fasting glucose could be a marker for treatment, intervention or life style modification. Because the euglycemic glucose clamp is not feasible in clinical settings, various surrogate markers were evaluated in this study. Among them, HOMA2 using C-peptide showed the highest ROC and overall accuracy values in DM patients, followed by the TyG, CPR, Bennett, HOMA1, QUIKI, FIRI, McAuley, HOMA2 using insulin, and Raynaud indices. One purpose of this study was to search for an insulin resistance index for clinical settings, so we included 38 DM patients on insulin treatment for practical purposes. The samples from these DM patients might have affected the ROC values of indices using insulin, including HOMA2 using insulin. HOMA2 using C-peptide may have had the highest ROC and overall accuracy because it would have been unaffected by insulin treatment.
Each index has merits and limitations [Citation9]. The HOMA model evaluates beta cell function and insulin sensitivity [Citation23]. The CPR index has the highest correlation with glucose infusion rate by euglycemic insulin clamp method compared with HOMA1 and Bennett [Citation21]. The McAuley index is applied to normoglycemic individuals and QUICKI is a mathematical transformation of blood glucose and insulin concentrations [Citation33]. The previously reported cut offs for sensitivity and specificity were 5.8, 0.75, and 0.91 for McAuley and 0.33, 0.65, and 0.87 for QUIKI, respectively [Citation33]. We observed similar cut off values in this study, but the sensitivity and specificity were roughly 5% lower, possibly due to different study populations, demographics or ethnicity. The previously reported ROC and cut off values for TyG are 0.687, 4.55 for females and 0.673, 4.68 for males, respectively [Citation20], and our results were similar. Triglyceride levels were higher in the DM patient group, but total cholesterol and LDL cholesterol levels were lower, possibly due to medication taken by these patients. AST, ALT, and GGT levels were greater in DM patients than in the control group, but the mean values were within the normal reference ranges of the institute.
The limitation of this study is that we lacked criteria for acceptable precision values for insulin and C-peptide, and so a relatively high standard was used. The claimed linearity of the POC assay system was 13.89–1041.75 pmol/L for insulin and 0.066–4.965 nmol/L for C-peptide. However, the linearity evaluation was performed to 839.78 pmol/L for insulin and to 17.60 nmol/L for C-peptide, respectively. The groups had statistically more females, which might have increased insulin resistance indices. Most of the female normal controls were expected to be in a post-menopausal state, which might have affected the cut off level of the indices.
Conclusion
In conclusion, the POC assay system for insulin and C-peptide provided reliable results through a rapid and simple test. Insulin resistance indices were calculated using baseline insulin, C-peptide, glucose, and triglyceride levels, which might support management of patients in clinical settings.
Supplemental Material
Download MS Word (17.5 KB)Acknowledgements
The authors thank the Emergency Department and Laboratory Department staff for supporting this study. They thank Dr Jeongmin Lee (Department of Endocrinology, Seoul St. Mary's Hospital, Seoul, Korea) for giving generous advice related to this study. They thank Chankyu Kim, Se Woon Cho, and SangGil Bae for excellent technical assistance.
Disclosure statement
No potential conflict of interest was reported by the authors.
Additional information
Funding
References
- International Diabetes Foundation. IDF Diabetes Atlas-7th Edition. DiabetesAtlas [Internet]. Belgium. IDF: [cited 2018 Apr 20]. Available from: http://www.diabetesatlas.org/
- Zheng Y, Ley SH, Hu FB. Global aetiology and epidemiology of type 2 diabetes mellitus and its complications. Nat Rev Endocrinol. 2018;14:88–98.
- Nanditha A, Ma RC, Ramachandran A, et al. Diabetes in Asia and the Pacific: implications for the global epidemic. Diabetes Care. 2016;39:472–485.
- Zimmet PZ. Diabetes and its drivers: the largest epidemic in human history? Clin Diabetes Endocrinol. 2017;3:1–8.
- Skyler JS, Bakris GL, Bonifacio E, et al. Differentiation of diabetes by pathophysiology, natural history, and prognosis. Diabetes. 2017;66:241–255.
- Raven GM. Pathophysiology of insulin resistance in human disease. Physiol Rev. 1995;75:473–486.
- Leibiger I, Leibiger B, Berggren P. Insulin feedback action on pancreatic beta-cell function. FEBS Lett. 2002;532:1–6.
- Matthaei S, Stumvoll M, Kellerer M, et al. Pathophysiology and pharmacological treatment of insulin resistance. Endocr Rev. 2000;21:585–518.
- Singh B, Saxena A. Surrogate markers of insulin resistance: a review. World J Diabetes. 2010;1:36–47.
- American Diabetes Association. Diagnosis and classification of diabetes mellitus. Diabetes Care. 2010;33:S62–S69.
- DeFronzo RA, Ferrannini E. Insulin resistance. A multifaceted syndrome responsible for NIDDM, obesity, hypertension, dyslipidemia, and atherosclerotic cardiovascular disease. Diabetes Care. 1991;14:173–194.
- Ferrannini E, Mari A. How to measure insulin sensitivity. J Hypertens. 1998;16:895–896.
- Clinical and Laboratory Standard Institute. Evaluation of precision performance of quantitative measurement methods; approved guideline, CLSI document EP05-A3. 3rd ed. Wayne (PA): Clinical and Laboratory Standard Institute; 2014.
- Ricos C, Alvarez V, Cava F, et al. Current databases on biological variation: pros, cons and progress. Scand J Clin Lab Invest. 1999;59:491–500.
- Clinical and Laboratory Standard Institute. Evaluation of the linearity of quantitative measurement procedures: a statistical approach; approved guideline, CLSI document EP06-A. Wayne (PA): Clinical and Laboratory Standard Institute; 2003.
- Clinical and Laboratory Standard Institute. Evaluation of detection capability for clinical laboratory measurement procedures; approved guideline, CLSI document EP17-A2. Wayne (PA): Clinical and Laboratory Standard Institute; 2012.
- American Diabetes Association. Classification and diagnosis of diabetes: standards of medical care in diabetes-2018. Diabetes Caret. 2018;41:S13–S27.
- Clinical and Laboratory Standard Institute. Measurement procedure comparison and bias estimation using patient samples; approved guideline, CLSI document EP09-A3. Wayne (PA): Clinical and Laboratory Standard Institute; 2013.
- HOMA calculator [Internet]. United Kingdom. [cited 2018 Dec 01]. Available from: http://www.dtu.ox.ac.uk/homacalculator/
- Guerrero-Romero F, Simental ML, Gonzalez-Ortiz M, et al. The product of triglycerides and glucose, a simple measure of insulin sensitivity. Comparison with the euglycemic-hyperinsulinemic clamp. J Clin Endocrinol Metab. 2010;95:3347–3351.
- Ohkura T, Shiochi H, Fujioka Y, et al. 20/(fasting C-peptide × fasting plasma glucose) is a simple and effective index of insulin resistance in patients with type 2 diabetes mellitus: a preliminary report. Cardiovasc Diabetol. 2013;12:21–29.
- Sluiter W, Erkelens D, Terpstra P, et al. A mathematical approach II: approximation of the peripheral insulin resistance after oral glucose loading. BMC Public Health. 1976;25:245–249.
- Matthews DR, Hosker JP, Rudenski AS, et al. Homeostasis model assessment: insulin resistance and beta cell function from fasting plasma glucose and insulin concentration in man. Diabetologia. 1985;28:412–419.
- Katz A, Nambi SS, Mather K, et al. Quantitative insulin sensitivity check index: a simple, accurate method for assessing insulin sensitivity in humans. J Clin Endocrinol Metab. 2000;85:2402–2410.
- Duncan MH, Singh BM, Wise PH, et al. A simple measure of insulin resistance. Lancet. 1995;346:120–121.
- Hanson R, Pratley R, Bogardus C, et al. Evaluation of simple indices of insulin sensitivity and insulin secretion for use in epidemiologic studies. Am J Epidemiol. 2000;151:190–198.
- Raynaud E, Perez-Martin A, Brun JF, et al. Relationships between fibrinogen and insulin resistance. Atherosclerosis. 2000;150:365–370.
- Manley SE, Stratton IM, Clark PM, et al. Comparison of 11 human insulin assays: implications for clinical investigation and research. Clin Chem. 2007;53:922–932.
- Tohidi M, Arbab P, Ghasemi A. Assay-dependent variability of serum insulin concentrations: a comparison of eight assays. Scand J Clin Lab Invest. 2017;77:122–129.
- Little RR, Rohlfing CL, Tennill AL, et al. Standardization of C-peptide measurements. Clin Chem. 2008;54:1023–1026.
- Little RR, Wielgosz RI, Josephs R, et al. Implementing a reference measurement system for C-peptide: successes and lessons learned. Clin Chem. 2017;63:1447–1456.
- Little RR, Kinumi T, Connolly S, et al. Implementing a reference measurement system for C-peptide: an Addendum. [letter]. Clin Chem. 2017;63:1904–1905.
- Ascaso J, Pardo S, Real J, et al. Diagnosing insulin resistance by simple quantitative methods in subjects with normal glucose metabolism. Diabetes Care. 2003;26:3320–3325.