
Abstract
Mesenchymal stem cells (MSCs) for cardiovascular cell therapy are procured from different sources including bone marrow and adipose tissue. Differently located MSCs differ in growth potential, differentiation ability and gene expression when cultured in vitro, and studies show different healing abilities for different MSC subgroups. In this study, bone marrow derived MSCs (BMSCs) and adipose tissue derived MSCs (ADSCs) from six human donors with coronary artery disease were compared for growth potential and expression of target genes (Angpt1, LIF, HGF, TGF-β1 and VEGF-A) in response to exposure to 1% and 5% O2, for up to 48 h. We found greater growth of ADSCs compared to BMSCs. ADSCs expressed higher levels of Angpt1, LIF and TGF-β1 and equal levels of VEGF-A and HGF as BMSCs. In BMSCs, exposure to low oxygen resulted in upregulation of TGF-β1, whereas other target genes were unaffected. Upregulation was only present at 1% O2. In ADSCs, LIF was upregulated in both oxygen concentrations, whereas Angpt1 was upregulated only at 1% O2. Different response to reduced oxygen culture conditions is of relevance when expanding cells in vitro prior to administration. These findings indicate ADSCs as better suited for cardiovascular cell therapy compared to BMSCs.
Introduction
According to the WHO, of the 56.9 million deaths worldwide in 2016, more than half (54%) were due to the top 10 causes. Ischemic heart disease and stroke are the world’s biggest killers, accounting for a combined 15.2 (26.7%) million deaths in 2016. These diseases have remained the leading causes of death globally in the last 15 years [Citation1].
Cell therapy aiming at myocardial regeneration and repair has potential to counteract loss of function after coronary artery disease and improve quality of life. One strategy for cardiovascular cell therapy is to stimulate the endogenous regenerative mechanisms using mesenchymal stem cells (MSCs). These heterogeneous adult stem cells are located in almost all tissues in the body and can be derived from peripheral blood, adipose tissue or bone marrow in adults and umbilical cord, amnion, cord blood or placenta from neonatal tissues [Citation2]. Administration of MSCs into myocardium results in release of paracrine growth factors. These growth factors promote angiogenesis, inhibit apoptosis, ameliorate fibrosis through remodelling of the extracellular matrix, reduce inflammatory responses and enhance cardiomyocyte proliferation and/or differentiation [Citation3]. Although, the exact mode of action has not been determined, administering MSCs into the myocardium is a safe treatment for chronic heart failure [Citation4,Citation5]. However, one of the challenges for cardiovascular cell therapy is to select the optimal subtype of MSCs. MSCs are a heterogeneous population of cells, and although, they share the characteristics that define them as MSCs [Citation6], MSCs from different locations differ in other aspects [Citation7,Citation8]. In vivo, MSCs are located in perivascular niches where oxygen tension is low. In bone marrow, oxygen concentration is 1–6% and in adipose tissue concentration is 2–8% [Citation9]. Low oxygen tension, i.e. O2 concentration below ambient O2, is crucial for proliferation, plasticity, genetic stability and maintaining the undifferentiated state of MSCs [Citation10–12].
For autologous cardiovascular cell therapy, bone marrow-derived mesenchymal stem cells (BMSCs) and adipose tissue-derived mesenchymal stem cells (ADSCs) are the two most commonly used types of MSCs. They share many features, but differ in aspects that influence their suitability as therapeutic cells for cardiovascular disease. These aspects include ease of procurement, ease of obtaining clinically significant amounts of cells, and expression of paracrine factors influencing cardiac regeneration and/or repair [Citation7]. So far, there is evidence that ADSCs have superior characteristics making them more suitable for cell therapy for cardiovascular cell therapy. Gaebel et al. showed that MSCs from different locations have different healing abilities [Citation13], Kim et al. showed that ADSCs had greater angiogenic potential compared to BMSCs in a rat model of vascular ischemia [Citation14] and Rasmussen et al. found superior preservation of cardiac function after myocardial infarction using ADSCs compared to BMSCs [Citation15]. However, few studies have directly compared BMSCs and ADSCs from human donors, and how exposure to hypoxia in vitro influences target genes involved in myocardial regeneration and repair.
In this study, we compared paired BMSCs and ADSCs from donors with coronary artery disease, with a focus on growth potential during in vitro expansion, and expression of target genes related to cardiac functional improvement to determine the best source of MSCs for cardiovascular cell therapy. To test the hypothesis that culture of MSCs at lower oxygen tension generates stem cells more suited for cell therapy we also compared two different oxygen concentrations.
Target genes were selected based on their importance for cardiovascular cell therapy outcome. MSCs are believed to mediate angiogenesis through vascular endothelial growth factor (VEGF), hepatocyte growth factor (HGF) and angiopoetin 1 (Angpt1). These growth factors stimulate endothelial cell division, migration, stromal progenitor cell grafting into forming blood vessels and mobilize bone marrow endothelial precursors for neo-vascularization [Citation16]. MSCs also release tumor growth factor beta 1 (TGF-β1), that upregulates endothelial cell expression of VEGF [Citation17], and inhibit immunological inflammation through downregulation of dendritic cells and T-cells [Citation18]. The release of leukemia inhibitory factor (LIF) also reduces inflammation [Citation19]. For these reasons, the expression of VEGF-A, HGF, Angpt1, TGF-β1 and LIF was chosen to study the impact of oxygen tension in paired samples of BMSCs and ADSCs from the same donor.
Material and methods
Patients/material
The patient cohort consisted of five males and one female, age 55–85 years (mean age 71 years) undergoing coronary artery bypass grafting via median sternotomy. Paired samples of bone marrow from the sternum and adipose tissue from the subcutaneous layer at the incision site were collected. For demographic details and details of procured starting material, see . All patients consented to the study, and the study was approved by the Regional Ethics Committee at Uppsala, Sweden (Dnr 2012/139).
Table 1. Demographic details of the patients included in the study.
Isolation of mesenchymal stem cells from bone marrow and adipose tissue
BMSC cultures were derived from bone marrow aspirates by direct adherence methodology. Briefly, bone marrow aspirate collected during surgery was diluted 1:1 with Alpha-MEM (Life Technologies, Paisley, UK) containing heparin, 100 IE/ml (LEO Pharma A/S Ballerup, Copenhagen, Denmark), followed by centrifugation at 300 g for 10 min at 4 °C. The cell pellet was resuspended in complete cell culture medium (Alpha-MEM, Life Technologies, Paisley, UK) with 20% Fetal Bovine Serum (FBS, Australian Origin, Lonza BioWhittaker TM, Verviers, Belgium) and 1% Penicillin–Streptomycin (GE Healthcare Life Science, Wien, Austria) and the cell suspension transferred to cell culture flasks for primary culture.
Cultures of ADSCs were established by washing lipoaspirates with phosphate-buffered saline (PBS). ADSCs were dissociated from the adipose tissue by incubating with 1:1 v/v collagenase (Collagenase NB4 standard grade, SERVA Electrophoresis, GmbH, Heidelberg, Germany) in Hank´s Balanced Salt Solution (Gibco, Paisley, UK) for 45 min at 37 °C, followed by centrifugation at 300 g for 5 min at 21 °C. The cell pellet was suspended in complete cell culture medium (Alpha-MEM, Life Technologies, Paisley, UK) with 10% Fetal Bovine Serum (FBS, Australian Origin, Lonza BioWhittaker TM, Verviers, Belgium) and 1% Penicillin–Streptomycin (GE Healthcare Life Science, Vienna, Austria). The cell suspension was filtered through a 100 µm cell strainer, before centrifuging at 300 g for 10 min at 21 °C and the pellet resuspended in fresh culture medium. The procedure was repeated using a 60 µm cell strainer prior to seeding cells for primary culture.
Characterization of mesenchymal stem cells
BMSCs and ADSCs were characterized by morphology assessment, flow cytometry and multilineage differentiation capacity to verify growth and expansion of MSCs. The morphological appearance of cell cultures was evaluated under standard microscopy. MSC identity was confirmed by flow cytometric analysis of cell surface markers using a panel of antibodies based on ISCT guidelines [Citation6] Panel included positive markers CD90, CD105, CD73 and negative markers CD34, CD11b, CD19, CD 45 and HLA-DR in a cocktail (BD Stemflow™ hMSC Analysis Kit, BD Biosciences, San Jose, USA) on BD FACS Canto™ II flow cytometry system. MSC phenotype with capacity for tri-linage development was confirmed by culturing cells in StemPro differentiation media (Gibco® Life Technologies, Life Technologies, Paisley, UK) and subsequent staining for adipogenesis (lipids) with Oil red O, chondrogenesis (proteoglycans) with Alcian blue and osteogenesis (alkaline phosphatase activity) with Alizarin Red. Undifferentiated cells cultured in complete medium served as controls.
Comparison of growth potential
Cells were plated (2000 cells/cm2) in 75 cm2 culture flasks and cultured in +37 °C, 5% CO2, 16% O2 until approximately 80% confluence, equaling passage 1. After trypsination, cell number was calculated and cells seeded in new flasks and cultured under same conditions until confluence, equaling passage 2. Number of days until confluence and yield after reaching confluence was determined for each donor for both BMSCs and ADSCs cultures.
Gene expression analysis
Gene expression analysis of selected target genes (Angpt1, HGF, TGF-β1, LIF and VEGF-A) was performed with BMSCs and ADSCs cultured in reduced oxygen, 5% O2 and 1% O2, respectively. BMSCs and ADSCs from passage 1 were thawed and seeded at 4 × 10³ cells/cm2 in 6 well plates (Sarstedt, Nümbrecht, Germany) and incubated for 2 days at +37 °C, 5% CO2, 16% O2, in complete cell culture medium.
On day 3 the medium was changed to equilibrated serum-free media (MesenCult-XF, Stemcell Technologies, Cambridge, UK) to induce serum starvation. Subsequently, plates were incubated at 5% O2 or 1% O2. Plates were removed from culture after 6, 24 and 48 h and cells harvested for total RNA extraction. RNA was extracted (RNeasy Mini Plus prep kit, Qiagen, Sollentuna, Sweden) according to manufacturer’s instructions. Duplicate experiments were pooled. RNA was stored at −80 °C until further analysis.
Total RNA quantity and purity was measured with a NanoDrop 1000 Spectrophotometer (Thermo Fisher Scientific, Waltham, MA, USA) and quality was determined using Agilent RNA 6000 Nano Kit (Agilent Technologies, Waldbronn, Germany) in an Agilent 2100 Bioanalyzer (Agilent Technologies, Palo Alto, CA, USA).
Two microgram of total RNA was used to synthesize cDNA using High Capacity cDNA Reverse Transcription kit, Applied Biosystems. (For qRT-PCR, 100 ng of cDNA was added to TaqMan Gene Expression Assay and run as triplicates with probes (Angpt1: GAGACCCAGGTACTAAATCAAACTT, LIF:TTATTCTCTATTACACAGCCCAGGG, HGF:CATTCACTTGCAAGGCTTTTGTTTT, TGF-β1:AGTACAGCAAGGTCCTGGCCCTGTA, VEGFA:ACATCACCATGCAGATTATGCGGAT).
Target gene values were normalized against the expression of housekeeping gene, GAPDH, to get relative gene expression values as Δ-Ct-values.
Statistical analysis
Data is expressed as mean ± standard deviations (SD). Cells were divided into four subgroups based on cell type and oxygen exposure for gene expression experiments: BMSCs 1%, BMSCs 5%, ADSCs 1% and ADSCs 5%, Subgroups were compared at three time points; 6, 24 and 48 h of reduced oxygen exposure using Kruskal–Wallis test by ranks for two or more groups. Identified differences between groups were further analyzed using Wilcoxon rank sum test for pairwise comparisons of gene expression between two groups. p < .05 was considered statistically significant.
Results
Characterization of ADSC and BMSC
Cell culture expansions from both bone marrow and adipose tissue fulfilled the International Society for Cell and Gene Therapy (ISCT) minimal criteria for MSCs [Citation6], i.e. exhibited plastic adherence, correct cell surface markers and multilineage differentiation capacity.
Morphological appearance
Both BMSCs and ADSCs formed heterogeneous colonies containing various cell shapes (thin elongated triangular and larger flattened discoid cells) in primary culture. After passage 2–3 both ADSCs and BMSCs displayed a more homogenous in vitro fibroblast-like morphology with adherent elongated to spindle shaped cells ().
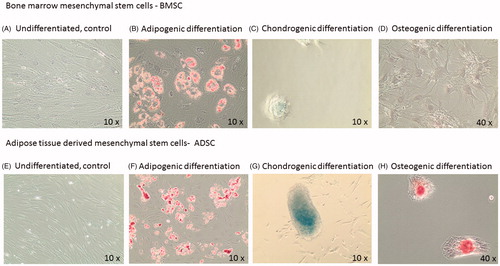
Figure 1. Representative images from differentiated mesenchymal stem cells. A–D: bone marrow mesenchymal cells, BMSCs and E–H: adipose derived mesenchymal cells, ADSCs. Panel B and F are stained with Red Oil for adipocyte identification. Panel C and G are stained with Alcian Blue for chondrocyte identification. Panel D and H are stained with Alizarian Red for osteoblast identification.
Surface markers analyzed by flow cytometry
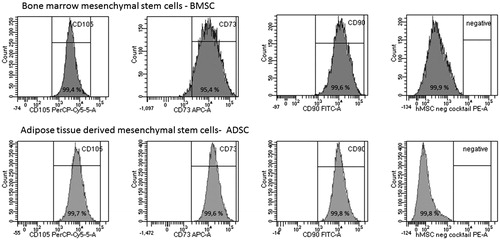
Flow cytometry analysis of cell surface markers showed that both BMSCs and ADSCs fulfilled ISCT minimal criteria for MSCs and contained near-pure populations of MSCs ().
Figure 2. Analysis of positive and negative cell surface antigen expression in expansions of bone-marrow derived mesenchymal stem cells, BMSCs (top row) and adipose tissue derived mesenchymal stem cells, ADSCs (bottom row). Representative plots from one study participant. Percentage (%) of positive cells are shown in each peak for markers CD105, CD73, CD90 and for the cells lacking the negative cocktail containing CD34, CD11b, CD19, CD45, HLA-DR. Gating was performed using isotype control and unstained cells (data not shown).
Multilineage differentiation characterization:
Both BMSCs and ADSC had the capacity to differentiate into adipocytes, chondrocytes and osteoblasts when cultured in mesenchymal differentiation media. ADSCs displayed a more distinct ability to undergo chondrogenic and osteogenic differentiation compared to BMSCs (). BMSCs were less adherent and more prone to detachment.
Growth potential
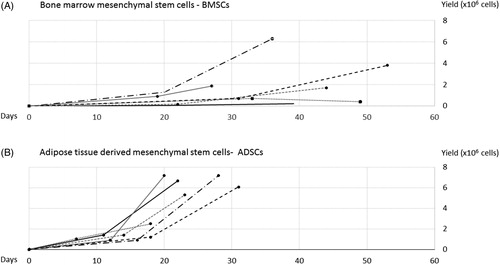
ADSCs reached confluence faster compared to BMSCs from the same donor. Passage 1 was reached on average after 13 ± 4 days for ADSCs, and after 24 ± 6 days for BMSCs, p = .016. Passage 2 was reached on average after 11 ± 2 days for ADSCs, and 17 ± 5 days for BMSCs, p = .018. Furthermore, cell number yield after culture was numerically higher in ADSCs compared to BMSCs but this did not reach statistical significance (mean yield 6.0 ± 2.0 × 10⁶ cells, vs. 2.4 ± 2.3 × 10⁶ cells, p = 0.12). For BMSCs cultures, yield exhibited large individual differences ().
Figure 3. Time to confluency (days) versus yield (total cell number) for passage 1 and 2, paired samples from donor 1 to 6. Top diagram, A: shows growth and yield for bone marrow mesenchymal stem cells (BMSCs) and bottom diagram, B: adipose tissue derived mesenchymal stem cells (ADSCs). On average, 80% confluency was reached in 13 ± 4 days (ADSCs) and 24 ± 6 days (BMSCs), passage 1, and 11 ± 2 days (ADSCs) and 17 ± 5 days (BMSCs), passage 2. After the second passage, the yield was numerically higher from ADSCs compared with BMSCs, although, this did not reach significance.
Gene expression analysis using RT-PCR
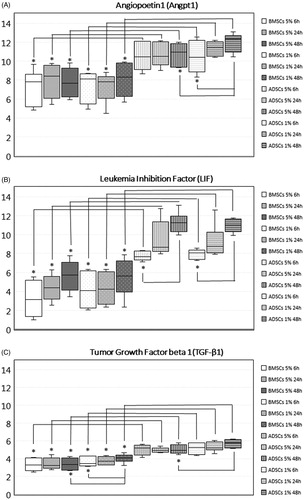
Levels of Angpt1, LIF and TGF-β1 were significantly higher in ADSCs compared to BMSCs. The higher levels of Angpt1, LIF and TGF-β1 in ADSCs compared to BMSCs were found both when exposed to 1% and 5% O2, and regardless of examined time point (6, 24 or 48 h) (). HGF and VEGF-A were expressed at the same level in both types of MSCs (data not shown).
Figure 4. Gene expression of target genes in MSCs from different tissues and/or MSCs exposed to different oxygen concentration. Data expressed as box plots; median values, standard deviations and range for adipose tissue derived stem cells (ADSCs) and bone marrow derived stem cells (BMSCs) cultured for 6, 24 and 48 h in 5% O2 and 1% O2. Significant differences between groups are defined as p value below .001 and marked with *. ADSCs expressed significantly higher levels of angiopoetin1 (Angpt1), leukemia inhibition factor (LIF) and tumor growth factor beta 1 (TGF-β1) compared to BMSC, both when cultured in 5% O2, and when cultured in 1% O2 at all examined time points. The expression of Angpt1 increased over time in ADSCs 1% O2, and was after 48 h significantly higher compared to ADSCs 1% O2 cultured for 6 h, and compared to ADSCs 5% O2. The expression of LIF increased over time in ADSCs but not in BMSCs, and was significantly higher after 48 h compared to 6 h. The expression of TGF-β1 increased in BMSCs 1% O2 and was significantly upregulated after 48 h compared to 6 h. Due to the increased expression of TGF-β1 in BMSCs 1% O2, expression was significantly higher after 48 h in BMSCs 1% O2 compared to BMSCs 5% O2. In ADSCs, the expression also increased but the increase did not reach significance. However, after 48 h, the expression of TGF-β1 was significantly higher in ADSCs 1% O2 compared to ADSCs 5% O2.
Angpt1, LIF and TGF-B1 expression was further analyzed using Wilkinsons rank sum test comparing paired samples from the donors.
Angpt1
The expression of Angpt1 was significantly higher in ADSCs compared to BMSCs both in cells exposed to 5% O2 and to cells exposed to 1% O2 at all examined time points. In ADSCs at 1% O2, the level of Angpt1 increased over time, with expression at 48 h significantly higher compared to the expression detected at 6 h, p < .001. Therefore, the expression of Angpt1 at 48 h was significantly higher in ADSCs at 1% O2 compared to 5% O2.
LIF
Like Angpt1, the expression of LIF was significantly higher in ADSCs compared to BMSCs at all-time points and regardless of oxygen concentration. In ADSCs, but not in BMSCs, the expression of LIF increased over time, reaching a significant difference after 48 h compared to 6 h of low oxygen exposure, p < .001.
There was no difference in the expression of LIF in BMSCs between 5% and 1% O2 nor in ADSCS between the different oxygen levels.
TGF-β1
The expression of TGF-β1 was higher in ADSCs compared to BMSCs, for all examined time points and oxygen tensions, p < .001. In BMSCs at 1% O2 the expression of TGF-β1 increased over time, with significantly higher expression at 48 h compared to 6 h, p < .001. Resulting from the increase in TGF-β1 expression in BMSCs 1% O2 but not in BMSCs 5% O2, TGF-β1 was significantly higher expressed in BMSCs 1% O2 compared to BMSCs 5% O2 after 48 h, p > .001. Expression increased in ADSCs at 1% O2 over time but did not reach statistical significance. However, after 48 h the expression of TGF-β1 was significantly higher in ADSCs 1% O2 compared to ADSCs 5% O2, p < .001.
HGF and VEGF-A
We found no significant differences in the expression of HGF and VEGF-A, i.e. these genes were expressed at the same level in both types of MSCs and at the same level in different oxygen tensions (data not shown).
Discussion
The main findings of this study was faster growth and higher expression of pro-angiogenetic and anti-inflammatory factors in ADSCs compared with BMSCs in paired samples from six donors with coronary artery disease. This supports ADSC as potentially better suited for advanced therapy products for autologous cardiovascular cell therapy compared to BMSC when patients have established coronary disease. These findings are consistent with previous paired studies showing that ADSCs have greater growth potential compared to BMSC from rats [Citation20] and from humans without cardiovascular disease [Citation21,Citation22].
In this study, we isolated and expanded MSCs from elderly donors undergoing coronary artery bypass grafting, i.e. the donors are representative of cell therapy patients receiving treatment with autologous MSCs.
Both BMSCs and ADSCs could be cultured from all donors, however, from adipose tissue the yield of ADSCs after two passages were more than double the amount of BMSCs from bone marrow, although, this did not reach statistical significance. This is of importance since growth potential is essential for reaching clinically significant cell numbers for cell therapy. Collection of bone marrow from the iliac crest or sternum is invasive, and large volumes of bone marrow is required since stem cell density is low [Citation23] and decreases with age. Collection of subcutaneous adipose tissue is normally conducted by liposuction. Less volume of lipoaspirate is required since adipose tissue has a higher stem cell density [Citation24–27]. MSCs may normally not be collected in high enough numbers to be used directly in therapy and, therefore, need to be expanded in vitro through cell culture. From the donors in this study, very small quantities of bone marrow and lipoaspirates were collected. On average, only 1 mL of bone marrow and 5 mL of adipose tissue were extracted from each donor. Isolation, culture and expansion of MSCs from these small volumes show that autologous cell therapy treatments are possible despite scarcity during procurement. The low volume of available bone marrow and lipoaspirates did not affect the comparisons between ADSCs/BMSCs, since the experiments were performed using the same amount of MSCs. In culture, ADSCs have higher growth potential, less senescence and higher genetic stability compared to BMSCs [Citation7]. BMSCs, but not ADSCs, display an age-dependent loss of growth potential, yield and differential potential [Citation22,Citation28]. The faster growth of ADSCs confirmed in our study results in shorter time to treatment, reduced costs and reduced risk of genetic drift and contamination of cell culture in vitro.
We report on higher expression of Angpt1, LIF and TGF-β1 in ADSCs compared to BMSCs. Higher levels of Angpt1, LIF and TGF-β1 are likely to be beneficial for cardiovascular repair/regeneration. Angpt1 is associated with neo-vascularization. Both LIF and TGF-β1 inhibit inflammatory responses. Thus, the gene expression profile supports ADSCs as more favorable for cell therapy. Other studies confirm our findings of the equal levels of VEGF in ADSCs and BMSCs, but report contradicting findings for HGF where both Naftali-Shani et al. [Citation29] and Li et al. [Citation21] found higher levels of HGF in BMSCs in contrast to our findings where we saw no difference in the expression of HGF.
Early clinical trials were done with MSCs expanded in ambient oxygen concentrations. Later research has highlighted the influence on hypoxic culture on MSCs and the need to mimic in vivo hypoxia during in vitro expansion [Citation30,Citation31]. Hypoxia influences the expression of paracrine factors. The short-term effects vary and depend on oxygen tension, seeding density and MSC source effects of hypoxia, whereas long-term hypoxia shows consistent beneficial effects regardless of MSCs source [Citation32].
Exposure to hypoxic conditions for a prolonged period of time results in environmental adaptation of cells by upregulation of pro-angiogenic genes such as VEGF and angiopoetin1/2 [Citation12,Citation16,Citation33–35] and increased secretion of anti-apoptotic and proangiogenic factors [Citation34]. Since MSCs are administrated into a hypoxic environment, the response of the cells to hypoxia might influence therapeutic response [Citation3]. We expected exposure to 1% O2 to result in higher levels of target genes compared to exposure to 5% O2. However, the effect of oxygen concentration on target gene expression differed between BMSCs and ADSCs. In ADSCs, the response was more pronounced, with significantly higher levels of LIF in cells exposed to 5% O2 and significant higher levels of LIF as well as Angpt1 and TGF-β1 (although, the increases was non-significant) in cells exposed to 1% O2, whereas in BMSCs, only TGF-β1 increased in BMSCs exposed to the lower oxygen tension. The response to oxygen tension developed over time.
One explanation might be that BMSCs and ADSCs reside in different hypoxic niches in vivo. For BMSCs, which reside in a physiological niche of 1–6%O2, the experimental settings were similar to their natural in vivo environment. But for ADSCs which reside in a niche of 2–8% O2, exposure to 1% O2 equals sub-physiological oxygen levels and exposure to 5% equals physiological levels. Hence, ADSCs respond to 1% O2 by upregulating genes.
The most studied gene in regards to cell therapy is VEGF. In human BMSCs, reducing the oxygen from 21% to 1–5% O2 resulted in upregulation of VEGF after 48 h as well as after 10 days [Citation36]. In human ADSCs, long-term hypoxia resulted in higher expression and higher secretion of VEGF and HGF [Citation35,Citation37,Citation38]. In one of the studies, the effect of hypoxia on VEGF was not seen until after 4 days, with increasing levels of VEGF up to 13 days of culture [Citation35]. We did not detect significant differences in the expression of VEGF-A in response to neither oxygen concentration nor time. One explanation could be that the relatively short exposure of 48 h was not enough to evoke a response in the cells and that prolonged culture in reduced oxygen would have resulted in increase of VEGF-A expression in our study. Another explanation may be that comparison between 1% and 5% O2 does not produce effects of the same impact as when comparing atmospheric oxygen concentration of 21% to hypoxic culture in 1–5% O2.
There are several limitations to this study. The number of study subjects was small and the gender distribution not equal with only female. Although, the study benefits from having paired samples, known donor-related factors may influence both growth and gene expression [Citation20,Citation39,Citation40]. Cell expansions were performed in 16% O2, slightly lower than ambient oxygen concentration, but not as low as physiological oxygen concentrations for MSCs [Citation9]. Therefore, growth reflects in vitro culture conditions rather than in vivo.
After expansion, cells from passage 1 were frozen, and then thawed for the gene expression studies. These studies were performed in two different sub-atmospheric hypoxic conditions. Since the physiological oxygen levels for cardiac tissue is 4–14% and reduced below 2% for ischemic cardiac tissue [Citation9], we designed our study to mimic the healthy and the diseased environment to which MSCs are exposed during administration/engraftment. In our study, the higher oxygen concentration serves as a control to the lower oxygen concentration, which acts as a model for ischemia.
The cells were subjected to simultaneous serum starvation that is now known to effect gene expression [Citation41]. However, the comparison between ADSCs and BMSCs and the comparison between different oxygen levels holds true, regardless of the influence of serum starvation.
Furthermore, to strengthen our study we could have included protein expression studies to confirm findings of upregulated proangiogenic genes.
In conclusion, this study supports adipose tissue as a better source for MSCs to be used as a cell therapy product for cardiovascular cell therapy. In our study, ADSCs were easier to expand due to faster growth and numerically higher yield, and the cells expressed higher levels of target genes important for cardiovascular cell therapy. Exposure of ADSCs to 1% O2 increased the expression of Angpt1, LIF and TGF-β1 compared to 5%. In BMSCs, the growth and yield were inferior, and the expression of target genes was lower. Additional reduction in oxygen concentration had minor effect on target gene expression. Further studies on the effect of oxygen on gene expression profiles in the studied cell types are warranted to determine the optimal oxygen concentration and exposure time for cell expansion in vitro prior to administration of a future cell therapy product.
Acknowledgements
We thank Jessica Carlsson for her contribution towards this study with fruitful discussions and input on the choice of statistical methods and analysis.
Disclosure statement
No potential conflict of interest was reported by the authors.
References
- WHO. Cardiovascular diseases: World Health Organisation; 2019 [cited 2019 Jun 28]. Available from: https://www.who.int/cardiovascular_diseases/en/
- Hass R, Kasper C, Bohm S, et al. Different populations and sources of human mesenchymal stem cells (MSC): a comparison of adult and neonatal tissue-derived MSC. Cell Commun Signal. 2011;9(1):12.
- Singh A, Singh A, Sen D. Mesenchymal stem cells in cardiac regeneration: a detailed progress report of the last 6 years (2010-2015). Stem Cell Res Ther. 2016;7(1):82.
- Wang Y, Xu F, Ma J, et al. Effect of stem cell transplantation on patients with ischemic heart failure: a systematic review and meta-analysis of randomized controlled trials. Stem Cell Res Ther. 2019;10(1):125.
- Strauer BE, Steinhoff G. 10 years of intracoronary and intramyocardial bone marrow stem cell therapy of the heart: from the methodological origin to clinical practice. J Am Coll Cardiol. 2011;58(11):1095–1104.
- Dominici M, Le Blanc K, Mueller I, et al. Minimal criteria for defining multipotent mesenchymal stromal cells. The International Society for Cellular Therapy position statement. Cytotherapy. 2006;8(4):315–317.
- Strioga M, Viswanathan S, Darinskas A, et al. Same or not the same? Comparison of adipose tissue-derived versus bone marrow-derived mesenchymal stem and stromal cells. Stem Cells Dev. 2012;21(14):2724–2752.
- Ivanovic Z. Hypoxia or in situ normoxia: the stem cell paradigm. J Cell Physiol. 2009;219(2):271–275.
- Haque N, Rahman MT, Abu Kasim NH, et al. Hypoxic culture conditions as a solution for mesenchymal stem cell based regenerative therapy. ScientificWorldJournal. 2013;2013:1–12.
- Estrada JC, Albo C, Benguria A, et al. Culture of human mesenchymal stem cells at low oxygen tension improves growth and genetic stability by activating glycolysis. Cell Death Differ. 2012;19(5):743–755.
- Cipolleschi MG, Dello Sbarba P, Olivotto M. The role of hypoxia in the maintenance of hematopoietic stem cells. Blood. 1993;82(7):2031–2037.
- Abdollahi H, Harris LJ, Zhang P, et al. The role of hypoxia in stem cell differentiation and therapeutics. J Surg Res. 2011;165(1):112–117.
- Gaebel R, Furlani D, Sorg H, et al. Cell origin of human mesenchymal stem cells determines a different healing performance in cardiac regeneration. PLoS One. 2011;6(2):e15652–e52.
- Kim Y, Kim H, Cho H, et al. Direct comparison of human mesenchymal stem cells derived from adipose tissues and bone marrow in mediating neovascularization in response to vascular ischemia. Cell Physiol Biochem. 2007;20(6):867–876.
- Rasmussen JG, Frobert O, Holst-Hansen C, et al. Comparison of human adipose-derived stem cells and bone marrow-derived stem cells in a myocardial infarction model. Cell Transplant. 2014;23(2):195–206.
- Efimenko A, Starostina E, Kalinina N, et al. Angiogenic properties of aged adipose derived mesenchymal stem cells after hypoxic conditioning. J Transl Med. 2011;9(1):10.
- Ferrari G, Cook BD, Terushkin V, et al. Transforming growth factor-beta 1 (TGF-beta1) induces angiogenesis through vascular endothelial growth factor (VEGF)-mediated apoptosis. J Cell Physiol. 2009;219(2):449–458.
- Samsonraj RM, Raghunath M, Nurcombe V, et al. Concise review: multifaceted characterization of human mesenchymal stem cells for use in regenerative medicine. Stem Cells Transl Med. 2017;6(12):2173–2185.
- Sassoli CO, Bani D, Formigli L. Cardiac progenitor cells as target of cell and growth factor-based therapies for myocardial regeneration. Stem Cell Res Ther. 2013;S9. https://www.longdom.org/open-access/cardiac-progenitor-cells-as-target-of-cell-and-growth-factor-based-therapies-for-myocardial-regeneration-2157-7633.S9-004.pdf.
- Lotfy A, Salama M, Zahran F, et al. Characterization of mesenchymal stem cells derived from rat bone marrow and adipose tissue: a comparative study. Int J Stem Cells. 2014;7(2):135–142.
- Li CY, Wu XY, Tong JB, et al. Comparative analysis of human mesenchymal stem cells from bone marrow and adipose tissue under xeno-free conditions for cell therapy. Stem Cell Res Ther. 2015;6(1):55.
- Chen HT, Lee MJ, Chen CH, et al. Proliferation and differentiation potential of human adipose-derived mesenchymal stem cells isolated from elderly patients with osteoporotic fractures. J Cell Mol Med. 2012;16(3):582–593.
- Bernardo ME, Locatelli F, Fibbe WE. Mesenchymal stromal cells. Ann N Y Acad Sci. 2009;1176(1):101–117.
- Fraser JK, Wulur I, Alfonso Z, et al. Fat tissue: an underappreciated source of stem cells for biotechnology. Trends Biotechnol. 2006;24(4):150–154.
- De Ugarte DA, Morizono K, Elbarbary A, et al. Comparison of multi-lineage cells from human adipose tissue and bone marrow. Cells Tissues Organs. 2003;174(3):101–109.
- Eto H, Suga H, Matsumoto D, et al. Characterization of structure and cellular components of aspirated and excised adipose tissue. Plast Reconstr Surg. 2009;124(4):1087–1097.
- Hassan M, Latif N, Yacoub M. Adipose tissue: friend or foe? Nat Rev Cardiol. 2012;9(12):689–702.
- Kern S, Eichler H, Stoeve J, et al. Comparative analysis of mesenchymal stem cells from bone marrow, umbilical cord blood, or adipose tissue. Stem Cells. 2006;24(5):1294–1301.
- Naftali‐Shani N, Itzhaki‐Alfia A, Landa‐Rouben N, et al. The origin of human mesenchymal stromal cells dictates their reparative properties. J Am Heart Assoc. 2013;2:e000253.
- Kastrup J, Mygind ND, Qayyum AA, et al. Mesenchymal stromal cell therapy in ischemic heart disease. Scand Cardiovasc J. 2016;50(5–6):293–299.
- Kim DS, Ko YJ, Lee MW, et al. Effect of low oxygen tension on the biological characteristics of human bone marrow mesenchymal stem cells. Cell Stress Chaperones. 2016;21(6):1089–1099.
- Atkinson K. The biology and therapeutic application of mesenchymal cells, 2 volume set. Hoboken, New Yersey: John Wiley & Sons; 2017.
- Krock BL, Skuli N, Simon MC. Hypoxia-induced angiogenesis: good and evil. Genes Cancer. 2011;2(12):1117–1133.
- Tsai CC, Yew TL, Yang DC, et al. Benefits of hypoxic culture on bone marrow multipotent stromal cells. Am J Blood Res. 2012;2(3):148–159.
- Rasmussen JG, Frobert O, Pilgaard L, et al. Prolonged hypoxic culture and trypsinization increase the pro-angiogenic potential of human adipose tissue-derived stem cells. Cytotherapy. 2011;13(3):318–328.
- Bourin P, Gadelorge M, Peyrafitte JA, et al. Mesenchymal progenitor cells: tissue origin, isolation and culture. Transfus Med Hemother. 2008;35(3):160–167.
- Antebi B, Rodriguez LA, Walker KP, et al. Short-term physiological hypoxia potentiates the therapeutic function of mesenchymal stem cells. Stem Cell Res Ther. 2018;9(1):265–265.
- He J, Cai Y, Luo LM, et al. Hypoxic adipose mesenchymal stem cells derived conditioned medium protects myocardial infarct in rat. Eur Rev Med Pharmaco. 2015;19:4397–4406.
- Pham VP, Ngoc BY, Ngoc KP. Hypoxia promotes adipose-derived stem cell proliferation via VEGF. BMRAT. 2016;3:476–482.
- Varghese J, Griffin M, Mosahebi A, et al. Systematic review of patient factors affecting adipose stem cell viability and function: implications for regenerative therapy. Stem Cell Res Ther. 2017;8(1):45.
- Qayyum AA, Kaur KP, Mathiasen AB, et al. Influence of patient related factors on number of mesenchymal stromal cells reached after in vitro culture expansion for clinical treatment. Scand J Clin Lab Invest. 2017;77(7):541–548.