
 ?Mathematical formulae have been encoded as MathML and are displayed in this HTML version using MathJax in order to improve their display. Uncheck the box to turn MathJax off. This feature requires Javascript. Click on a formula to zoom.
Abstract
The recently discovered selective glomerular hypofiltration syndromes have increased interest in the actual elimination of molecules in the human kidney. In the present study, a novel human model was introduced to directly measure the single-pass renal elimination of molecules of increasing size. Plasma concentrations of urea, creatinine, C-peptide, insulin, pro-BNP, β2-microglobulin, cystatin C, troponin-T, orosomucoid, albumin, and IgG were analysed in arterial and renal venous blood from 45 patients undergoing Transcatheter Aortic Valve Implantation (TAVI). The renal elimination ratio (RER) was calculated as the arteriovenous concentration difference divided by the arterial concentration. Estimated glomerular filtration rate (eGFR) was calculated by the CKD-EPI equations for both creatinine and cystatin C. Creatinine (0.11 kDa) showed the highest RER (21.0 ± 6.3%). With increasing molecular size, the RER gradually decreased, where the RER of cystatin C (13 kDa) was 14.4 ± 5.3% and troponin-T (36 kDa) was 11.3 ± 4.6%. The renal elimination threshold was found between 36 and 44 kDa as the RER of orosomucoid (44 kDa) was −0.2 ± 4.7%. The RER of creatinine and cystatin C showed a significant and moderate positive linear relationship with eGFR (r = 0.48 and 0.40). In conclusion, a novel human model was employed to demonstrate a decline in renal elimination with increasing molecular size. Moreover, RERs of creatinine and cystatin C were found to correlate with eGFR, suggesting the potential of this model to study selective glomerular hypofiltration syndromes.
Introduction
It is generally assumed that human plasma proteins smaller than approximately 30 kDa are principally excreted by glomerular filtration, but the evidence for this is almost entirely based on animal experiments [Citation1, Citation2]. Due to this assumption, glomerular filtration rate (GFR, ‘renal function’) in clinical practice is commonly estimated using both cystatin C-based and creatinine-based GFR-estimating equations [Citation2, Citation3]. The concomitant use of cystatin C (13 kDa) and creatinine (0.11 kDa) for estimating GFR, generating eGFRcystatin C and eGFRcreatinine values, facilitated the discovery of selective glomerular hypofiltration syndromes [Citation2, Citation4], including Shrunken Pore Syndrome (SPS) [Citation5, Citation6] and Elongated Pore Syndrome (EPS) [Citation7]. Such syndromes, characterised by an eGFRcystatin C/eGFRcreatinine-ratio significantly below 1 [Citation2, Citation4–7] are associated with a strong increase in mortality [Citation5, Citation6, Citation8, Citation9] and indicate a hypofiltration of molecules in the size range of 5–30 kDa compared with the filtration of smaller molecules (< 1 kDa) [Citation2, Citation4–7].
The renal elimination ratio (RER) is a measure of the relative concentration decrease of a substance from arterial to renal venous blood. Physiologically, RER constitutes the net single-pass elimination of the substance through the kidney, regardless of the specific mechanism involved, be it glomerular filtration or tubular handling.
Hypothetically, a decreased glomerular filtration of a substance would result in a lower RER of that substance, but, due to the low number of measurements of RER in humans, it has not been possible to demonstrate either a relation between RER and molecular size or an association between RER and GFR [Citation10–12]. The purpose of this study was to develop a novel human model that facilitates a more extensive and in-depth examination of renal clearance of diverse-sized molecules, encompassing proteins, within a patient population characterised by heterogeneous renal function. If it holds true that RER is size-selective and that there is a relationship between RER and GFR, such a model would permit a more careful characterisation of selective glomerular hypofiltration syndromes.
Methods
This was a prospective study performed by gathering data and blood samples from patients undergoing an elective Transcatheter Aortic Valve Implantation (TAVI) procedure for aortic stenosis at Skåne University Hospital in Lund, Sweden, between December 2021 and June 2022. The cohort consisted of high- to intermediate-risk patients who were elderly and often burdened by comorbidities such as hypertension, peripheral vascular disease, diabetes, and chronic obstructive pulmonary disease () [Citation13–16].
Table 1. Demographics and baseline renal function for the study cohort.
Intervention
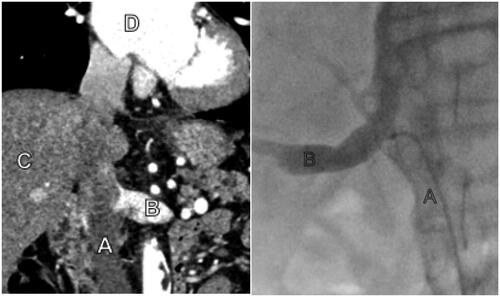
The preprocedural computed tomography (CT) for the TAVI procedure was used to determine the inflow of the renal veins in the inferior vena cava (). A control blood sample for measurement of serum creatinine, cystatin C, and determination of eGFR was collected from a peripheral venous cannula before the procedure. Routine vascular access for the TAVI procedure was acquired by ultrasound-guided micro-puncture technique on both the femoral vein and artery. Standard TAVI access was maintained with a 6 Fr introducer in one femoral vein and artery, as well as a large bore access for the TAVI device on the contralateral femoral artery. At this point, the patient received an injection with 5000–15000 IU of intravenous heparin to achieve an activated clotting time (ACT) above 250 s. Through the venous introducer, a 100 cm long 5 Fr SIM 1 catheter (Cordis Corporation, Hialeah, FL, USA) was advanced cervically into the inferior vena cava with the help of a guidewire under fluoroscopic guidance, passing the proposed exit of the renal veins using the lumbar vertebrae and liver as anatomical reference. After that, the catheter was retracted caudally until its tip was lodged in the renal vein (). When necessary and if the patient’s renal function was not compromised, correct tip placement was verified by administering 3–4 mL of intravenous contrast (Visipaque, GE Healthcare AS, Oslo, Norway). With the catheter tip in the renal vein, a blood sample of 20 mL was aspirated slowly, taking care not to exceed the estimated flow rate of approximately 10 mL/s in the renal vein. Simultaneously, a 20 mL sample was drawn from the introducer in the femoral artery. After the sampling was completed, the patient underwent the procedure as planned.
Figure 1. The left picture shows a pre-procedural CT with A – Inferior vena cava, B – Left renal vein, C – Liver, D – Right atrium. The right picture shows fluoroscopy during the procedure with A – Inferior vena cava with sampling catheter, B – Right renal vein with contrast injection to verify the correct sampling location.
The blood samples were transferred to designated test tubes, either Li-heparin or serum tubes, centrifugated for 10 min at 2200 G, and analysed in the clinical chemistry laboratory at the hospital for the plasma concentration of the following substances in the order of molecular mass (kDa): Urea, creatinine, C-peptide, insulin, pro-BNP, β2-microglobulin, cystatin C, troponin-T, orosomucoid, albumin, and IgG. C-peptide and insulin were added to the panel mid-study, while measuring troponin-T was discontinued at the laboratory at the end of this study.
Plasma concentrations of the substances above were measured using automated on either the Atellica® (Siemens Healthineers, Erlangen, Germany) or the Cobas Pro® (Roche Diagnostics GmbH, Mannheim, Germany) according to the manufacturer’s instructions. Urea and creatinine were measured using enzymatic colorimetric assays, C-peptide and insulin with immunometric sandwich procedures using electrochemiluminescence detection technology, pro-BNP by a sandwich immunoassay using chemiluminescence, β2- microglobulin with immunonephelometry, troponin-T with an immunometric sandwich procedure using chemiluminometry detection technology, orosomucoid by an antiserum binding assay and nephelometric detection, albumin using a bromocresol binding assay and fluorometric detection, and IgG with an immunoassay and nephelometric detection. The plasma concentration of cystatin C was determined by an automated particle-based immunoassay, adjusted to the international reference preparation ERM-DA 471/IFCC.
Estimated GFR was calculated with the 2021 version of the CKD-EPI (Chronic Kidney Disease Epidemiology Collaboration) equation using both creatinine and cystatin C [Citation3].
The renal extraction ratio (RER) is defined as the difference between arterial and venous plasma concentration in relation to the arterial plasma concentration.
Data capture and outlier analysis
We used the REDCap software (Research Electronic Data Capture) hosted at Lund University, Lund, Sweden for data capture. Outliers were identified by undertaking a manual verification of the data file, excluding data points that met either of the following criteria: First, if arterial or venous test results fell below the detection limit of the test, and/or if test results suggested an abnormal production of a substance in the kidney, indicating that samples had been incorrectly labelled or analysed. All participants gave informed consent, both oral and written, before inclusion in this study. The study was conducted according to the guidelines of the Helsinki Declaration and was approved by the Swedish Ethical Review Authority (approval number 2021-03618 with amendment 2022-04433-02).
Statistical analysis
A comparison of groups was performed with the student’s t-test if normally distributed. Otherwise, a Wilcoxon signed-rank test was performed. No adjustments were made for multiple comparisons. Correlation between outcome variables was tested with univariable regression, and correlation was presented as r-values. Statistical analyses were made with Statistica® ver. 14 (TIBCO Software, Palo Alto, CA).
Results
Fifty-three patients were initially recruited for this study. Patient characteristics and laboratory test results were representative of an intermediate- and high-risk TAVI population with a mean age of 82 years (range 80–95) and with an eGFR mean of 59.6 mL/min/1.73 m2 (range 18–95) (). For eight patients, we were either unable to selectively catheterize the renal vein or had missing data points due to a handling failure at the laboratory (), leaving a total of 45 patients (21 from left and 24 from right kidney) for final analysis. No complications due to renal vein sampling occurred.
Table 2. Measurement results for analytes.
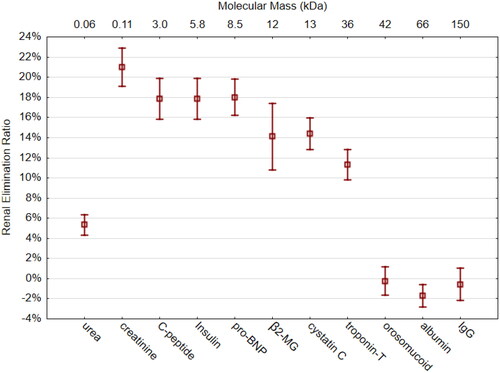
Compared to the RER of creatinine (21.0 ± 6.3%), all the other molecules had a significantly lower RER (, ). In the size range of 3–8.5 kDa, an RER plateau of approximately 18% was seen. β2-microglobulin (12 kDa) and cystatin C (13 kDa) showed an RER of around 14%. The RER of troponin-T (36 kDa) was 11%. There was no renal elimination in the size range of 44–150 kDa (orosomucoid, albumin, and IgG). Albumin showed a small, but significant, concentration increase of 1.7%. The RER of the smallest molecule, urea (0.06 kDa), was 5.3 ± 0.8%.
Figure 2. Renal Elimination Ratio (RER) of 11 measured molecules ordered in size from smallest (left) to largest (right). The X-axis on top gives molecular mass in kDa. β2-MG = β2-microglobulin. Whiskers indicate 95% CI of the mean.
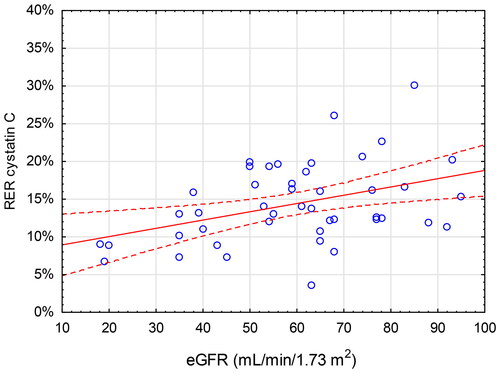
Lower eGFR was associated with a lower RER of creatinine and cystatin C. The linear relationships between RER of creatinine and cystatin C and eGFR were moderate (r = 0.48, p < 0.001 and r = 0.40, p = 0.006, respectively) ( and ). This yields an r2-values of 0.23 for creatinine and 0.16 for cystatin C, meaning that eGFR accounts for only 23% and 16% of the variation of RERcreatinine and RERcystatin C, respectively. For all the other analytes, no significant relationship between RER and eGFR was found except for pro-BNP (r = 0.33, p = 0.026).
Figure 3. Renal Elimination Ratio (RER, Y-axis) for creatinine vs estimated glomerular filtration rate (eGFR, X-axis) calculated using the CKD-EPI (Chronic Kidney Disease Epidemiology Collaboration) equation. The red line indicates the correlation (r = 0.48, p < 0.001) with 95% CI.
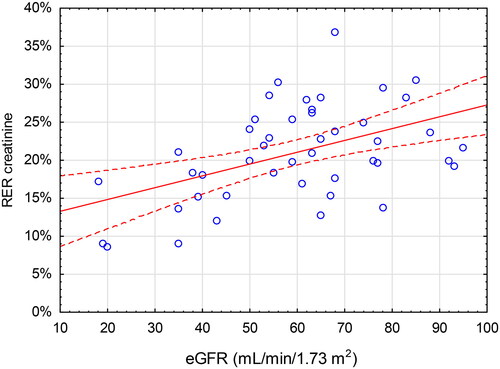
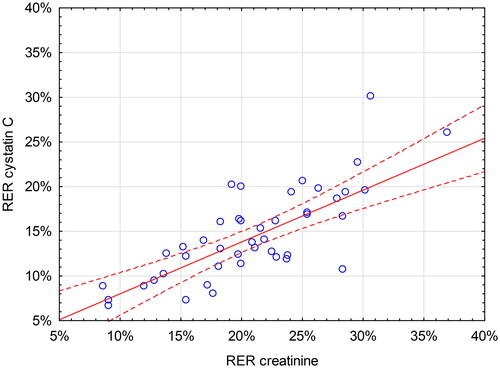
Figure 4. Renal Elimination Ratio (RER, Y-axis) for cystatin C vs estimated glomerular filtration rate (eGFR, X-axis) calculated using the CKD-EPI (Chronic Kidney Disease Epidemiology Collaboration) equation. The red line indicates the correlation (r = 0.40, p = 0.006) with 95% CI.
There was an association between the RER-values of creatinine and cystatin C in the patient cohort, as indicated by a moderate positive linear relationship (r = 0.69, p < 0.001) ().
Figure 5. Renal Elimination Ratio (RER, Y-axis) of cystatin C vs Renal elimination ratio (RER, X-axis) of creatinine. The red line indicates the correlation (r = 0.69, p < 0.001) with 95% CI.
Discussion
The main finding of the present study was that the single-pass renal elimination of proteins showed a clear tendency to decrease as the size of the proteins increased until a threshold was reached between 36 and 44 kDa, where the elimination ceased ().
It is essential to acknowledge that RER is a measure of net renal elimination and by no means exclusive to glomerular filtration. However, for a substance that is freely filtered—and neither absorbed nor secreted in the tubular cells—the RER should be similar to the filtration fraction, which is known to be 20% [Citation10]. Therefore, the RER of creatinine (21%) in the present study validates the findings. This result also is corroborated by others [Citation11, Citation12]. As for cystatin C, which has no tubular interaction with plasma and has a simulated glomerular sieving coefficient of 84% [Citation7], an RER-value of 14.4% seems realistic.
In terms of molecular size, an elimination threshold was found between 36 and 44 KDa in the present study. To our knowledge, this has not been reported previously in a human model. This finding agrees with the speculated molecular size cut-off for glomerular filtration of 30–50 kDa [Citation17–19]. However, it needs to be remembered that glomerular sieving is not only determined by molecular size but also by other factors such as molecular charge and configuration [Citation20, Citation21]. The RER-value for a substance presented in this study, may therefore not be directly translatable to other substances of similar size.
Another interesting finding was that only RER-values of creatinine (r = 0.48), cystatin C (r = 0.40), and pro-BNP (r = 0.33) showed a significant correlation with eGFR. The absence of a positive relationship between eGFR and RER of large proteins that are not eliminated by the kidneys is not surprising. The absence is more unexpected regarding, for example, β2-microglobulin, since it can function as a marker for GFR [Citation5]. One explanation could be the relatively wide distribution of RER of β2-microglobulin (14.1 ± 10.9%). This variability might partly originate from our sampling procedure, which involved drawing venous blood from only one kidney. Collection of venous blood from both kidneys would allow for the determination of a mean renal venous concentration, potentially leading to a narrower distribution of RER values and a stronger correlation with eGFR. For analytes that undergo glomerular filtration but also exhibit tubular reabsorption or secretion, the association between RER and GFR is anticipated to be less clear. The most obvious example here is urea, which is well-known to undergo extensive tubular reabsorption [Citation22]. Also, in the setting of low GFR, creatinine exhibits an increased tubular secretion [Citation23]. The comparison of RER and eGFR can be challenging due to fundamental differences in their underlying data and measurement approaches. RER represents raw plasma concentration values, while eGFR is a transformed value that incorporates various factors beyond plasma concentration, including age and sex. Additionally, eGFR is derived from measured GFR, which is estimated over a specified period. In contrast, RER, by its nature, provides a momentary assessment of renal function. Taken together, a stronger correlation between RER and eGFR probably is not to be expected and not necessary for the purpose of this study. RER was not introduced as a measure of GFR. A direct proof of selective hypofiltration would ideally be to demonstrate a decreased concentration of 5–30 kDa proteins in the ultrafiltrate of Bowman´s capsule. This is, however, not possible in a human model. Instead, RER-data is suggested as a surrogate measure to corroborate size-selective renal hypofiltration as the etiology to eGFR-ratios significantly below a threshold defining a hypofiltration syndrome.
There was a moderate positive correlation between RER for creatinine and cystatin C (r = 0.69). A stronger correlation between two well-validated markers for GFR was expected. Part of the observed poor correlation is inevitably attributed to the imprecision of the analytical methods employed. According to our laboratory, the coefficients of variance for cystatin C, at plasma levels of around 1 and 3 mg/L were 2.7% and 1.0%, respectively. Corresponding numbers for creatinine at 60 and 370 µmol/L were 2.0% and 0.3%, respectively. Another more intriguing explanation could be found in the recently proposed hypofiltration syndromes, such as SPS. As the pathophysiological explanation for SPS is thought to be a decreased renal ability to filtrate larger molecules with a relatively maintained ability to filtrate smaller molecules [Citation5], this could hypothetically be measured as a widened gap between RER of creatinine and cystatin C among patients suffering from SPS and, therefore, a weakened pooled linear relation. The size of the present study, however, does not allow for analyses of subgroup differences based on eGFR discrepancies.
The study has some inherent weaknesses and strengths. It is performed on a select patient population: Elderly people with aortic stenosis and many with concomitant diseases. Results may, therefore, not be generalisable to other populations. At the same time, the population had a wide range of renal function, where eGFR ranged between 18–95 mL/min/1.73 m2, which provided an opportunity to investigate the effect of renal function on single-pass elimination. Utilizing routine clinical chemistry, 11 different molecules were analysed. More molecules would probably yield a higher resolution of elimination as a function of molecular size but would require a more specialized laboratory technology. We did not measure GFR, renal blood flow, diuresis, or urinary concentrations. These parameters could have provided a better understanding of the relationship between single-pass renal elimination and GFR.
Utilizing a human model, this study is novel in its design to demonstrate that renal elimination of molecules decreases with increasing molecular size, eventually ceasing between 36 and 44 kDa. A positive linear relationship between the RER of creatinine and cystatin C and eGFR also is shown. The sampling of renal venous blood was safe and straightforward, and results could be generated utilizing routine clinical chemistry. The apparent variation of eGFR in the study cohort ought to permit future subgrouping based on renal function. The model’s potential as a tool for in-depth investigations of renal elimination in patients with and without selective glomerular hypofiltration is evident.
Disclosure statement
The authors report there are no competing interests to declare.
Data availability statement
Data will be made available by corresponding author upon reasonable request.
Additional information
Funding
References
- Maack T, Johnson V, Kau ST, et al. Renal filtration, transport, and metabolism of low-molecular-weight proteins: a review. Kidney Int. 1979;16(3):251–270. doi:10.1038/ki.1979.128.
- Malmgren L, Öberg C, den Bakker E, et al. The complexity of kidney disease and diagnosing it - cystatin C, selective glomerular hypofiltration syndromes and proteome regulation. J Intern Med. 2023;293(3):293–308. doi:10.1111/joim.13589.
- Inker LA, Eneanya ND, Coresh J, et al. New creatinine- and cystatin C-based equations to estimate GFR without race. N Engl J Med. 2021;385(19):1737–1749. doi:10.1056/NEJMoa2102953.
- Quiroga B, Ortiz A, Díez J. Selective glomerular hypofiltration syndrome. Nephrol Dial Transplant. 2023;39(1):10–17. doi:10.1093/ndt/gfad145.
- Grubb A. Shrunken pore syndrome - a common kidney disorder with high mortality. Diagnosis, prevalence, pathophysiology and treatment options. Clin Biochem. 2020;83:12–20. doi:10.1016/j.clinbiochem.2020.06.002.
- Grubb A, Lindström V, Jonsson M, et al. Reduction in glomerular pore size is not restricted to pregnant women. Evidence for a new syndrome: ‘Shrunken pore syndrome. Scand J Clin Lab Invest. 2015;75(4):333–340. doi:10.3109/00365513.2015.1025427.
- Öberg CM, Lindström M, Grubb A, et al. Potential relationship between eGFR(cystatin C)/eGFR(creatinine) -ratio and glomerular basement membrane thickness in diabetic kidney disease. Physiol Rep. 2021;9(13):e14939. doi:10.14814/phy2.14939.
- Dardashti A, Nozohoor S, Grubb A, et al. Shrunken pore syndrome is associated with a sharp rise in mortality in patients undergoing elective coronary artery bypass grafting. Scand J Clin Lab Invest. 2016;76(1):74–81. doi:10.3109/00365513.2015.1099724.
- Herou E, Grubb A, Dardashti A, et al. Reduced renal elimination of larger molecules is a strong predictor for mortality. Sci Rep. 2022;12(1):17517. doi:10.1038/s41598-022-22433-4.
- ten Dam MA, ten Kate RW, Werter CJ, et al. Measurement of the glomerular sieving coefficient of endogenous proteins in man. Contrib Nephrol. 1990;83:47–52.
- ten Kate RW, Pals G, Res JC, et al. The glomerular sieving of pepsinogen A and C in man. Eur J Clin Invest. 1989;19(3):306–310. doi:10.1111/j.1365-2362.1989.tb00234.x.
- van Ballegooijen AJ, Rhee EP, Elmariah S, et al. Renal clearance of mineral metabolism biomarkers. J Am Soc Nephrol. 2016;27(2):392–397. doi:10.1681/ASN.2014121253.
- Leon MB, Smith CR, Mack M, et al. Transcatheter aortic-valve implantation for aortic stenosis in patients who cannot undergo surgery. N Engl J Med. 2010;363(17):1597–1607. doi:10.1056/NEJMoa1008232.
- Leon MB, Smith CR, Mack MJ, et al. Transcatheter or surgical aortic-Valve replacement in intermediate-risk patients. N Engl J Med. 2016;374(17):1609–1620. doi:10.1056/NEJMoa1514616.
- Popma JJ, Adams DH, Reardon MJ, et al. Transcatheter aortic valve replacement using a self-expanding bioprosthesis in patients with severe aortic stenosis at extreme risk for surgery. J Am Coll Cardiol. 2014;63(19):1972–1981. doi:10.1016/j.jacc.2014.02.556.
- Reardon MJ, Van Mieghem NM, Popma JJ, et al. Surgical or transcatheter aortic-Valve replacement in intermediate-risk patients. N Engl J Med. 2017;376(14):1321–1331. doi:10.1056/NEJMoa1700456.
- Ruggiero A, Villa CH, Bander E, et al. Paradoxical glomerular filtration of carbon nanotubes. Proc Natl Acad Sci U S A. 2010;107(27):12369–12374. doi:10.1073/pnas.0913667107.
- Roksnoer LC, Heijnen BF, Nakano D, et al. On the origin of urinary renin: a translational approach. Hypertension. 2016;67(5):927–933. doi:10.1161/HYPERTENSIONAHA.115.07012.
- Anderson NL, Anderson NG. The human plasma proteome: history, character, and diagnostic prospects. Mol Cell Proteomics. 2002;1(11):845–867. doi:10.1074/mcp.r200007-mcp200.
- Haraldsson B, Nyström J, Deen WM. Properties of the glomerular barrier and mechanisms of proteinuria. Physiol Rev. 2008;88(2):451–487. doi:10.1152/physrev.00055.2006.
- Öberg CM, Rippe B. Quantification of the electrostatic properties of the glomerular filtration barrier modeled as a charged fiber matrix separating anionic from neutral ficoll. Am J Physiol Renal Physiol. 2013;304(6):F781–787. doi:10.1152/ajprenal.00621.2012.
- Kawamura S, Kokko JP. Urea secretion by the straight segment of the proximal tubule. J Clin Invest. 1976;58(3):604–612. doi:10.1172/JCI108507.
- Zhang X, Rule AD, McCulloch CE, et al. Tubular secretion of creatinine and kidney function: an observational study. BMC Nephrol. 2020;21(1):108. doi:10.1186/s12882-020-01736-6.