
Abstract
Background: Non-invasive markers for predicting relapse would be a useful tool for the management of patients with inflammatory bowel disease. Eosinophil granulocytes and their granule proteins eosinophil cationic protein (ECP) and eosinophil-derived neurotoxin (EDN) have previously been shown to reflect disease activity in Crohn’s disease and ulcerative colitis.
Aim: To examine the capacity of faecal ECP and EDN to predict relapse in ulcerative colitis and Crohn's disease, and to compare these proteins with faecal calprotectin.
Methods: Patients with Crohn's disease (n = 49) and ulcerative colitis (n = 55) were followed prospectively until relapse or end of the two-year study period. Faecal samples were obtained every third month. The predictive value of ECP and EDN was assessed in Cox regression models.
Results: In ulcerative colitis, a doubled EDN or ECP concentration was associated with a 31% and 27% increased risk of relapse, respectively. EDN levels were increased both at relapse and three months prior. By contrast, in Crohn's disease, the concentration of EDN was higher among patients in remission than in those who relapsed. Correlations between faecal calprotectin, ECP and EDN were observed in both diseases.
Conclusions: We demonstrate that the risk of relapse in ulcerative colitis can be predicted by consecutively measuring faecal EDN every third month, and suggest EDN as a complementary faecal marker to calprotectin to predict future relapse in ulcerative colitis. Our finding of higher EDN in Crohn’s disease-patients staying in remission than in those who relapsed indicates different functions of the protein in ulcerative colitis and Crohn’s disease.
Introduction
Ulcerative colitis and Crohn's disease represent the two predominant disease entities of inflammatory bowel disease (IBD). The disease course differs largely between patients, where some have a single period with symptoms and others struggle with chronically active disease [Citation1,Citation2]. Unfortunately, there are limited possibilities to predict the disease course for an individual patient. Clinical factors such as young age at diagnosis, high number of prior relapses or short duration since last relapse have been identified as risk factors for future relapse in IBD [Citation3]. However, these factors provide poor guidance in a single patient since most of them are rather general. This has led to the search for biomarkers that can be used to assess the risk of future relapse in a single patient. C-reactive protein (CRP) and erythrocyte sedimentation (ESR) have both been associated with risk of relapse [Citation4–6], but their clinical applicability is limited by their low sensitivity or specificity [Citation4,Citation7]. In contrast, faecal calprotectin seems to have a high accuracy, and its association with the risk of relapse has been suggested in numerous studies [Citation8]. However, most studies are based on one single measurement, and do not take into account that IBD is a chronic disease and that the disease activity changes over time, sometimes rapidly. A recent study from our group showed that serial assessment of faecal calprotectin can be used as a monitoring tool to estimate the risk of future relapse continuously [Citation9]. Unfortunately, increased faecal calprotectin is not IBD-specific since it reflects neutrophil granulocyte activation, and occurs in several other diseases such as colorectal cancer, coeliac disease and infectious enteritis [Citation10,Citation11]. We therefore turn our attention towards other possible markers that may be a complement to calprotectin and help narrow down the disease spectrum. Eosinophils are often seen in the histological picture of IBD, and we have promising data from previous studies, indicating that eosinophil proteins may be useful as additional markers for inflammation in IBD [Citation12–14]. Upon activation, eosinophils release cytotoxic proteins, including eosinophil peroxidase (EPO), eosinophil cationic protein (ECP) and eosinophil-derived neurotoxin (EDN) [Citation15–18]. EDN is also known as eosinophil protein X (EPX), but will be referred to as EDN in this manuscript. These proteins are ideal for routine analyses as they are stable in faeces for at least 3 days at room temperature, tolerate freezing well and the intersampling coefficient variations (CVs) are low in healthy individuals [Citation12–14].
Eosinophils are multifunctional leukocytes that contribute to both the innate and the adaptive immune response, as well as to tissue repair. Thus, eosinophil granulocytes may potentially be involved in several stages of IBD, including both inflammatory and fibrotic processes [Citation19]. This could imply that the role of eosinophils may differ between ulcerative colitis and Crohn's disease, since fibrosis is a more common phenomenon in Crohn's disease.
We aimed to explore the capacity of faecal EDN and ECP to predict future relapse of ulcerative colitis and Crohn's disease by analysing these markers every third month in a cohort of IBD patients in clinical remission. Furthermore, we wanted to evaluate if these markers act the same way in ulcerative colitis and Crohn's disease, and to evaluate if they could add any additional value to faecal calprotectin.
Materials and methods
Patients and study design
Adult patients with a previously diagnosed ulcerative colitis or Crohn's disease in clinical remission were consecutively offered to participate in the study performed at the outpatient Gastroenterology Clinic at Örebro University Hospital between February 2009 and September 2012. Previous substantial surgical resections or any other systemic disease were considered as exclusion criteria. Information on disease phenotype according to the Montreal classification was extracted from medical notes. In total, 49 patients with Crohn's disease and 55 with ulcerative colitis participated in the study.
The study population has been described elsewhere [Citation9]. In short, participants were asked to fill in a questionnaire and provide a faecal sample at baseline and then every third month until a relapse or until the end of the 24 months study period. The questionnaire included thirteen items on medical therapy and patient-reported outcomes (PROs), including number of stools/day, abdominal pain and blood in stool. Relapse was defined as increasing symptoms, as blood and mucus in stool, diarrhoea, fever and malaise, necessitating intensified medical therapy or surgery.
The Ethics Committee of Uppsala University approved the study (approval number: 2007/291). All patients signed a written informed consent.
Faecal inflammation markers
Faecal samples were collected in plastic containers, sent the same day by mail to the laboratory at Örebro University Hospital, and stored at −70 °C. After collection of samples was completed, samples were sent to Uppsala University Hospital, Department of Medical Sciences, where the analyses were done. All samples were analysed for EDN and ECP. Previously published data on faecal calprotectin levels, obtained from the same stool samples, were used for correlation analysis [Citation9]. In total 596 faecal samples were analysed.
Faecal extracts were prepared as described previously [Citation16] and analysed for EDN and ECP in a blinded fashion. Faecal EDN was measured by enzyme-linked immunosorbent assay, (Diagnostics Development AB, Uppsala, Sweden) and ECP was measured using UniCAP (Phadia AB, Uppsala, Sweden). The concentration of markers in faeces was adjusted for water content as previously described [Citation16] and expressed as µg/g semidry faeces. Faecal calprotectin was measured according to the manufacturer's protocol (EK-CAL, Bühlmann Lab. AG, Switzerland) as described previously [Citation9]. Concentrations of faecal calprotectin were expressed as micrograms of calprotectin per gram of faeces, with the limit of detection (LOD) 10 µg/g.
Statistical analysis
Continuous variables with skewed distribution are presented as median [25th percentile (P25) – 75th percentile (P75)]. The Mann–Whitney U test was used to compare differences between groups. Difference of frequencies between groups was tested using χ2 test. To assess the correlation between concentrations of different faecal markers we used the Spearman rank correlation test.
To assess the predictive capacity of baseline faecal EDN and ECP levels, we applied the Cox proportional hazards regression model with an interaction term between faecal EDN/ECP levels and time to relapse to allow for potential time-variant effects. To comply with the requirement of normal distribution for continuous independent variables, log2-transformed EDN and ECP concentrations were used. Missing EDN and ECP levels were imputed using the ‘last observation carried forward’ technique. The hazard ratio (HR) and corresponding 95% confidence interval (CI) were calculated using Cox regression model. Proportional hazards assumption was tested using the Schoenfeld residuals method [Citation20]. The first model (Model 1 A) included baseline faecal concentrations of EDN and ECP, respectively, age, and sex. The interaction term between faecal markers and time was excluded because no time-varying effects were found. A sensitivity analysis (Model 1B) was performed by including treatment options as covariates (oral sulfasalazine, oral 5-aminosalicylic acid, topical 5-aminosalicylic acid, immunomodulators and anti-TNF therapy) that might confound the effect of the faecal EDN and ECP levels in an extended Cox regression model. Note that oral and topical corticosteroids were not included as steroids are used for treating relapse and therefore define the outcome. The second model (Model 2 A) was based on all EDN/ECP measurements during the entire study period and included time-variant faecal EDN/ECP levels, age, and sex. The interaction term between EDN/ECP and time was excluded as well because no time-varying effects were found. Correspondingly, we performed a sensitivity analysis (Model 2B) and adjusted for medical treatments, by including baseline treatment options as covariates in an extended Cox regression model. The detailed results of the models are provided in Supplementary Material.
All tests were two-tailed and a p < .05 was considered statistically significant. Statistical analyses were performed using statistical packages SPSS (version 22, IBM Corporation, Armonk, NY) and STATA (version 14.2 SE, StataCorp. 2016. College Station, TX).
Results
Patient cohort
In total, 55 patients with ulcerative colitis and 49 with Crohn's disease were included in the study. Of these, 61 patients provided a complete set of faecal samples, whereas one or more samples were missing from 43 patients. Basic demographics, clinical characteristics at baseline and medical treatments are presented in .
Table 1. Demographics and clinical characteristics of all patients with ulcerative colitis and Crohn’s disease, stratified by relapse during the study period.
During the 2-year follow-up, 37 patients relapsed and 67 remained in clinical remission. Patients with ulcerative colitis who remained in remission had significantly longer disease duration than those who relapsed (p = .02). There were no other differences between patients who remained in remission and those who experienced a relapse in terms of baseline demographic or clinical characteristics ().
Predictive value of baseline measurements
No statistically significant interaction between EDN or ECP concentration at baseline and time, respectively, was found. The proportional hazards assumption for baseline EDN or ECP levels and covariates was not violated.
Ulcerative colitis
In patients with ulcerative colitis the risk of relapse increased by 20% (HR 1.20; 95% CI 1.01–1.42; p = .035), per unit increase in log2-transformed baseline faecal EDN, when sex and age were included as covariates (Supplementary material, Table 1). In other words, a twice as high baseline EDN concentration was associated with a 20% higher risk of relapse during the two years study-period. In contrast, no association between faecal ECP levels at baseline and risk of relapse was observed (HR 1.13; 95% CI 0.90–1.44; p = .298) (Supplementary material, Table 2). To explore if the EDN and ECP levels were confounded by IBD therapy, we added treatment options (oral and topical 5-ASA, sulfasalazine, immunomodulators and anti-TNF) as covariates to an extended Cox regression model. The association between baseline EDN and increased risk of relapse remained when the model was adjusted for treatment options (HR 1.27; 95% CI 1.04–1.54; p = .018) (Supplementary material, Table 1).
Crohn’s disease
In patients with Crohn´s disease, no association between baseline EDN or ECP concentrations and risk of relapse during the two-year follow-up was observed, neither when sex and age were introduced as co-variates nor when treatment options were added to the extended model (Supplementary material, Tables 3 and 4).
Predictive value of consecutive measurements over time
Ulcerative colitis
Serial estimations of faecal EDN and ECP every third month pointed to stable levels in ulcerative colitis patients who remained in remission during the two years study period (). In patients with ulcerative colitis who experienced a clinical relapse, the faecal level of EDN was significantly elevated both at the time of relapse (time 0) and at three months prior to relapse (time -3 months) compared with those who remained in sustained clinical remission (, ).
Figure 1. Serial faecal EDN- and ECP measurements (µg/g) in patients with ulcerative colitis: time 0 refers to the time of relapse or end of study period. Data is shown as bars corresponding to interquartile range (IQR), separate for patients who experienced a relapse (black) and patients who remained in sustained remission (grey). Median values are marked with a black horizontal line. *p < .05 for comparison.
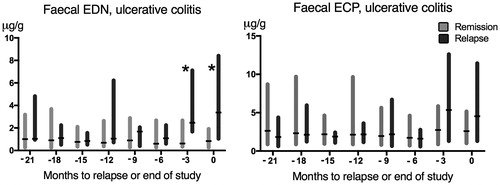
Table 2. Median (IQR) concentrations for ulcerative colitis patients in relapse vs. remission. Results are presented for time 0 (relapse/end of study) and -3 (three months prior). The difference between concentrations in relapse vs. remission groups was only significant for EDN.
In contrast, no significant difference in ECP was observed between patients who relapsed and those who remained in remission neither at the time of relapse nor at three months prior to relapse.
To further explore the utility of repeated measurements of EDN and ECP in the prediction of relapse, the EDN and ECP levels recorded at each three months period were included as time-variant variables in the second Cox regression model (Model 2 A and 2B). In patients with ulcerative colitis, a 31% increased risk of relapse was observed per a doubling of the faecal EDN concentration (HR 1.31; 95% CI: 1.09–1.58; p = .004; , model 2 A). The increased risk of relapse remained, and a similar HR was observed when treatment options were added as covariates to the extended Cox regression model (, model 2B).
Table 3. Information from extended Cox regression on predictors of clinical relapse in patients with ulcerative colitis analysed by Model A, including time-variant faecal EDN, age, and sex; and Model B, including time-variant faecal EDN, age, sex, and treatment factors as a sensitivity analysis.
Consistently, a 27% increased risk of relapse was observed per doubling of the faecal ECP concentration (HR 1.27; 95% CI: 1.00–1.61; p = .046). The risk estimate remained when adjusting for treatment options (HR 1.27; 95% CI: 1.0–1.62; p = .054) (Supplementary material, Table 6).
Crohn’s disease
Serial estimations of faecal EDN and ECP every third month pointed to fairly stable levels in Crohn's disease patients who remained in sustained clinical remission during the two-year study period ().
Figure 2. Serial faecal EDN-measurements and ECP-measurements (µg/g) in patients with Crohn’s disease: time 0 refers to the time of relapse or end of study period. Data is shown as bars corresponding to interquartile range (IQR), separate for patients who experienced a relapse (black) and patients who remained in sustained remission (grey). Median values are marked with a black horizontal line.
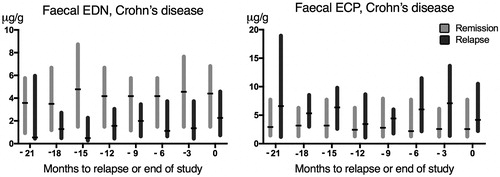
In patients who experienced a clinical relapse, the median concentration of EDN trended lower at three months prior relapse/end of study compared with patients in the remission group, but the difference was not statistically significant (p = .08, ). However, when including the entire sample set and comparing the median EDN levels in patients with Crohn’s disease, disregarding point of time, the median EDN level in the group of patients who remained in sustained remission was higher (median value 3.54) compared with those who experienced a relapse (median value 1.67) (p < .001). It was also higher compared with UC patients in remission (median 0.84) (p < .001). When dividing Crohn’s disease-patients in groups depending on disease locations, the difference in median EDN values between remission- and relapse-groups was most obvious in patients with ileal (L1) (p = .008) and ileo-colonic (L3) (p = .02) disease, while there was no significant difference between the remission- and relapse-group in patients with colonic disease (L2) (p = .55).
Table 4. Median (IQR) concentrations of EDN and ECP in Crohn's disease: relapse versus remission. Results are presented at time 0 (relapse/end of study) and -3 (three months prior).
Table 5. Spearman’s rank correlation coefficients (rs) for ECP, EDN and faecal calprotectin (FC). Results for all patients in the disease groups, and stratified by relapse during the study period. All results were significant (p < .001) except those marked with ‘†’.
Regarding ECP, the difference in concentration between remission- and relapse-groups was not statistically significant neither at time 0 nor at three months prior relapse or end of study ().
To explore the effect of time-variant EDN and ECP concentrations on the risk of relapse in patients with Crohn's disease, we included EDN/ECP levels measured every third month in the Cox regression model. No increased risk of relapse was observed per a doubling of the faecal EDN concentration when age and sex were included as covariates (HR 0.95; 95% CI: 0.75–1.20; p = .671) or when treatment options were added to the model (HR 0.94; 95% CI: 0.73–1.21; p = .627) (Supplementary material, Table 7). Similarly, no significant increased risk of relapse was observed per doubling of the faecal ECP concentration, neither when age and sex were used as co-variates (HR 1.15; 95% CI: 0.86–1.55; p = .346) nor when treatment options were added to the extended model (HR 1.16; 95% CI: 0.86–1.57; p = .340) (Supplementary material, Table 8).
Correlation between concentrations of faecal ECP, EDN and calprotectin
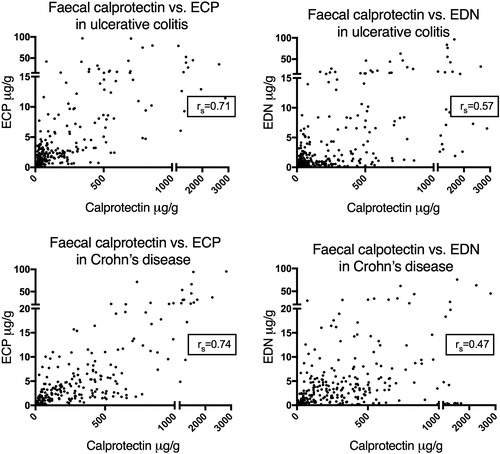
To assess any correlations between faecal ECP/EDN and calprotectin, calprotectin-measurements obtained from our previous study were used [Citation9]Citation10. Statistically significant positive correlations were observed between all three proteins, both in patients with ulcerative colitis and with Crohn’s disease (). To assess whether these results were influenced by disease activity, the correlation analyses were stratified by clinical disease activity, i.e., remission or relapse during the study period. In ulcerative colitis, a correlation was observed between all biomarkers both during remission and at relapse. In Crohn's disease on the other hand, a correlation between EDN and the other markers was only seen in the remission-group and not in the relapse group ().
Figure 3. Correlation between faecal calprotectin and ECP/EDN in patents with ulcerative colitis (top) and Crohn's disease (bottom). p < .05 for all rs (Spearman’s rank correlation coefficient). Note, broken axis in graphs.
Discussion
In the present study, we demonstrate that the risk of relapse in ulcerative colitis can be predicted by consecutive measurement of faecal EDN every third month. We observed significantly elevated EDN-levels three months before a clinical relapse, as well as at relapse, in ulcerative colitis patients compared with patients who remained in clinical remission. A doubling of EDN or ECP levels was associated with a 31% and 27% increased risk of relapse, respectively. In Crohn's disease, however, EDN concentrations were higher among patients who remained in remission compared with those who relapsed, and did not change before or during a relapse.
In the clinical setting, faecal calprotectin is a well-established marker for intestinal inflammation and has been shown to correlate with mucosal inflammation. We have previously shown that consecutive measurements of faecal calprotectin can predict the risk of a relapse in both ulcerative colitis and Crohn's disease [Citation9]. However, the marker is associated with intra- and inter-individual differences in the concentrations [Citation21]. Our new findings may indicate that the combination of faecal calprotectin and faecal EDN or ECP may better reflect disease status in some patients with ulcerative colitis, although significant correlations between the proteins were observed in patients with ulcerative colitis and Crohn´s disease in remission. The observed correlations are in line with our previous data on these markers [Citation22] as well as in a study from Saitoh et al. [Citation23].
The difference in EDN-levels between ulcerative colitis and Crohn's disease during remission is an important finding of this study. The local cytokine milieu is important for many functional responses of the eosinophils, including degranulation [Citation24,Citation25]. Thus, the variation in EDN-expression between patients with ulcerative colitis and patients with Crohn’s disease may depend on the specific cytokine profile of each disease subgroup. We have previously demonstrated that eosinophils are activated differently in ulcerative colitis and Crohn's disease, which most likely is a result of different cytokine milieus [Citation24].
The difference in EDN-measurements may also reflect different variants of the protein in ulcerative colitis and Crohn's disease due to polymorphisms in the ECP-gene, or a difference in the glycosylation of the proteins upon release from the eosinophils. ECP is present in many variants due to polymorphisms in the ECP-gene, resulting in different biological activities in patients with allergies compared with healthy controls. A certain polymorphism in the ECP-gene has been shown to be associated with the expression of allergic symptoms [Citation26,Citation27]. Post-translational modifications, particularly glycosylation, seem to partly determine the cytotoxic activity of ECP [Citation28,Citation29], but further research is needed to find out if this accounts for EDN as well.
The presence of eosinophils in both inflamed and non-inflamed intestinal tissue from patients with Crohn’s disease has been shown previously [Citation30], but the clinical significance of increased EDN during remission is unclear. It could reflect the role eosinophils may have in the propagation of the inflammation. If so, the level of eosinophil activation could be a predictor of extension disease. Elevated intraluminal levels of EDN have been detected in the sigmoid colon of patients with isolated proctitis, indicating eosinophil activity in the ‘non-inflamed’ proximal colon [Citation31]. On the other hand, it may be the remodulating role of eosinophils that is accountable. Eosinophils and their granule proteins are able to promote fibroblast migration and function, and chronic eosinophil inflammation is associated with fibrosis in several diseases [Citation32].
A limitation of this study is that no endoscopies were performed to verify clinical relapse or remission. However, to perform endoscopies every third month was unfortunately not practically possible. Another weakness of the study is that 41% of the patients did not provide a faecal sample at one or more occasion. This response-rate would probably be higher if the patients got feedback on their levels of biomarkers, but this was not feasible since all measurements were done after the study-period. A higher adherence would be expected in a clinical setting. The generalisability of the study may also be limited by the high age of the study population.
In future research, a more homogeneous population of patients, ideally untreated, would be interesting to study regarding ECP and EDN. A panel of biomarkers, such as f-calprotectin, ECP and EDN, as well as markers from other cell types, could potentially improve the specificity in predicting severity and diagnosing the inflammatory bowel diseases.
In conclusion, the present study has identified EDN as a complementary faecal marker to calprotectin to predict future relapse in ulcerative colitis. In contrast to our findings in ulcerative colitis, higher EDN levels were observed in Crohn’s disease patients who stayed in remission compared to those who relapsed, indicating different functions of the protein in ulcerative colitis and Crohn’s disease.
| Abbreviations | ||
| ECP | = | Eosinophil cationic protein |
| EDN | = | Eosinophil-derived neurotoxin |
| IBD | = | Inflammatory bowel disease |
| FC | = | Faecal calprotectin |
Supplemental Material
Download PDF (175.3 KB)Acknowledgements
We appreciate the skillful technical assistance of Ingrid Stolt at Uppsala University Hospital.
Disclosure statement
Marie Carlson has served as a consultant and an advisory board member for Janssen, Pfizer and Takeda. Jonas Halfvarson has served as a speaker, a consultant and an advisory board member for Abbvie, Celgene, Ferring, Hospira, Janssen, Medivir, MSD, Pfizer, Prometheus, RenapharmaVifor, Sandoz, Takeda, Tillotts Pharma, received research funding from Janssen, MSD, Takeda and owns stocks and shares in AstraZeneca. Karin Amcoff, Yang Cao, Yaroslava Zhulina and Maria Lampinen declare no commercial or financial conflict of interest.
Additional information
Funding
References
- Solberg IC, Lygren I, Jahnsen J, et al. Clinical course during the first 10 years of ulcerative colitis: results from a population-based inception cohort (IBSEN Study). Scand J Gastroenterol. 2009;44(4):431–440.
- Solberg IC, Vatn MH, Hoie O, et al. Clinical course in Crohn's disease: results of a Norwegian population-based ten-year follow-up study. Clin Gastroenterol Hepatol. 2007;5(12):1430–1438.
- Liverani E, Scaioli E, Digby RJ, et al. How to predict clinical relapse in inflammatory bowel disease patients. WJG. 2016;22(3):1017–1033.
- Consigny Y, Modigliani R, Colombel JF, et al. A simple biological score for predicting low risk of short-term relapse in Crohn's disease. Inflamm Bowel Dis. 2006;12(7):551–557.
- Bitton A, Dobkin PL, Edwardes MD, et al. Predicting relapse in Crohn's disease: a biopsychosocial model. Gut. 2008;57(10):1386–1392.
- Boirivant M, Leoni M, Tariciotti D, et al. The clinical significance of serum C reactive protein levels in Crohn's disease. Results of a prospective longitudinal study. J Clin Gastroenterol. 1988;10(4):401–405.
- Peterson CG, Sangfelt P, Wagner M, et al. Fecal levels of leukocyte markers reflect disease activity in patients with ulcerative colitis. Scand J Clin Lab Invest. 2007;67(8):810–820.
- Lewis JD. The utility of biomarkers in the diagnosis and therapy of inflammatory bowel disease. Gastroenterology. 2011;140(6):1817–1826 e2.
- Zhulina Y, Cao Y, Amcoff K, et al. The prognostic significance of faecal calprotectin in patients with inactive inflammatory bowel disease. Aliment Pharmacol Ther. 2016;44(5):495–504.
- Ertekin V, Selimoğlu MA, Turgut A, et al. Fecal calprotectin concentration in celiac disease. J Clin Gastroenterol. 2010;44(8):544–546.
- Alibrahim B, Aljasser MI, Salh B. Fecal calprotectin use in inflammatory bowel disease and beyond: a mini-review. Can J Gastroenterol Hepatol. 2015;29(3):157–163.
- Peterson CG, Eklund E, Taha Y, et al. A new method for the quantification of neutrophil and eosinophil cationic proteins in feces: establishment of normal levels and clinical application in patients with inflammatory bowel disease. Am J Gastroenterology. 2002;97(7):1755–1762.
- Peterson CG, Lampinen M, Hansson T, et al. Evaluation of biomarkers for ulcerative colitis comparing two sampling methods: fecal markers reflect colorectal inflammation both macroscopically and on a cellular level. Scand J Clin Lab Invest. 2016;76(5):393–401.
- Wagner M, Peterson CG, Stolt I, et al. Fecal eosinophil cationic protein as a marker of active disease and treatment outcome in collagenous colitis: a pilot study. Scandinavian J Gastroenterol. 2011;46(7-8):849–854.
- Venge P, Bystrom J, Carlson M, et al. Eosinophil cationic protein (ECP): molecular and biological properties and the use of ECP as a marker of eosinophil activation in disease. Clin Exp Allergy. 1999;29(9):1172–1186.
- Hogan SP, Rosenberg HF, Moqbel R, et al. Eosinophils: biological properties and role in health and disease. Clin Exp Allergy. 2008;38(5):709–750.
- Moqbel R, Lacy P. Exocytotic events in eosinophils and mast cells. Clin Exp Allergy. 1999;29(8):1017–1022.
- Carlson MG, Peterson CG, Venge P. Human eosinophil peroxidase: purification and characterization. J Immunol. 1985;134(3):1875–1879.
- Travers J, Rothenberg ME. Eosinophils in mucosal immune responses. Mucosal Immunol. 2015;8(3):464–475.
- Schoenfeld D. Partial residuals for the proportional hazards regression model. Biometrika. 1982;69(1):239–241.
- Lasson A, Stotzer PO, Ohman L, et al. The intra-individual variability of faecal calprotectin: a prospective study in patients with active ulcerative colitis. J Crohns Colitis. 2015;9(1):26–32.
- Wagner M, Peterson CG, Ridefelt P, et al. Fecal markers of inflammation used as surrogate markers for treatment outcome in relapsing inflammatory bowel disease. WJG. 2008;14(36):5584–5589. discussion 8.
- Saitoh O, Kojima K, Sugi K, et al. Fecal eosinophil granule-derived proteins reflect disease activity in inflammatory bowel disease. Am J Gastroenterol. 1999;94(12):3513–3520.
- Lampinen M, Backman M, Winqvist O, et al. Different regulation of eosinophil activity in Crohn's disease compared with ulcerative colitis. J Leukocyte Biol. 2008;84(6):1392–1399.
- Kampe M, Lampinen M, Stolt I, et al. PI3-kinase regulates eosinophil and neutrophil degranulation in patients with allergic rhinitis and allergic asthma irrespective of allergen challenge model. Inflammation. 2012;35:230–239.
- Jonsson UB, Bystrom J, Stalenheim G, et al. Polymorphism of the eosinophil cationic protein-gene is related to the expression of allergic symptoms. Clin Exp Allergy. 2002;32(7):1092–1095.
- Blom K, Rubin J, Halfvarson J, et al. Eosinophil associated genes in the inflammatory bowel disease 4 region: correlation to inflammatory bowel disease revealed. WJG. 2012;18:17–18.
- Trulson A, Bystrom J, Engstrom A, et al. The functional heterogeneity of eosinophil cationic protein is determined by a gene polymorphism and post-translational modifications. Clin Exp Allergy. 2007;37(2):208–218.
- Rubin J, Venge P. Asparagine-linked glycans determine the cytotoxic capacity of eosinophil cationic protein (ECP). Mol Immunol. 2013;55(3-4):372–380.
- Carvalho AT, Elia CC, de Souza HS, et al. Immunohistochemical study of intestinal eosinophils in inflammatory bowel disease. J Clin Gastroenterol. 2003;36(2):120–125.
- Carlson M, Raab Y, Peterson C, et al. Increased intraluminal release of eosinophil granule proteins EPO, ECP, EPX, and cytokines in ulcerative colitis and proctitis in segmental perfusion. Am J Gastroenterol. 1999;94(7):1876–1883.
- Zagai U, Skold CM, Trulson A, et al. The effect of eosinophils on collagen gel contraction and implications for tissue remodelling. Clin Exp Immunol. 2004;135(3):427–433.