
Abstract
The objective of these studies was to determine the pharmacokinetics of levonorgestrel and etonogestrel in Sprague-Dawley rat or Göttingen minipig following various administration routes.
Four sequential crossover studies were conducted: Study 1 administered levonorgestrel 30 µg intravenously and intradermally in four minipigs; Study 2 administered levonorgestrel 30 µg intravenously in 12 rats; Study 3 administered levonorgestrel 60 µg intravenously and subcutaneously in 12 rats; and Study 4 administered etonogestrel 30 µg intravenously in 12 rats. Samples were quantified using liquid chromatography-tandem mass spectrometry and pharmacokinetic parameters were estimated via noncompartmental analysis.
Cmax and AUCinf for etonogestrel and levonorgestrel were similar following 30 µg intravenous bolus in rats, suggesting comparable pharmacokinetics. Levonorgestrel exposure was dose-proportional in rats, based on two-fold higher AUCinf following levonorgestrel 60 versus 30 µg. The bioavailability of intradermal and subcutaneous levonorgestrel was 97.7% (Study 1) and 90.3% (Study 3), respectively. The minipig levonorgestrel clearance was 21.5 L/hr, which was about 20-fold higher than both the rat levonorgestrel (range: 0.985–1.45 L/hr) and etonogestrel clearance (range: 0.803–0.968 L/hr).
These studies contribute to the gap in knowledge of nonclinical levonorgestrel and etonogestrel pharmacokinetics, which is necessary for the ongoing development of long-acting reversible contraceptives.
Introduction
Long-acting reversible contraceptives (LARC) are among the most effective methods of birth control, which consist of intrauterine devices, long-acting injectables like depot medroxyprogesterone acetate, and rod implants of levonorgestrel (LNG) and etonogestrel (ENG) (Mansour et al. Citation2010). Developing innovative alternatives and increasing accessibility to these contraceptives remains a global health priority, especially in addressing the issue of unintended pregnancies in low- and middle-income countries (Sully et al. Citation2020). The main challenge of LARC development, however, is predicting human pharmacokinetics (PK) based on the observed nonclinical PK. More specifically, predicting the clinical release rate based on nonclinical data is an essential step in determining whether to move forward with a LARC formulation. The release rate can be calculated using either basic PK principles or mathematical deconvolution of the drug absorption profile (Margolskee et al. Citation2016), but in either case the intravenous (IV) PK is necessary. A review of publicly available literature suggests that there is limited and outdated information on nonclinical PK of synthetic progestins, especially IV PK. Our studies aim to determine the IV PK of LNG and ENG in Sprague-Dawley rat or Göttingen minipig and estimate the bioavailability of LNG administered subcutaneously (SC) and intradermally. The results from our studies narrow the gap in the literature on nonclinical LNG and ENG PK and provide valuable IV PK necessary to estimate LNG and ENG release rate from LARC formulations in development.
Materials and methods
Four nonclinical sequential crossover studies were conducted to assess PK following LNG or ENG in rats and LNG in minipig administered via various routes.
Study 1: LNG in minipig
Study design and treatments
Study 1 was a prospective, three-treatment crossover study in which minipigs received a different treatment for each predefined phase, with a 14- or 15-day washout period between phases. LNG 30 µg was administered as an IV bolus injection with a one-minute push in Phase 1; as a 24-hr IV infusion in Phase 2; and as two intradermal injections (at 0.15 mL per site) in Phase 3. Four female Göttingen minipigs were enrolled for this study, five months of age at baseline with a mean body weight (± standard deviation (SD)) of 11.5 ± 0.4 kg for Phase 1 (IV bolus), 13.0 ± 0.5 kg for Phase 2 (24-hr IV infusion), and 14.2 ± 0.5 kg for Phase 3 (Intradermal). Animals were allowed to acclimate for 32 days prior to initial dose administration.
Monitoring, dose administration, and sampling
The animals were weighed within five days of arrival and then weekly throughout acclimation. Animals were also weighed on each day of dose administration and then weekly throughout the remainder of the study. Cageside observations for general health and appearance were performed once daily and at 1, 2, and 24 hours (hr) post-dose for each phase. The IV bolus and infusion doses were administered via a jugular vein catheter (JVC) and the intradermal dose was administered via injection in the inner thigh region. Approximately 2 mL of blood was collected via a JVC and the sampling schedule differed for each treatment – Phase 1 (IV bolus): 0 (predose), 0.1, 0.25, 0.5, 1, 2, 4, 8, 10, 12, 24, 36, and 48 hr post-dose; Phase 2 (IV infusion): 0 (predose), 1, 2, 4, 8, 12, 24 (end of infusion), 25, 26, 28, 30, 32, 36, 40, 48, 60, and 72 hr post-dose; and Phase 3 (Intradermal): 0 (predose), 0.25, 0.5, 1, 2, 4, 6, 8, 10, 12, 24, 36, 48, 60, and 72 hr post-dose.
Studies 2 and 3: LNG in rat
Study design and treatments
Studies 2 and 3 were prospective, two-treatment crossover studies in which the rat received two treatments sequentially, with at least a 14-day washout period. For Study 2, LNG 30 µg was administered as a 24-hr IV infusion in Phase 1 and as an IV bolus injection with a one-minute push in Phase 2. For Study 3, LNG 60 µg was administered as a 1-hr IV infusion in Phase 1 and as an SC injection in Phase 2. Female Sprague-Dawley rats were enrolled for these studies (N = 12 for each study). For Study 2, rats were 14 weeks of age at baseline with a mean body weight (± SD) of 286 ± 10 g for Phase 1 (24-hr IV infusion) and 305 ± 12 g for Phase 2 (IV bolus). For Study 3, rats were 18 weeks of age at baseline with a mean body weight (± SD) of 247 ± 23 g for Phase 1 (1-hr IV infusion) and 251 ± 17 g for Phase 2 (SC injection). Animals were allowed to acclimate for 12 days in Study 2 and three days in Study 3 prior to initial dose administration.
Monitoring, dose administration, and sampling
The animals were weighed at the time of animal selection and on each day of dose administration. Cageside observations for general health and appearance were performed once daily. For Study 2, the IV bolus and infusion doses were administered via a femoral vein-cannula (FVC). For Study 3, the 1-hr IV infusion dose was administered via a tail vein and the SC injection was administered into the upper left dorsal region. Approximately 0.5 mL of blood was collected via the jugular vein. The sampling schedule was staggered so that samples were taken from a subset of four animals at four or five-time points. For Study 2, samples were collected at 0 (predose), 1, 2, 4, 8, 12, 24 (end of infusion), 25, 26, 28, 30, 33, 36, 40, and 48 hr post-dose for 24-hr IV infusion and at 0 (predose), 0.1, 0.25, 0.5, 1, 2, 4, 8, 10, 12, 24, 36, and 48 hr post-dose for IV bolus. For Study 3, sampling schedule was also staggered and collected at 0 (predose), 0.1, 0.25, 0.5, 1 (end of infusion), 2, 4, 8, 10, 12, 16, and 24 hr post-dose for 1-hr IV infusion and at 0 (predose), 0.25, 0.5, 1, 2, 4, 6, 8, 10, 12, 16, 24, and 36 hr post-dose for SC injection.
Study 4: ENG in rat
Study design and treatments
Study 4 was a prospective, two-treatment crossover study in which rats received two treatments sequentially, with a 14-day washout period. ENG 30 µg was administered as a 24-hr IV infusion in Phase 1 and as an IV bolus injection with a one-minute push in Phase 2. 12 Female Sprague-Dawley rats were enrolled for this study, 14 weeks of age at baseline with mean body weight (± SD) of 270 ± 11 g for Phase 1 (24-hr IV infusion) and 290 ± 12 g for Phase 2 (IV bolus). Animals were allowed to acclimate for five days prior to initial dose administration.
Monitoring, dose administration, and sampling
The animals were weighed at the time of animal selection and on each day of dose administration. Cageside observations for general health and appearance were performed once daily. Detailed observations were performed on all available animals 0 (predose) and at 1, 4, and 24 hr post dose following IV bolus and at 4, 26, and 48 hr following the start of the 24-hr IV infusion. The IV bolus and infusion doses were administered via an FVC. Approximately 0.5 mL of blood was collected via the jugular cannula or jugular venipuncture. The sampling schedule was staggered so that samples were taken from a subset of four animals at four or five time points. Samples were collected at 0 (predose), 1, 2, 4, 8, 12, 24 (end of infusion), 25, 26, 28, 30, 33, 36, 40, and 48 hr post-dose for 24-hr IV infusion and at 0 (predose), 0.1, 0.25, 0.5, 1, 2, 4, 8, 10, 12, 24, 36, and 48 hr post-dose for IV bolus.
Animal environment
Animals in all studies were selected for use based on overall health, body weight, and cannula patency. Animals were individually housed, except in Study 3, in which they were group housed (up to three animals per cage). Animals were provided the appropriate certified diet (PMI, Inc. for minipig and Envigo RMS, Inc. for rat) and fresh water daily. The temperature was maintained at 20–26 °C and there was a 12-hr light/12-hr dark cycle. These studies were not considered to be within the scope of the Good Laboratory Practice Regulations. Animals were maintained in compliance with the Animal Welfare Act Regulations (9 CFR 3).
Dose preparation
All doses were prepared by diluting stock solutions of LNG or ENG with 10% hydroxypropyl ß-cyclodextrin (HP-ß-CD) in normal saline and then stirring until the solution was clear and colourless. Contact and solution stability experiments (Velesco Pharmaceutical Services, Wixom, MI) showed that there was minimal or no loss of potency of LNG or ENG in the vehicle (syringes, syringe infusion kits, and IV bag infusion kits) for ≥ 24 hr. All tested concentrations of LNG remained stable at 20 ± 2 °C for five days and ENG remained stable at 2–8 °C for one month.
Sample analysis
In all studies, blood samples were immediately transferred to chilled cryoracks prior to centrifugation to obtain plasma. Centrifugation began within one hour of collection. Plasma was then maintained on dry ice prior to storage at approximately −70 °C until analysed.
Separate stock solutions of LNG or ENG, prepared in methanol at 1.0 mg/mL in glass bottles and maintained at 2–8 °C, were used for the calibration standards (CS) and for the validation samples (VS)/quality control (QC) samples. General spiking solutions were prepared by diluting the LNG or ENG stock solutions with methanol. CS and VS/QC samples were prepared by mixing 5 parts of respective spiking solutions with 95 parts of the control matrix (K2EDTA minipig or rat plasma obtained from commercial suppliers). The sample volume of 100 (for Studies 2–4) or 200 µL (for Study 1) was aliquoted into a 1.2 mL 96-well plate and mixed with 25 µL internal standard (10,000 pg/mL of LNG-D6 in water:methanol 50:50) and 75 (for Studies 2–4) or 175 µL (for Study 1) of water. The mixtures were vigorously shaken, vortexed, and centrifuged. The sample mixtures were then transferred to Biotage Isolute SLE+ 200 (for Studies 2–4) or 400 mg (for Study 1) plate and loaded to the sorbent using positive pressure. After about five minutes (min), samples were eluted into a 0.8 mL or 1.2 mL 96-well plate using 700 or 750 µL of ethyl acetate:hexane 25:75 and evaporated to dryness under nitrogen at 35 °C. This elution and evaporation process was performed a second time in Study 1 only. The dried mixture was reconstituted with 50 µL of water:acetonitrile:formic acid 50:50:0.1 (Studies 3 and 4) or 75 µL of water:acetonitrile:formic acid 60:40:0.1 (Studies 1 and 2).
Samples were analysed on a Waters Acquity liquid chromatograph interfaced with a Thermo Scientific TSQ Vantage triple quadrupole mass spectrometer or on a Dionex Ultimate 3000 liquid chromatograph interfaced with a Thermo Scientific TSQ Quantiva triple quadrupole mass spectrometer, both with electrospray ionisation (AIT Bioscience LLC, Indianapolis, IN). Study 1 utilised both systems, Study 2 utilised the Waters Acquity system, and Studies 3 and 4 utilised the Dionex Ultimate system. Each extracted sample was injected onto a Waters BEH C18 column (2.1 × 50 mm; 1.7 µm) equilibrated at 30 °C, using a flow rate of 0.3 mL/min. 50 µL injection volume was used for the Waters Acquity system and 25 µL for the Dionex Ultimate system.
A gradient was used, with varying ratios of Mobile Phase A (MP A), ammonium fluoride (25 mM), and Mobile Phase B (MP B). MP B was a mix of acetronitrile:hexafluoroisopropanol 100:0.5 for Studies 1 and 2 and methanol:hexafluoroisopropanol 100:0.5 for Studies 3 and 4. The following gradient was used for Studies 1 and 2: From 0 to <1 min, a ratio of MP A:MP B 60:40 was used; 1 to <2.6 min, MP A:MP B 40:60; 2.6 min to <3.7 min, MP A:MP B 10:90; and 3.7–4 min, MP A:MP B 60:40. A slightly different gradient was used for Studies 3 and 4: From 0 to <3 min, a ratio of MP A:MP B 50:50 was used; 3 to <3.1 min, MP A:MP B 5:95; and 3.1–3.5 min, MP A:MP B 50:50. The observed retention time for LNG was 1.87 min for Studies 1 and 2 and 2.45 min for Study 3. The observed retention time for ENG was 2.52 min for Study 4. For Study 1, standard curves were linear over a concentration range of 10–10,000 pg/mL with an R2 ≥0.99. For Studies 2–4, standard curves were linear over a concentration range of 25–25,000 pg/mL with an R2 ≥0.98. The lower limit of quantitation (LLOQ) was < 10 or 20 pg/mL for Study 1 and < 25.0 pg/mL for Studies 2–4.
For Study 1, accuracy (% bias) and precision (% coefficient of variation (CV%)) were determined using VS at concentrations of 10 (LLOQ), 30, 3,000, and 7,500 pg/mL (N = 6, each concentration). The accuracy ranged from 86.7 to 99% and precision ranged from 1.5 to 15.2%. For Study 2, VS at concentrations of 25 (LLOQ), 75, 7,500, and 18,800 pg/mL (N = 6, each concentration) were used. The accuracy ranged from 98.3 to 101.6% and precision ranged from 2.2 to 8.7%. For Study 3, VS at concentrations of 75, 7,500, 18,800, and 50,000 pg/mL (N = 6, each concentration) were used. The accuracy ranged from 100.9% to 107.9% and precision ranged from 4.8 to 6.3%. For Study 4, VS at concentrations of 25 (LLOQ), 75, 7,500, and 18,800 pg/mL (N = 6, each concentration) were used. The accuracy ranged from 94.8 to 114.4% and precision ranged from 2.4 to 4%, excluding the VS at 7500 pg/mL which had a CV% of 34.3%.
Pharmacokinetic analysis
The concentration-time data for each minipig were plotted and visually inspected. Pharmacokinetic parameters for each of the treatments were estimated using noncompartmental analysis (NCA) via Phoenix WinNonlinTM Version 8.1 (Certara USA, Princeton, NJ). The following parameters were measured or estimated, as appropriate for the treatment: peak concentration following dose (Cmax), area-under-the-curve until the last measurable time point (AUClast), area-under-the-curve extrapolated to infinity (AUCinf), half-life (t1/2), clearance or apparent clearance (CL or CL/F), and bioavailability (F). AUC calculations were estimated using the linear trapezoidal method except for Study 4, in which the linear/log trapezoidal method was used. Any concentrations below the LLOQ were treated as zero for descriptive statistics and pharmacokinetic analysis. Statistical analyses were limited to descriptive statistics such as mean and standard deviation, if applicable.
Results
illustrate the concentration-time profiles from the studies: illustrates the LNG concentration-time in minipig for Study 1; the LNG concentration-time in rats for Studies 2 and 3; and the ENG concentration-time in rats for Study 4. There were several LLOQ values towards the last few timepoints for Study 1 and 4, which were treated as zero values, resulting in lower mean concentrations (, ). The overall PK parameter results are summarised in . 24-hr IV infusions of LNG or ENG had lower Cmax values than the other routes of administration but maintained a steady concentration for the entire duration of the infusion. The IV bolus dose of LNG and ENG had the highest Cmax values, followed by slightly higher overall AUCinf compared to those following 24-hr IV infusions. The 1-hr IV infusion of LNG had similar PK parameter values to the SC administration of LNG in Study 3, as well as a similar concentration-time curve (). Comparing the PK following 30 µg IV bolus of LNG and ENG in the rat (Studies 2 and 4), the Cmax and AUCinf for ENG were 6.67% and 25.5% higher, respectively, compared to those for LNG (Cmax: 91.1 vs. 85.4 ng/mL; AUCinf: 37.4 vs. 29.8 ng·hr/mL for ENG and LNG, respectively). Comparing the PK following 30 and 60 µg of LNG in the rat (Studies 2 and 3), the AUCinf following 60 µg 1-hr IV infusion or SC injection was about two-fold higher than that following 30 µg IV bolus (60.9 (1-hr IV infusion) or 55.0 (SC injection) vs. 29.8 ng·hr/mL (IV bolus)). F of LNG was 97.7% following intradermal administration in minipig and 90.3% following SC injection in the rat. The LNG CL in minipig was 21.5 L/hr (1.87 L/hr/kg). The systemic CL of LNG and ENG in the rat following IV bolus and infusion were similar: LNG CL was 0.985–1.45 L/hr (3.31–5.07 L/hr/kg), and ENG CL was 0.803–0.968 L/hr (2.77–3.57 L/hr/kg).
Figure 1. Levonorgestrel (LNG) concentration in Göttingen minipig following 30 µg via various routes of administration: intravenous (IV) bolus, IV infusion, and intradermal injection (semi-logarithmic scale). Points (i.e. shapes) represent individual observations and the lines (i.e. line types) represent the mean concentration. Any concentrations below the limit of quantitation were treated as zero values, thus affecting the overall mean concentration.
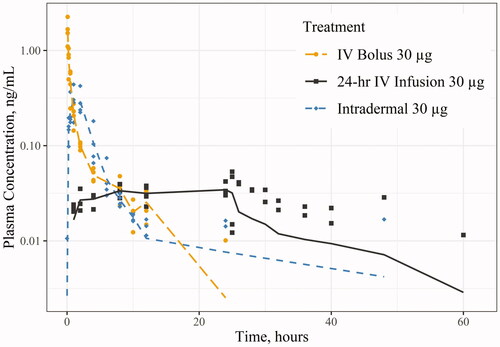
Figure 2. Levonorgestrel (LNG) concentration in Sprague-Dawley rat following 30 and 60 µg via various routes of administration: intravenous (IV) infusion, IV bolus, and subcutaneous (SC) (semi-logarithmic scale). Points (i.e. shapes) represent individual observations and the lines (i.e. line types) represent the mean concentration. Any concentrations below the limit of quantitation were treated as zero values, thus affecting the overall mean concentration.
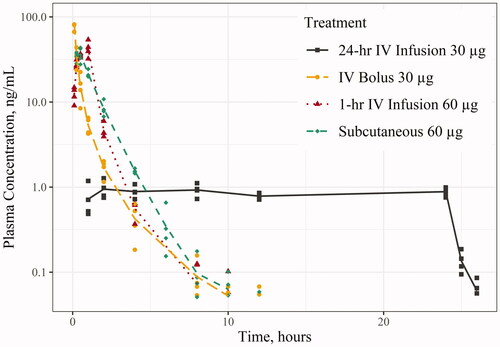
Figure 3. Etonogestrel (ENG) concentration in Sprague-Dawley rat following 30 µg via intravenous (IV) bolus and IV infusion (semi-logarithmic scale). Points (i.e. shapes) represent individual observations and the lines (i.e. line types) represent the mean concentration. Any concentrations below the limit of quantitation were treated as zero values, thus affecting the overall mean concentration.
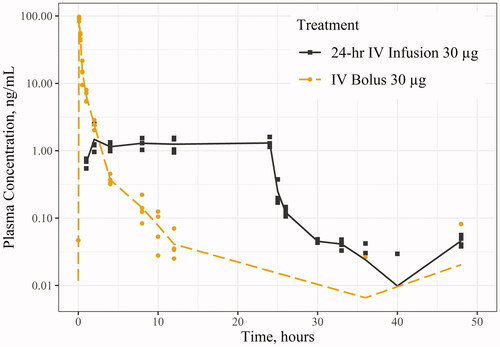
Table 1. Mean pharmacokinetic parameters following various routes of administration of LNG or ENG in rat and minipig.
Discussion
LNG and ENG were patented in 1960 (Fischer and Ganellin Citation2006, p. 479) and 1972 (Fischer and Ganellin Citation2006, p. 480), respectively, and studied widely in humans over the span of 50–60 years. However, there is a clear gap in the literature for LNG and ENG PK in various animal species. There are a few studies that measured nonclinical PK for assay validation purposes or for experimental formulations (e.g. intravaginal ring), but dedicated IV PK studies of LNG and ENG in animals are sparse or outdated. The results from five studies that investigated LNG and ENG PK following IV route of administration are summarised in (Düsterberg et al. Citation1981; Nair et al. Citation1981; Düsterberg and Beier Citation1984; Naqvi et al. Citation1984a; Geelen et al. Citation1993).
Table 2. LNG and ENG PK following IV bolus in animal species from the previous studiesa.
There are many caveats to the cited studies in that prevent us from comparing our study results to those from the literature. First, not all the PK parameters typically derived from IV PK studies are reported and the concentration-time profiles are generally not available. Second, the age, strain, and body weight of animals are all known to affect drug PK. From birth to adulthood, Sprague-Dawley rats and Camborough-29 pigs experience the increased expression of the two hepatic enzymes responsible for LNG metabolism, uridine diphosphate glucuronosyltransferase (UGT) and sulfotransferase (SULT) enzymes (Hu Citation2017; Xu et al. Citation2019). Age- and species-specific changes in hepatic enzyme production may consequently result in changes to overall CL. In addition, different strains of mice have shown different plasma concentrations of antibiotics like itraconazole, despite the same weight, dose, and route of administration (MacCallum and Odds Citation2002). Third, the assay methodology used results in different plasma drug concentration measurements. The radioimmunoassay (RIA) method is non-specific and detects both the drug and its metabolites, which overestimates plasma concentrations at lower concentrations and underestimates at higher concentrations (Xu et al. Citation2014). In addition to the methodology itself, different assay sensitivities can lead to differences in the characterisation of concentration-time curves, consequently affecting overall PK parameters. While RIA sensitivities are not mentioned in the Düsterberg study (Düsterberg et al. Citation1981), Naqvi et al. (Citation1984a) and Nair et al. (Citation1981) cite an RIA sensitivity of 10 pg per tube, or about 50 pg/mL, whereas liquid chromatography-tandem mass spectrometry (LC-MS/MS) from our studies detected LNG and ENG concentrations as low as 10 pg/mL for the minipig and 25 pg/mL for the rat. Higher LLOQ values will require more extrapolation past the last measurable time point and thus greater potential inaccuracies in estimating PK parameters. Finally, protein binding differences between animal species can affect the LNG and ENG PK. LNG and ENG are > 90% protein-bound in humans to albumin and sex hormone binding globulin (SHBG), with LNG demonstrating a higher affinity to SHBG compared to ENG (FDA Citation1996; FDA Citation2001). This difference in binding is evident by the change in total LNG CL observed with decreasing SHBG levels (Kuhnz et al. Citation1992). The literature suggests the presence of SHBG in rabbits, dogs, and monkeys, but not in rats and pigs (Renoir et al. Citation1980; Jenkins and Fotherby Citation1981). While there is currently no published literature to demonstrate the effects of SHBG on LNG and ENG PK, SHBG adds another layer of complexity to an interspecies and interstudy comparison between our studies and the cited studies in . Thus, the availability of nonclinical IV PK information does not necessarily translate to usability of said information unless the necessary assumptions are made to account for the limitations of the studies from literature.
The other two formulations tested in our studies are SC and intradermal injections. Six other studies that studied PK of LNG and ENG SC, intramuscular (IM), and intradermal (ID) in animal species are summarised in (Düsterberg Citation1984; Düsterberg and Beier Citation1984; Naqvi et al. Citation1984b; Ananthula et al. Citation2015; He et al. Citation2018; Citation2020).
Table 3. LNG and ENG PK following SC/IM/ID injection in animal species from the previous studiesa.
The extravascular studies in have their own set of caveats that prevent a meaningful comparison between our results and those from the literature. The cited studies from the literature use a range of formulations, from sesame oil to long-acting solutions like poly(lactic-co-glycolic acid) (PLGA). In our studies, the main vehicle for LNG and ENG administration is 10% HP-ß-CD in normal saline, which was tested to be stable and compatible with the syringe kits (i.e. no loss of LNG or ENG potency). Differences in formulations can drastically affect the release rate of the drug, consequently affecting t1/2 and overall exposure (e.g. Cmax and AUC). For example, Naqvi et al. (Citation1984b) report a longer t1/2 and higher exposures (after dose-normalization) following LNG 32 µg in sesame oil compared to LNG 60 µg in 10% HP-ß-CD from our studies. Ananthula et al. (Citation2015) report a t1/2 of 22.1 hr following LNG 1 mg in N-methyl-2-pyrrolidine (NMP) solution. Although not reported, He et al. (Citation2018, Citation2020) utilise microparticles and PLGA solutions for ENG delivery, which will likely prolong the t1/2 even more. In terms of exposure, Düsterberg (Citation1984) reports a Cmax value of 6,300 ng/mL following administration of LNG 1 mg in a mix of benzyl benzoate and castor oil to Wistar rat, which is still 10-fold higher than the Cmax following LNG 60 µg in Sprague-Dawley rat (from Study 3) even after dose-normalization (6.30 ng/mL vs. 0.608 ng/mL). Another limitation with the cited studies is that the aforementioned publications neither report the F of their extravascular formulations nor the accompanying impulse data (i.e. IV bolus) in order to calculate relative F. In our studies, the same formulation is used for both the IV and extravascular routes, allowing us to calculate relative F from the SC and intradermal injection. Similar to the IV PK studies from the literature, there are multiple reasons that complicate a direct comparison between our study results to those from the extravascular PK studies in the literature, further highlighting the gap and need for nonclinical LNG and ENG PK. There are other nonclinical PK studies available but are excluded from this discussion due to differences in routes of administration (e.g. oral, nasal, and implant) and insufficient PK and study design information to be reported, among other reasons (Gabelnick and Hall Citation1987; Kuhnz and Beier Citation1994; Kuhnz et al. Citation1995; Shahiwala and Misra Citation2004; Ma et al. Citation2006; Ding et al. Citation2007).
From our studies, the important findings are the comparability of LNG and ENG PK in rats, dose-proportionality of LNG exposure in rats, higher LNG CL observed in minipig than in rats, and F > 90% following LNG intradermal and SC injections. LNG and ENG PK following the same 30 µg IV bolus dose are comparable with one another, in which ENG Cmax and AUCinf values are 6.67% and 25.5% higher, respectively, compared to those for LNG. While there are notable differences between LNG and ENG, especially in terms of protein binding (FDA Citation1996; FDA Citation2001), this finding suggests a degree of interchangeability between the two synthetic progestins that demonstrate equivalent PK. The AUCinf following LNG 60 µg 1-hr IV infusion or SC injection is about two-fold higher than that following 30 µg IV bolus, suggesting dose-proportionality of LNG exposure and constant CL across doses. The estimated LNG CL in minipig is approximately 20-fold higher than that in rats (21.5 vs. 1.01 L/hr), but lower on a ‘per weight’ basis. While the exact reasoning for these differences in CL cannot be explained, this finding may be attributed to the number of LLOQ values observed with concentrations in minipig and suggests that a more sensitive assay should be used for minipigs following clinical doses of LNG. Finally, the high F values corroborate the high absorption of LNG and ENG when administered through the skin, both in animals and in humans (FDA Citation1996; FDA Citation2001).
One of the limitations of these studies was not using an assay that was sensitive enough to detect plasma concentrations <10 or 20 pg/mL for Study 1 with minipig. The LNG concentrations in minipig were lower than expected and thus not all PK parameters were within the acceptable criteria of the NCA to be reported. Another limitation not specifically related to the studies is the fact that we did not measure some of the physiological parameters associated with LNG and ENG, like oestradiol and SHBG levels. Comparing LNG and ENG concentrations with oestradiol and SHBG levels will allow better interpretation of the nonclinical PK results and subsequent translation to human PK.
The future direction of these studies would be to demonstrate the significance of nonclinical PK information in LARC development by summarising, implementing, and translating the study results to an in vivo release rate in women. Other directions include conducting further nonclinical PK studies in other species (e.g. rabbit and dog), comparing the accuracy and precision of the calculated in vivo release rates with the observed release rates, and exploring the applicability of this information in the context of currently accepted regulatory standards for calculating in vivo release rate from controlled-release or long-acting formulations.
Conclusions
Our studies set out to determine LNG and ENG IV PK as well as assess the bioavailability of LNG administered via extravascular routes in rats and minipig. LNG PK was comparable to ENG PK in rats, LNG exposure (i.e. AUCinf) was shown to be dose-proportional in rats, LNG CL in minipig was higher than that of rat (but lower on a ‘per weight’ basis), and F of LNG in both species was high (> 90%). The findings from these studies will continue to narrow the gap in nonclinical LNG and ENG PK as well as support the ongoing development of innovative LARCs by providing IV PK data necessary to estimate in vivo release rates from controlled-release or long-acting formulations.
Supplemental Material
Download PDF (120.5 KB)Disclosure statement
The authors report no conflict of interest.
Data availability statement
The authors confirm that the data supporting the findings of this study are available within its supplementary materials.
Additional information
Funding
References
- Ananthula S, Janagam DR, Jamalapuram S, Johnson JR, Mandrell TD, Lowe TL. 2015. Development and validation of sensitive LC/MS/MS method for quantitative bioanalysis of levonorgestrel in rat plasma and application to pharmacokinetics study. J Chromatogr B Analyt Technol Biomed Life Sci. 1003:47–53.
- Ding W, Qi X, Fu Q, Piao H. 2007. Pharmacokinetics and pharmacodynamics of sterylglucoside-modified liposomes for levonorgestrel delivery via nasal route. Drug Deliv. 14(2):101–104.
- Düsterberg B. 1984. Plasma levels of levonorgestrel, gestodene, norethisterone and cyproterone acetate on single-dose subcutaneous administration in oily solution in the rat, beagle and rhesus monkey. Steroids. 43(1):43–56.
- Düsterberg B, Beier S. 1984. Plasma levels and progestational activity of levonorgestrel after repeated intravenous and subcutaneous administration in the beagle bitch. Contraception. 29(4):345–357.
- Düsterberg B, Hümpel M, Speck U. 1981. Terminal half-lives in plasma and bioavailability of norethisterone, levonorgestrel, cyproterone acetate and gestodene in rats, beagles and rhesus monkeys. Contraception. 24(6):673–683.
- Fischer J, Ganellin CR. 2006. Analogue-based drug discovery. Weinheim (DE): Wiley. Chapter 22, Corticosteroids: from natural products to useful analogues; p. 419–552.
- Gabelnick HL, Hall PE. 1987. Long-acting methods for fertility regulation. J Control Release. 6(1):387–394.
- Geelen JA, van der Wardt JT, Voortman G, Maassen GC, Eenink MJ. 1993. Release kinetics of 3-keto-desogestrel from contraceptive implants (Implanon®) in dogs: comparison with in vitro data. Contraception. 47(2):215–226.
- He M, Yang G, Zhang S, Zhao X, Gao Y. 2018. Dissolving microneedles loaded with etonogestrel microcrystal particles for intradermal sustained delivery. J Pharm Sci. 107(4):1037–1045.
- He M, Yang G, Zhao X, Zhang S, Gao Y. 2020. Intradermal implantable PLGA microneedles for etonogestrel sustained release. J Pharm Sci. 109(6):1958–1966.
- Hu SX. 2017. Age-related change of hepatic uridine diphosphate glucuronosyltransferase and sulfotransferase activities in male chickens and pigs. J Vet Pharmacol Therap. 40(3):270–278.
- Jenkins N, Fotherby K. 1981. Binding of the gestagens norethisterone and levonorgestrel in blood of various species. J Steroid Biochem. 14(10):1055–1062.
- Kuhnz W, Al-Yacoub G, Fuhrmeister A. 1992. Pharmacokinetics of levonorgestrel in 12 women who received a single oral dose of 0.15 mg levonorgestrel and, after a wash-out phase, the same dose during one treatment cycle. Contraception. 46(5):443–454.
- Kuhnz W, Beier S. 1994. Comparative progestational and androgenic activity of norgestimate and levonorgestrel in the rat. Contraception. 49(3):275–289.
- Kuhnz W, Fritzemeier KH, Hegele-Hartung C, Krattenmacher R. 1995. Comparative progestational activity of norgestimate, levonorgestrel-oxime and levonorgestrel in the rat and binding of these compounds to the progesterone receptor. Contraception. 51(2):131–139.
- Ma G, Song C, Sun H, Yang J, Leng X. 2006. A biodegradable levonorgestrel-releasing implant made of PCL/F68 compound as tested in rats and dogs. Contraception. 74(2):141–147.
- MacCallum DM, Odds FC. 2002. Influence of grapefruit juice on itraconazole plasma levels in mice and guinea pigs. J Antimicrob Chemother. 50(2):219–224.
- Mansour D, Inki P, Gemzell-Danielsson K. 2010. Efficacy of contraceptive methods: a review of the literature. Eur J Contracept Reprod Health Care. 15(1):4–16.
- Margolskee A, Darwich AS, Galetin A, Rostami-Hodjegan A, Aarons L. 2016. Deconvolution and IVIVC: exploring the role of rate-limiting conditions. Aaps J. 18(2):321–332.
- Nair KM, Sivakumar B, Rao BS. 1981. The rabbit as an animal model to study pharmacokinetics of levonorgestrel in women. Contraception. 23(1):89–98.
- Naqvi RH, Mitra SB, Lindberg MC. 1984a. Effect of dose on the pharmacokinetics of levonorgestrel in the rat during the rapid elimination phase following subcutaneous administration. Contraception. 30(6):599–605.
- Naqvi RH, Mitra SB, Saksena I, Lindberg MC. 1984b. Pharmacokinetics of levonorgestrel in the rat. Contraception. 30(1):81–88.
- Renoir J, Mercier-Bodard C, Baulieu E. 1980. Hormonal and immunological aspects of the phylogeny of sex steroid binding plasma protein. Proc Natl Acad Sci USA. 77(8):4578–4582.
- Shahiwala A, Misra A. 2004. Nasal delivery of levonorgestrel for contraception: an experimental study in rats. Fertil Steril. 81(1):893–898.
- Sully EA, Biddlecom A, Darroch JE, Riley T, Ashford LS, Lince-Deroche N, Firestein L, Murro R. 2020. Adding it up: investing in sexual and reproductive health 2019. New York (NY): Guttmacher Institute.
- US Food and Drug Administration (FDA) 1996. Jadelle: highlights of prescribing information. [Turku (FI)]: Bayer OY. [updated 2016 Dec 20; accessed 2021 Jun 15]. https://www.accessdata.fda.gov/drugsatfda_docs/label/2016/020544s010lbl.pdf.
- US Food and Drug Administration (FDA) 2001. Nexplanon: highlights of prescribing information. [Oss (NL)]: NV Organon. [updated 2020 Sep; accessed 2021 Nov 15]. https://www.accessdata.fda.gov/drugsatfda_docs/label/2020/021529s019s020lbl.pdf.
- Xu S, Hu A, Xie L, Liu J, Wu Q, Liu J. 2019. Age-associated changes of cytochrome P450 and related phase-2 gene/proteins in livers of rats. PeerJ. 7(e7249):e7429– 20.
- Xu Y, Prohn M, Cai X, Crutchlow M, Shankar SS, Bateman K, Woolf EJ. 2014. Direct comparison of radioimmunoassay and LC-MS/MS for PK assessment of insulin glargine in clinical development. Bioanalysis. 6(24):3311–3323.