

Abstract
Ovarian cancer (OC) is characterised by heterogeneity that complicates the prediction of patient survival and treatment outcomes. Here, we conducted analyses to predict the prognosis of patients from the Genomic Data Commons database and validated the predictions by fivefold cross-validation and by using an independent dataset in the International Cancer Genome Consortium database. We analysed the somatic DNA mutation, mRNA expression, DNA methylation, and microRNA expression data of 1203 samples from 599 serous ovarian cancer (SOC) patients. We found that principal component transformation (PCT) improved the predictive performance of the survival and therapeutic models. Deep learning algorithms also showed better predictive power than the decision tree (DT) and random forest (RF). Furthermore, we identified a series of molecular features and pathways that are associated with patient survival and treatment outcomes. Our study provides perspective on building reliable prognostic and therapeutic strategies and further illuminates the molecular mechanisms of SOC.
What is already known on this subject? Recent studies have focussed on predicting cancer outcomes based on omics data. But the limitation is the performance of single-platform genomic analyses or the small numbers of genomic analyses.
What do the results of this study add? We analysed multi-omics data, found that principal component transformation (PCT) significantly improved the predictive performance of the survival and therapeutic models. Deep learning algorithms also showed better predictive power than did decision tree (DT) and random forest (RF). Furthermore, we identified a series of molecular features and pathways that are associated with patient survival and treatment outcomes.
What are the implications of these findings for clinical practice and/or further research? Our study provides perspective on how to build reliable prognostic and therapeutic strategies and further illuminates the molecular mechanisms of SOC for future studies.
Impact statement
Introduction
In women, OC is the 8th most commonly diagnosed cancer and the leading cause of cancer death (Sung et al. Citation2021). The prognosis of ovarian cancer is generally poor, with a 5-year survival rate of only 48% after diagnosis, the survival rate of ovarian cancer has changed little over the decades, even in resource-rich countries (Guo et al. Citation2020). The standard line of care treatment includes surgery and platinum-based chemotherapy; a high rate of recurrence following the initial treatment has been observed. Most of these relapsed cases are less curable and known to have an increased incidence of treatment failures (Arora and Lekkala Citation2022). Possibly, ovarian cancer’s inherent resistance may be due to reduced immunosurveillance and drug-resistant cells(Laganà et al. Citation2015, Fagotti et al. Citation2020). Recent studies have focussed on predicting cancer outcomes based on omics data ( Chaudhary et al. Citation2018, Chi et al. Citation2019). However, prognostic prediction of ovarian cancer is mostly limited to single omics data such as RNA expression data (Ge et al. Citation2022) or DNA methylation data (Feng et al. Citation2021). It is difficult for single omics data to fully account for all factors in a disease as complex as cancer, predicting the prognosis of ovarian cancer from multi-omics perspective and introducing prior knowledge such as pathway knowledge is necessary.
Here, we conduct our research using the Genomic Data Commons (GDC) database (previously hosted by the Cancer Genome Atlas (TCGA)) as the training set and the International Cancer Genome Consortium (ICGC) database as an independent validation set. The goal of our study is to improve the utility of the molecular data used in clinical practice. Thus, we train GDC data using different computing algorithms to evaluate the prognostic utility and the treatment outcome utility. The features that determine the prognosis and treatment outcomes are represented by gene expression, somatic DNA mutation, miRNA expression, and DNA methylation levels, which show the potential ability to differentiate cancer patients into different subtypes (Zhang et al. Citation2011). We then assess the predictive power of each algorithm on each type of genomic feature. In particular, we evaluate the deep learning approach for binary treatment outcome classification, which offers a set of algorithms that can use multiple processing layers for unsupervised or semi-supervised feature learning and hierarchical feature extraction (Schmidhuber Citation2015). We then identify multiple genetic markers and pathways that are significantly related to patient survival and treatment outcomes. Our work may provide a new perspective for classifying SOC patients into different risk groups to achieve better treatment and illuminate the molecular mechanisms of SOC for future studies.
Methods
Core data set download and preparation
The study population consisted of a training set and a testing set. The patients in the training set were collected from TCGA, which is available in the GDC data portal (https://gdc-portal.nci.nih.gov/), while the patients in the testing set were from the ICGC data portal (http://icgc.org/). We downloaded clinical and molecular data, including data on somatic mutation, mRNA expression, DNA methylation, and miRNA expression, for the discovery of prognostic predictive biomarkers. For the training set, GDC data level 3 was selected. For the independent testing set, ICGC data release 23 was used for further validation. We collected multi-omics data from the GDC database, including clinical variables and molecular variables. Quantitative data variables in ICGC were normalised using log transformation. The Pearson correlation coefficients were calculated in mRNA expression, and DNA methylation and the Spearman correlation coefficients were calculated in somatic mutation to observe the batch effects between the two databases. The python programming language was used to extract core clinical and molecular data and construct survival, regression and classification models for model training and performance comparison.
Clinical criteria
All patients in the training cohort and the validation cohort were diagnosed with SOC. Each patient ID corresponded to the vital status (represented by 0 and 1 where 0 means alive and 1 means death; other choices are 1= alive, 2 = death) and survival days (if the patient was dead, the survival time was the number of days to die, and if the patient survived, the survival time was the last follow-up time, which was the correctly censored data).
The treatment outcomes of our HGSOC patients were assessed using only GDC data. Patients who received platinum- or taxane-based chemotherapy as first-line treatments were grouped into four categories: complete remission, partial remission, stable disease, and progressive disease. According to their recurrence time and response evaluation, the patients were divided into four other groups: sensitive, primary resistant, persistent, and refractory (represented by 1–4. 1 = sensitive, 2 = primary resistant, 3 = persistent, and 4 = refractory). We divided the treatment outcomes into sensitive and resistant (represented by 1 and 2 where 1 means sensitive and 2 means resistant). Resistant patients include the primary resistant SOC, persistent SOC and refractory SOC because of their similar challenges in clinical practice.
Feature selection
For the prognosis models, we used the GDC data as the training set and the ICGC data as the validation set. We performed Cox regression analysis as a pre-selection step to identify molecular features that had a significant relationship with patient survival (univariate Cox regression, R package “survival”, p < .05). To improve the training model convergence, we required the number of retained features not to exceed the number of events (deaths) in the training set. A comparison using the PCT method was applied to further feature extractions.
For treatment outcome models, we randomly split the GDC samples into two groups: 80% as the training set and 20% as the validation set. The Fisher test and Wilcoxon test were used for pre-selection. Similarly, the PCT method was associated with shrinking feature size. We repeated the above procedures 100 times for the next step of model training and validation.
Pathway analyses of molecular features in prognostic models
We analysed the biological processes related to molecular features that were significantly associated with patient survival. We downloaded functional categories that listed the biological processes corresponding to gene symbols from PANTHER slim GO items. We then used the Fisher exact test to measure the gene set enrichment in annotation terms. The terms of signalling pathways with which the gene set was specifically associated were identified by calculating the p value (using 0.05 as the significance cutoff).
Model training and validation
We used three computational methods to train the regression models for prognosis: (i) LASSO and Cox: LASSO with Cox regression was performed for variable selection by using the R package “glmnet” and “survival”. The set of functions mainly included “glmnet”, “cv.glmnet”, “optimal.beta”, “coxph”, and “survfit”. (ii) RFS: RF for survival analyses were performed using the R package "randomForestSRC". The set of functions mainly included “rfsrc” and “predict”. (iii) DNN: DNN was performed using the Python package “tensorflow” and a set of functions was used for regression models. For treatment outcome models, we used three computational methods to train the classification models: (i) DT (Python package “sklearn”, functions: “tree.DecisionTreeClassifier” and “dt_classifier.predict”), (ii) RF (Python package “sklearn”, functions: “ensemble.RandomForestClassifier” and “rf_classifier.predict”), and (iii) DNN (Python package “tensorflow”, functions: “learn.DNNClassifier” and “dnn_classifier.predict”). We then applied the resulting model coefficients to the test set for prediction and calculated the C-index (a measure of model accuracy) for predictive power using the R package “Hmisc” (function: “rcorr.cens”). This procedure was repeated 100 times.
Results
Data collection and feature pre-selection of molecular data
We collected multi-omics data on 599 SOC patients from the GDC database and 92 SOC patients from the ICGC database. For the SOC training set, we focussed on a core matrix in which each sample has a complete record of survival information, treatment outcome and at least one of the four types of molecular data. For the validation set, we generated a core matrix by the same method as for the training set, except that treatment outcomes were not available. For the GDC clinical features, in terms of the follow-up data, survivals accounted for 46.9% (281/599), deaths accounted for 50.4% (302/599), and missing data accounted for 2.7% (16/599). Concerning treatment outcome, drug-sensitive SOC patients accounted for 44.1% (264/599), drug-resistant patients (primary drug-resistant, persistent, and refractory) accounted for 22% (132/599), and missing data or invalid data accounted for 33.9% (203/599). For ICGC clinically dependent variables, survivals and deaths accounted for 20.4% (19/93) and 79.6% (74/93), respectively.
We pre-selected the molecular data to obtain an overview of the main set of biologically important features. For survival models, Cox proportional hazards regression was used to identify the most significant features (univariate Cox model, Wald test, p < 0.05). We identified 892 genes (somatic DNA mutation), 1685 genes (mRNA expression), 163 miRNAs (miRNA expression), and 362 genes (DNA methylation) that were significantly related to survival and overlapped between GDC and ICGC. For the therapeutic models, the Fisher test (DNA sequencing qualitative variables) and the Wilcoxon test (the other three molecular variables) were used for basic feature selection. Forty-three genes (somatic DNA mutation), 1480 genes (mRNA expression), 123 miRNAs (miRNA expression), and 808 genes (DNA methylation) were identified (Additional files 1 and 2) and applied to the next step of model training and prediction. All quantitative data on molecular features were standardised (see Methods) to reduce the gap generated between two different platforms. Particularly, batch effects between the two databases were observed by correlation plot. The Pearson correlation coefficients are 0.93, 0.93, and 0.31 in mRNA expression, DNA methylation and somatic mutation, respectively. 95% CIs are 0.91–0.94, 0.92–0.94, and 0.30–0.32 in mRNA expression, DNA methylation and somatic mutation, respectively. p Values are 8.16×10−84, 1.62 × 10−92 and 2.36 × 10⁻³ in mRNA expression, DNA methylation and somatic mutation, respectively.
Model training and predictions based on molecular data
We assessed the predictive power of the molecular data using the C-index, which could be applied to both censored response variables and binary responses to evaluate the prediction accuracy (Harrell et al. Citation1996). When the C-index is ∼0.5, the predictive outcome is no better than a random guess, and when the C-index is 1, every predicted value is exactly true. The number of retained features is limited by the number of events in the training set used for model training. We repeated the fivefold cross-validation for each type of genomic measurement and response variable 100 times.
For survival models using fivefold cross-validation, DNA mutation and mRNA expression achieved better performances than miRNA expression and DNA methylation (). The predictive performances of the least absolute shrinkage and selection operator (LASSO) Cox and the random forest (RF) approach each showed distinct advantages in survival models (). For therapeutic models, the predictive performance of the RF-based model was significantly better than that of the decision tree (DT)-based model concerning three of the four types of omics data (). Moreover, Kaplan–Meier survival curves were generated for showing how the obtained C-indexes were linked to the actual difference. showed as an example that patients were divided into two sub-groups according to the predicted values (higher and lower than the median, respectively), and the outcome of actual patient survival showed the significance of the difference in the two groups.
Figure 1. C-index of models trained for survival days and treatment outcome. (A): model for survival days and validated by fivefold cross-validation. (B): Models for survival days and validated by the ICGC database. (C): Models trained for treatment outcome and validated by fivefold cross-validation. For fivefold cross-validation, during each of the 100 times of random splitting, 80% of the total samples were used for the training model and the remaining 20% as the test set for C-index calculations within GDC data. For independent validation, models were trained using the total samples of GDC data and validated using ICGC data. The boundaries of the box showed the first and third quartile, a segment as the median, and whiskers extending to the minimum and maximum. The red dotted line marked C-index equivalent to random guess (C-index = 0.5).
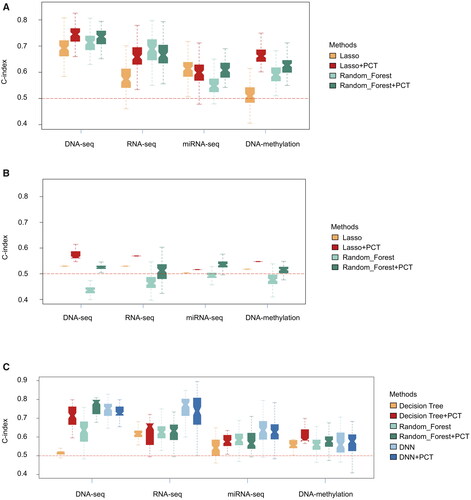
Figure 2. Kaplan–Meier survival curve generated from gene expression data (RNA expression). Patients are divided into two subgroups based on the median of predicted survival days using (A) LASSO, and (B) Random Forest. The red curve (subgroup 1) are patients with predicted values lower than the median, while the blue curve (subgroup 2) are patients with predicted values higher than the median. The y-axis represents the actual cumulative probability of patients surviving. 3D scatter plot of the top three principal components of gene expression data (RNA expression): (C) for survival model (the colour bar shows patient survival days), (D) for treatment outcome model (red: drug-sensitive patients; blue: drug-resistant patients).
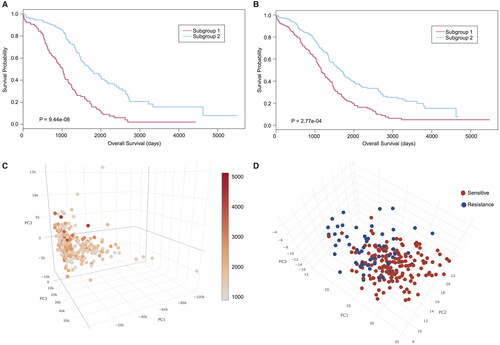
To further reduce the dimensions of the data, we used PCT to produce a new set of input features by linearly combining the pre-selected genomic features so that a few top principal components (PCs) could explain most of the variation in the data (Eriksson et al. Citation2004; Gerstung et al. Citation2015). For almost all molecular types, the C-indexes of the LASSO or RF-based models combined with PCT were higher than those without PCT (). The average improvement in C-indexes for survival models was 7.86%, and the average improvement in C-indexes for therapeutic models was 7.01%. We also clustered the samples based on the top PCs of models in different molecular types. Notably, we found that the PCs derived from the RNA expression data could separate groups of patients as sensitive and resistant and showed a continuum of patient survival days (). However, the PCs for the other three of the four types of omics data showed limited power to distinguish patients with drug-resistant and drug-sensitive cancer.
For the independent validation sets, the predictive performance of independent validation was lower than that of fivefold cross-validation, as expected. LASSO showed slightly better performance than RF in all four groups of omics data (). PCT improved the C-index by an average of 8.47% in the four groups of data and reduced data noise more effectively than in the fivefold cross-validation set, in which it improved the C-index by an average of 7.37%.
In addition, we examined the effects of different deep-learning algorithms on model performance. We performed a deep neural network (DNN) analysis on the treatment outcome model and found that DNN significantly improved the predictive power for mRNA expression and miRNA expression ().
Gene set and pathway analysis for biological insights on pre-selected model
First, we performed an intersection analysis between different types of molecular features. Interestingly, for the therapeutic model, we found that the mRNA expression of genes and the DNA methylation levels of gene promoters overlapped significantly (p = .00807). Among the overlapped gene signatures of the survival model, POLD2 and MYL2 were present in three groups at the same time. These two genes were previously identified by other studies as biomarkers predicting the survival of OC patients. Additionally, we found that CXCL9, CACNA2D1 and EHD1 were notable markers associated with patient survival. Among the overlapped gene signatures of the therapeutic models, GABARBP, CXCL11, JAG1, FANCA, and CABIN1 were associated with chemotherapies administered to HGSOC patients.
We attempted to provide biological insights into genetic mechanisms based on pre-selected molecular features. We developed a visualisation tool based on CIRCOS (Krzywinski et al. Citation2009) to display the Gene Ontology (GO) terms significantly overrepresented in a set of genes (survival pre-selected model and treatment outcome pre-selected model for somatic DNA mutation, RNA expression, and DNA methylation, individually). A comprehensive set of PANTHER slim GO items including 534 GO ids (Mi et al., Citation2013) was used for this part of pathway analyses (see in Material and Methods).
For the survival model, there were 15 matched pathways for DNA mutation, 18 pathways for RNA expression, and 22 pathways for DNA methylation. Cell adhesion (P = 1.34 × 10⁻⁴) and nervous system development (P = 1.22 × 10⁻⁵) were the most significant biological processes, and ligase activity (P = 2.21 × 10⁻³) was the most significant cellular component (). Moreover, we summarised the direct parent terms of these significant GO ids to offer a broader perspective on gene function. Natural killer cell activation, the apoptotic process, and necrosis factor-activated receptor activity were implicated in DNA methylation. Cell adhesion, the extracellular matrix, intracellular protein transport, and protein phosphorylation were significant in DNA mutation and RNA expression. The overexpression of epithelial cell adhesion molecule (Ep-CAM) and activated leukocyte cell adhesion molecule was an independent prognostic marker and predictor for the survival of patients with epithelial OC (Spizzo et al. Citation2006, Mezzanzanica et al. Citation2008). On the other hand, the E3 ligase activity of an inhibitor of apoptosis proteins (IAPs) has been shown to protect the cell from apoptosis, which is widely believed to be related to the development of tumours and patient survival.
Figure 3. Circos plot of GO terms significantly overrepresented in a set of genes selected in multi-omics data models. (A): somatic DNA mutation for survival model. (B): Somatic DNA mutation for the therapeutic model. (C): RNA expression for survival model. (D): RNA expression for the therapeutic model. (E): DNA methylation for survival model. (F): DNA methylation for a therapeutic model. The outer and inner rings show the three root categories (green: biological process, violet: cellular component, orange: molecular function) and parent terms of the significant GO terms, respectively. The bars in the third level represent the average fold changes of significant pathways in GO. The Bezier curves of the plot represent the overlapping genes of significant pathways. Green links represent the genes with an overlap in biological processes, blue links in a cellular component, and dark links in molecular function, whereas red links represent the genes that overlap between two of the three sub-ontologies. Full names of the GO terms shown in this plot can be found in the Supplementary material (Additional file 3).
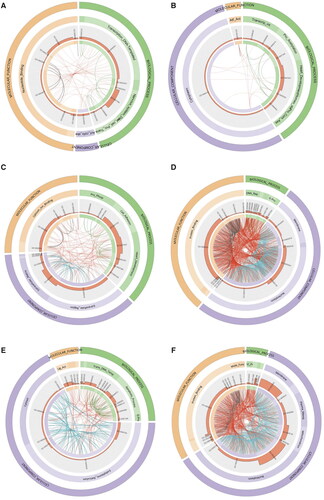
For the therapeutic outcome model, there were 9 matched pathways for DNA mutation, 25 pathways for RNA expression, and 25 pathways for DNA methylation. The membrane (P = 1.39 × 10⁻⁶), protein binding (P = 8.55 × 10⁻⁴), and nervous system development (P = 4.89 × 10⁻³) were the most significant cellular component, molecular function, and biological process, respectively (). Among the parent GO terms, G-protein coupled receptor signalling pathway, protein complex assembly, and protein acetylation was conspicuous, as shown in . Cell membrane and membrane-associated transport proteins have been widely reported to be associated with drug resistance (Schadendorf et al. Citation1995, Neul et al. Citation2016). Chemokine activity is among the notable overlapping pathways and may participate in patient survival and treatment outcomes by influencing the development of primary tumours and metastases (Balkwill Citation2004). Full names of the GO terms in the survival model and therapeutic outcome model can be found in the Supplementary material (Additional file 3).
Discussion
In contrast to previous studies that usually focussed on a single data platform, we also evaluated SOC prognosis signatures by combining the two platforms mentioned above. Our results suggest that the application of the model trained from one platform to another platform is feasible when clinically required, although it may not be as good as the single platform itself.
Previous research has compared the relationships between clinical variables and molecular data. Yuan et al. (Citation2014) study reported that clinical variables appeared to be more informative resources than molecular data alone but that incorporating molecular data statistically boosted the prediction performance. In this regard, our research was designed to find better ways to improve predictive power by trying the PCT method as an example. Recently, deep learning algorithms have achieved unprecedented performance in such domains as image classification (Kim et al. Citation2022), face recognition, and the game of Go (Silver et al. Citation2016). We found that DNN truly improved the predictive power. Our results suggest that methods should be selected, and molecular data should also be considered when they are applied to clinical practice.
In current clinical practice, CA125 remains the most reliable marker accepted for early detection, recurrence detection and therapy monitoring (Zhang et al. Citation2021, Ali et al. Citation2022). Accumulating evidence suggests that the management of ovarian cancer should be personalised taking into account the performance status of the patient, in particular in the case of elderly women (Vitale et al. Citation2019, Bizzarri et al. Citation2021). Nevertheless, our research illuminated some novel pathways and biomarkers that mainly reflect patient survival and treatment. As mentioned before, POLD2 and MYL2, CXCL9, CACNA2D1 and EHD1 may be associated with patient survival, while GABARBP, CXCL11, JAG1, FANCA, and CABIN1, JAG1-Notch1 signalling may be associated with treatment outcome. We found some molecular signatures have the potential to classify chemotherapy-sensitive and chemotherapy-resistant patients and could become novel hot spots of pharmaceutical targets.
Supplemental Material
Download Zip (149.6 KB)Disclosure statement
No potential conflict of interest was reported by the author(s).
Data availability statement
There is no data needed to be deposited. The source code used in our study is available via https://github.com/zhezhe301/ov_prognosis_prediction.git. The datasets generated and/or analysed during the current study are available from the corresponding author on reasonable request. This study was performed according to the Enhancing the QUAlity and Transparentcy of health Research (EQUATOR) network guideline (Ogrinc et al. Citation2019).
Additional information
Funding
References
- Ali, F.T., et al., 2022. Sensitivity and specificity of microRNA-204, CA125, and CA199 as biomarkers for diagnosis of ovarian cancer. PLOS One., 3, e0272308.
- Arora, T. and Manidhar Reddy Lekkala, M., 2022. Ovarian cancer. In: StatPearls [Internet]. Treasure Island (FL): StatPearls Publishing.
- Balkwill, F., 2004. Cancer and the chemokine network. Nature Reviews Cancer, 4 (7), 540–550.
- Bizzarri, N., et al., 2021. Is there any therapeutic role of pelvic and para-aortic lymphadenectomy in apparent early stage epithelial ovarian cancer? Gynecologic Oncology, 160 (1), 56–63.
- Chaudhary, K., et al., 2018. Deep learning based multi-omics integration robustly predicts survival in liver cancer. Clinical Cancer Research, 24 (6), 1248–1259.
- Chi, S.Q., et al., 2019. Semi-supervised learning to improve generalizability of risk prediction models. Journal of Biomedical Informatics, 92, 103117.
- Eriksson, L., et al., 2004. Using chemometrics for navigating in the large data sets of genomics, proteomics, and metabonomics (gpm). Analytical and Bioanalytical Chemistry, 380 (3), 419–429.
- Fagotti, A., et al., 2020. Randomized trial of primary debulking surgery versus neoadjuvant chemotherapy for advanced epithelial ovarian cancer (SCORPION-NCT01461850). International Journal of Gynecological Cancer: Official Journal of the International Gynecological Cancer Society, 30 (11), 1657–1664.
- Feng, L.Y., et al., 2021. Abnormal methylation characteristics predict chemoresistance and poor prognosis in advanced high-grade serous ovarian cancer. Clinical Epigenetics, 13 (1), 141.
- Ge, L., et al., 2022. Plasma circRNA microarray profiling identifies novel circRNA biomarkers for the diagnosis of ovarian cancer. Journal of Ovarian Research, 15 (1), 58.
- Gerstung, M., et al., 2015. Combining gene mutation with gene expression data improves outcome prediction in myelodysplastic syndromes. Nature Communications, 6, 5901.
- Guo, Y., Lu, Y.L. and Jin, H.C., 2020. Appraising the role of circulating concentrations of micro-nutrients in epithelial ovarian cancer risk: a Mendelian randomization analysis. Scientific Reports, 10 (1), 7356.
- Harrell, F.E., JR, et al., 1996. Multivariable prognostic models: issues in developing models, evaluating assumptions and adequacy, and measuring and reducing errors. Statistics in Medicine, 15 (4), 361–387.
- Kim, Y.J., et al., 2022. RGB channel superposition algorithm with acetowhite mask images in a cervical cancer classification deep learning model. Sensors, 22 (9), 3564.
- Krzywinski, M., et al., 2009. Circos: an information aesthetic for comparative genomics. Genome Research, 19 (9), 1639–1645.
- Laganà, A.S., et al., 2015. Cytogenetic analysis of epithelial ovarian cancer’s stem cells: an overview on new diagnostic and therapeutic perspectives. European Journal of Gynaecological Oncology, 36 (5), 495–505.
- Mezzanzanica, D., et al., 2008. Subcellular localization of activated leukocyte cell adhesion molecule is a molecular predictor of survival in ovarian carcinoma patients. Clinical Cancer Research, 14 (6), 1726–1733.
- Mi, H., et al., 2013. Large-scale gene function analysis with the PANTHER classification system. Nature Protocols, 8 (8), 1551–1566.
- Neul, C., et al., 2016. Impact of membrane drug transporters on resistance to small-molecule tyrosine kinase inhibitors. Trends in Pharmacological Sciences, 37 (11), 904–932.
- Ogrinc, G., et al., 2019. SQUIRE-EDU (Standards for QUality Improvement Reporting Excellence in Education): publication guidelines for educational improvement. Academic Medicine, 94 (10), 1461–1470.
- Schadendorf, D., et al., 1995. Membrane transport proteins associated with drug resistance expressed in human melanoma. The American Journal of Pathology, 147 (6), 1545–1552.
- Schmidhuber, J., 2015. Deep learning in neural networks: an overview. Neural Networks, 61, 85–117.
- Silver, D., et al., 2016. Mastering the game of Go with deep neural networks and tree search. Nature, 529 (7587), 484–489.
- Spizzo, G., et al., 2006. Overexpression of epithelial cell adhesion molecule (Ep-CAM) is an independent prognostic marker for reduced survival of patients with epithelial ovarian cancer. Gynecologic Oncology, 103 (2), 483–488.
- Sung, H., et al., 2021. Global cancer statistics 2020: GLOBOCAN estimates of incidence and mortality worldwide for 36 cancers in 185 countries. CA: A Cancer Journal for Clinicians, 71 (3), 209–249.
- Vitale, S.G., et al., 2019. Management of endometrial, ovarian and cervical cancer in the elderly: current approach to a challenging condition. Archives of Gynecology and Obstetrics, 299 (2), 299–315.
- Yuan, Y., et al., 2014. Assessing the clinical utility of cancer genomic and proteomic data across tumor types. Nature Biotechnology, 32 (7), 644–652.
- Zhang, J., et al., 2011. International Cancer Genome Consortium Data Portal – a one-stop shop for cancer genomics data. Database: The Journal of Biological Databases and Curation, 2011, bar026.,
- Zhang, M., et al., 2021. Roles of CA125 in diagnosis, prediction, and oncogenesis of ovarian cancer. Biochimica et Biophysica Acta Reviews on Cancer, 1875 (2), 188503.