
 ?Mathematical formulae have been encoded as MathML and are displayed in this HTML version using MathJax in order to improve their display. Uncheck the box to turn MathJax off. This feature requires Javascript. Click on a formula to zoom.
Abstract
The different features of the impact of nanoparticles on cells, such as the structure of the core, presence/absence of doping, quality of surface, diameter, and dose, were used to define quasi-SMILES, a line of symbols encoded the above physicochemical features of the impact of nanoparticles. The correlation weight for each code in the quasi-SMILES has been calculated by the Monte Carlo method. The descriptor, which is the sum of the correlation weights, is the basis for a one-variable model of the biological activity of nano-inhibitors of human lung carcinoma cell line A549. The system of models obtained by the above scheme was checked on the self-consistence, i.e., reproducing the statistical quality of these models observed for different distributions of available nanomaterials into the training and validation sets. The computational experiments confirm the excellent potential of the approach as a tool to predict the impact of nanomaterials under different experimental conditions. In conclusion, our model is a self-consistent model system that provides a user to assess the reliability of the statistical quality of the used approach.
Introduction
The application of nanoparticles in medicine (Singh et al. Citation2020), the ecological impact of nanomaterials (Kleandrova et al. Citation2014), and nano-toxicology (Alfaro-Moreno et al. Citation2013) are new and intensively developing fields of knowledge in natural sciences. Expanding the range of nanomaterials leads to very effective developments in the chemical industry, electronics, and medicine. Still, it also leads to an increase in ecological and human health safety problems (Toropova and Toropov Citation2022). Nanomaterials are expected to be applied in a large number of variations in properties such as size, shape, coating, and chemical composition, and properties without analogies at present (Zielińska et al. Citation2020, Lebre et al. Citation2022). It is possible to detect a group of new special endpoints related to nanomaterials’ genetic and ecological impact (e.g., carcinogenicity). The complexity of nanomaterials leads to problems in solving the task of assessing their safety and potential risks. The levels of exposure to nanomaterials under different conditions caused the necessity to develop tools that allow reliable indicators of dangerous nanomaterials (Panneerselvam and Choi Citation2014, Lebre et al. Citation2022).
Like traditional substances, nanomaterials desire computational interpretation of their physicochemical and biochemical behavior. However, if quantitative structure–property/activity relationships (QSPRs/QSARs) for traditional substances are a fundamental research tool, nano-QSPR/QSAR has not yet become such a tool. The classic QSPR/QSAR analysis is based on different approaches representing the molecular structure and, as a rule, aims to select substances that are most suitable candidates for defined aims. Statistical standardization of the analysis of the physicochemical and biochemical behavior of nanomaterials, as well as for traditional substances, can be implemented through compliance with the so-called five principles of the OECD (Organization for Economic Cooperation and Development): (1) an endpoint must be defined; (2) the exact algorithm of calculation of the model is formulated; (3) the area of applicability of the model is clearly indicated; (4) statistical measures of model reliability are indicated; (5) finally, a mechanistic interpretation of the model is quite desirable, if possible (OECD Citation2014, Citation2020; Toropova and Toropov Citation2022). The molecular graph (Mercader et al. Citation2000) data on vectors of physicochemical parameters (Polyakova et al. Citation2006) were the most popular basis for QSPR/QSAR works from 1980x to 2000x. Later, the simplified molecular input-line entry system (SMILES) (Weininger Citation1988) became a novel representation of the molecular structure for the QSPR/QSAR (Toropov et al. Citation2005).
The impact of nanomaterials on different objects (organs, organisms, and ecosystems) is often defined by somewhat experimental conditions, not by molecular structure. Under such circumstances, the quasi-SMILES (Toropov and Toropova Citation2015) become the more informative basis for building up models of physicochemical and biochemical behavior of nanomaterials, because those reflect the impact of experimental conditions (Trinh et al. Citation2018; Toropov and Toropova Citation2019, Citation2021a; Ahmadi et al. Citation2021; Toropova et al. Citation2021; Bunmahotama et al. Citation2022) as well as for traditional substances (Toropov et al. Citation2016). The present study aimed to estimate nano-QSAR models for viability cell line A549 under inhibition by various nanoparticles and under different physicochemical conditions.
Methods
Data
Experimental data (raw) on inhibitors’ impact on A549 cells by different nanoparticles under different experimental conditions (structure of the core, doping, surface, diameter, and dose) are taken from the literature (Shin et al. Citation2021). A collection of the different practical situations of the influence of different nanoparticles under the above experimental conditions contains 377 samples.
These samples are randomly split into active training (≈25%), passive training (≈25%), calibration (≈25%), and validation sets (≈25%). confirms that the five random splits examined here are far from identical. Each of the above subsets has its own task (Toropova and Toropov Citation2022). The task for the active training set is to compute correlation weights that provide a correlation between the experimental and calculated endpoint for the active training set. The task of the passive training set is to check whether the correlation obtained for the active training set is confirmed for similar compounds distributed in the passive training set. The calibration set is used to determine the start of overtraining. The final assessment of the predictive potential of the model is the task for the external validation set (invisible during model building).
Table 1. Percentage of identical distribution of samples into the active/passive training sets, calibration set, and validation set.
The cell viability serves as a measure of the biological activity of the above samples. The endpoint is expressed in μg/ml.
Quasi-SMILES building up
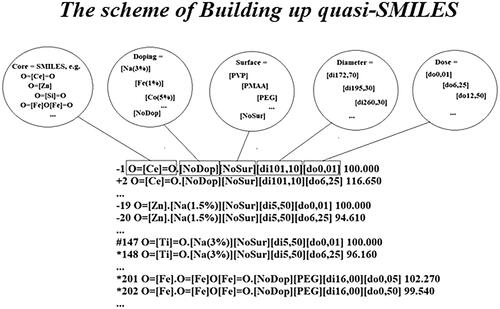
contains the general scheme of building up of quasi-SMILES. The traditional SMILES contain information on the 2D structures of molecules representing a nanoparticle’s core. The quasi-SMILES are lines of symbols that encode data on molecular structure (if it is expedient) and experimental conditions (if reasonable). Thus, the quasi-SMILES is a basis for building up a model as a mathematical function of the molecular structure of the core of the nanoparticle and physicochemical conditions of acting the nanoparticle:
(1)
(1)
Figure 1. The general scheme of building up quasi-SMILES.
The general scheme of building up models
Models of cell viability of nanoparticles under different experimental conditions are calculated as follows:
(2)
(2)
The C0 and C1 are regression coefficients. The DCW(T,N) is the optimal descriptor calculated with quasi-SMILES. The descriptor is calculated as follows:
(3)
(3)
The APPk is the vector of atoms pair’s proportions (Toropova, Toropov, and Benfenati Citation2021) related to oxygen (‘O’) and double bonds (‘═’) proportions. There are six APPk codes. These are the following: (O.═).1.1 (this code means that one oxygen and one double bond are present in a sample); (O.═).2.2; (O.═).2.3 (this code means that two oxygens and three double bonds are present in a sample); (O.═).3.2; (O.═).4.3; and (O.═).6.3.
The Sk is a so-called SMILES atom. The SMILES atom is one symbol (e.g., ‘C’, ‘O’, ‘N’, etc.) or a group of symbols which cannot examine separately (e.g., ‘Cl’, ‘Br’, 12%, etc.) (Weininger Citation1988). The SSk are combinations of two SMILES atoms, respectively. The qSk is an atom of quasi-SMILES (). The CWs for the listed attributes of SMILES and quasi-SMILES are calculated by the scheme described in the literature (Toropova, Toropov, and Benfenati Citation2021).
The threshold value T is used to classify the correlation weights. If the frequency of the corresponding attribute in the active training set is less than T, then this attribute is considered ‘rare’ and excluded from the model building process. In other words, correlation weights for rare features are defined as zero (blocked attribute). N is the number of Monte Carlo optimization epochs. Here, T= 1 and N= 15.
The Monte Carlo optimization aims to provide the correlation weights that produce the maximal value for the target function suggested in the literature, where the so-called index of ideality of correlation is applied (Toropova, Toropov, and Benfenati Citation2021).
Two target functions were compared as the basis for the Monte Carlo optimization. They are as follows:
(4)
(4)
(5)
(5)
The and
are correlation coefficients between the observed and predicted endpoint for the active and passive training sets, respectively. The IIC is the index of ideality of correlation (Toropova and Toropov Citation2017). The calculation of the IIC is as follows:
(6)
(6)
(7)
(7)
(8)
(8)
(9)
(9)
(10)
(10)
(11)
(11)
The observedk and calculatedk are the corresponding values of the endpoint.
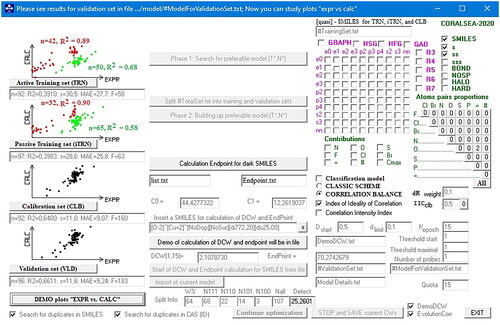
shows an example of the model for split 1. It should be noted that despite the statistical quality of the model for the active and passive training sets being low, these sets contain two latent correlations indicated by red and green. Apparently, this is the effect of exposure to IIC. Analogical pairs of correlations were observed in computer experiments described in the literature (Toropov et al. Citation2022). indicates that latent correlations are statistically significant.
Figure 2. The graphical representation of the model was obtained for split #1 by the CORAL program interface. Red and green colors show the statistical characteristics of hidden correlations for active and passive training sets.
The system of self-consistent models
Each ith model has ith validation set. As shown in , the results of the validation sets are not identical. It is critical to determine if an ‘arbitrary model’ can be used for an ‘arbitrary validation set’ (otherwise, the model is only suitable for the validation set used to build that model). If the answer is yes, these different models should be considered as ‘self-consistent’ ones (Toropova et al. Citation2022).
A measure of self-consistency is the mean value and variance of the correlation coefficient observed on different validation sets. The matrix is a diagram of the corresponding computational experiments:
(12)
(12)
the
is an ith model; the
is the list of nanoparticles applied as the validation set in the case of jth split; the
is the correlation coefficient observed for the jth validation set if applied ith model.
Results
Similar models for the inhibitory activity of nanoparticles under different experimental conditions for human lung carcinoma cell line A549 are unavailable. The original work developed local models to predict 32 nanoparticles without directly indicating lists for the training and test sets.
contains the statistical characteristics of the models calculated for five random splits.
Table 2. The statistical quality of models for splits #1–#5 observed in the cases of the Monte Carlo optimization with different target functions calculated with EquationEquation (4)(4)
(4) and EquationEquation (5)
(5)
(5) .
These results indicate that the models developed are not perfect because the statistical quality of these models is not high. Moreover, the allocation to the training set (here, it is structured into three sets, namely, active learning, passive learning, and calibration sets) has a noticeable effect on the predictive potential of the models. However, it is important that the correlation ideality index has a clear impact on the predictive potential. The use of the mentioned index in Monte Carlo optimization leads to a deterioration in the statistics for the training samples (excluding the calibration set) but to a clear improvement in the statistics for the external validation set.
This paradoxical situation is accompanied by dividing point arrays on the active and passive training samples into pairs of fairly significant separate correlations (). Thus, the resulting models can be evaluated as semi-quantitative. Their important quality is reproducibility. It is possible that with the involvement of additional initial information, the quality of the models will be improved. Finally, it is important that for all the considered models for five random partitions, the coefficient of determination for all 377 quasi-SMILES when using TF2 is greater than when using the objective function TF1. Thus, the expediency of using the index of ideality of correlation is once again confirmed.
For biochemical phenomena, high values of correlation coefficients are rare and may seem ‘artificial’ if considering the wide diversity of factors affecting them. In this work, correlations for external datasets are significant. These values are enough to state quite good replicability on five random splits. Perhaps by taking into account some additional experimental data, these models will be improved. The ability to use quasi-SMILES as a language of communication between experimenters and developers of models is another important aspect of the application of Quasi-SMILES (Toropova et al. Citation2022; Toropova, Toropov, and Fjodorova Citation2022; Toropov, Kjeldsen, and Toropova Citation2022).
Applicability domain
Applicability domain for models calculated by the CORAL software was defined according to SMILES and quasi-SMILES attributes’ statistical defects (Toropova, Toropov, and Benfenati Citation2021; Toropova et al. Citation2022), i.e., according to their frequencies in the active-, passive training sets, as well as their frequencies in the calibration set (validation set is external one).
In other words, the applicability domain for the described models was defined via the so-called statistical defects of quasi-SMILES attributes calculated as:
(13)
(13)
where P(Ak), P′(Ak) P″(Ak) are the probability of Ak in the active training set, passive training set, and calibration set, respectively; N(Ak), N′(Ak), and N″(Ak) are frequencies of Ak in the active training set, passive training set, and calibration set, respectively. The statistical quasi-SMILES-defects (Dj) are defined as:
(14)
(14)
where NA is the number of non-blocked quasi-SMILES attributes in the quasi-SMILES.
A quasi-SMILES falls in the applicability domain, if
(15)
(15)
The is the average value of the statistical defect on active and passive training sets.
Hence, the definition of the applicability domain is advisory in nature. However, very large values of the statistical defect are an obvious reason to exclude quasi-SMILES from the applicability domain of the model. The percentage of ‘unreliable’ quasi-SMILES depends on the distributions of the available data to the active training, passive training, calibration, and validation sets. The specified percentage (according to inequality 9) was 17, 23, 23, 17, and 25 for splits #1, #2, #3, #4, and #5, respectively.
Mechanistic interpretation
If several trials of Monte Carlo optimization are carried out, different sets of correlation weights will be obtained for the same attributes of quasi-SMILES. contains the results of such calculations. Those attributes that have solely positive correlation weights should be assessed as contributors to the increase in the endpoint in question. Those attributes of quasi-SMILES that have solely negative weights should be considered as contributors to reducing the simulated endpoint. It should be noted that attribute frequencies must also be taken into account. Those attributes, which are rare in the active and passive training sets, are unlikely to be the reliable basis for any statistical hypotheses. Thus, the absence of doping [NoDop], the presence of two oxygen atoms and two double bonds in the nanoparticle’s core that is represented by code ‘(O.═).2.2.’ as well as the presence of silver [Ag] should lead to an increase in inhibitory activity. In contrast, large doses indicated as [do100] and [do50] should reduce inhibitory activity.
Table 3. Fragments of quasi-SMILES are promoters of increase/decrease inhibition of human lung carcinoma cell line A549.
The predictive potential
The self-consistency of models (Toropov and Toropova Citation2021b, Toropova and Toropov Citation2021) obtained for different splits into the training (visible) and validation (invisible) sets confirms the good quality (predictive potential) suggested models. The same calculations without APP and IIC give poor values for the determination coefficient for diverse validation sets. One can see that the current version () of the design of models provides the above value of about 0.6 or even more significant. The determination coefficient values represented in is accompanied by the number of absent compounds in corresponding active training, passive training, and calibration sets.
Table 4. The statistical characteristics of the models for the lists of quasi-SMILES that were unknown when developing the corresponding model (i.e., quasi-SMILES which are absent in the active training, passive training, and calibration sets used to develop corresponding models).
Supplementary materials section contains details on the model for split 1, i.e., the experimental and calculated cell viability (μg/ml), together with lists of quasi-SMILES distributed in the active training, passive training, calibration, and validation sets. In addition, the list of abbreviations applied to construct quasi-SMILES codes is represented in the Supplementary material section.
Conclusions
The model of the biological activity of nano-inhibitors of human lung carcinoma cell line A549, calculated with data on the structure of the nanoparticle core and data on physicochemical conditions of the experiment, can be a reliable basis for building up a prediction of the endpoint. The use of the index of ideality of correlation in the Monte Carlo optimization process significantly improves the statistical quality of the model for the calibration set and the validation set since the use of this index blocks overtraining, i.e., it avoids the situation when the statistical quality on the training set is noticeably higher than on the external validation set. The self-consistent model system provides a user to assess the reliability of the statistical quality of the used approach for a group of different random splits into the training and test sets.
Author contributions
APT was involved in formal analysis, data collection, curation, investigation, methodology including statistics, software, visualization, writing of original draft, and revision. AAT was involved in conceptualization, data curation, formal analysis, investigation, methodology including statistics, software, writing of original draft, review, and editing. JM was involved in conceptualization, formal analysis, visualization, writing of original draft, review, and editing. EAM was involved in formal analysis, visualization, review, and editing. All authors revised it critically and finally approved the version to be submitted.
Supplemental Material
Download PDF (651.9 KB)Disclosure statement
The authors declare that they have no known competing financial interests or personal relationships that could have appeared to influence the work reported in this paper.
Data availability statement
The data used in this work and developed models are freely available Supplementary materials section.
Additional information
Funding
References
- Alfaro-Moreno, E., et al., 2013. Particulate matter and nanoparticles toxicology. BioMed Research International, 2013, 642974.
- Ahmadi, S., et al., 2021. The predictive model for band gap prediction of metal oxide nanoparticles based on quasi-SMILES. Structural Chemistry, 32 (5), 1893–1905.
- Bunmahotama, W., Vijver, M.G., and Peijnenburg, W., 2022. Development of a quasi–quantitative structure–activity relationship model for prediction of the immobilization response of Daphnia magna exposed to metal-based nanomaterials. Environmental Toxicology and Chemistry, 41 (6), 1439–1450.
- Kleandrova, V.V., et al., 2014. Computational ecotoxicology: simultaneous prediction of ecotoxic effects of nanoparticles under different experimental conditions. Environment International, 73, 288–294.
- Lebre, F., et al., 2022. Nanosafety: an evolving concept to bring the safest possible nanomaterials to society and environment. Nanomaterials, 12 (11), 1810.
- Mercader, A., Castro, E.A., and Toropov, A.A., 2000. QSPR modeling of the enthalpy of formation from elements by means of correlation weighting of local invariants of atomic orbital molecular graphs. Chemical Physics Letters, 330 (5–6), 612–623.
- OECD. 2014. Organisation for economic co-operation and development. ecotoxicology and environmental fate of manufactured nanomaterials, series on the safety of manufactured nanomaterials, ENV/JM/MONO(2014)1, test no. 40. Paris, France: OECD.
- OECD. 2020. Organisation for economic co-operation and development. Guidance document for the testing of dissolution and dispersion stability of nanomaterials and the use of the data for further environmental testing and assessment strategies. OECD guidelines for the testing of chemicals, ENV/JM/MONO(2020)9, test no. 318. Paris, France: OECD.
- Panneerselvam, S. and Choi, S., 2014. Nanoinformatics: emerging databases and available tools. International Journal of Molecular Sciences, 15 (5), 7158–7182.
- Polyakova, Y., Long, M.J., and Kyung, H.R., 2006. QSPR models for chromatographic retention of some azoles with physicochemical properties. Bulletin of the Korean Chemical Society, 27 (2), 211–218.
- Shin, H.K., Kim, S., and Yoon, S., 2021. Use of size-dependent electron configuration fingerprint to develop general prediction models for nanomaterials. NanoImpact, 21, 100298.
- Singh, A.V., et al., 2020. Artificial intelligence and machine learning in computational nanotoxicology: unlocking and empowering nanomedicine. Advanced Healthcare Materials, 9 (17), 1901862.
- Toropov, A.A., et al., 2005. Simplified molecular input line entry system (SMILES) as an alternative for constructing quantitative structure–property relationships (QSPR). Indian Journal of Chemistry Section A, 44 (8), 1545–1552.
- Toropov, A.A., et al., 2016. Towards predicting the solubility of CO2 and N2 in different polymers using a quasi-SMILES based QSPR approach. SAR and QSAR in Environmental Research, 27 (4), 293–301.
- Toropov, A.A. and Toropova, A.P., 2015. Quasi-SMILES and nano-QFAR: united model for mutagenicity of fullerene and MWCNT under different conditions. Chemosphere, 139, 18–22.
- Toropov, A.A. and Toropova, A.P., 2019. The Correlation Contradictions Index (CCI): building up reliable models of mutagenic potential of silver nanoparticles under different conditions using quasi-SMILES. Science of the Total Environment, 681, 102–109.
- Toropov, A.A. and Toropova, A.P., 2021a. Quasi-SMILES as a basis for the development of models for the toxicity of ZnO nanoparticles. Science of the Total Environment, 772, 145532.
- Toropov, A.A. and Toropova, A.P., 2021b. The system of self-consistent models for the uptake of nanoparticles in PaCa2 cancer cells. Nanotoxicology, 15 (7), 995–1004.
- Toropov, A.A., et al., 2022. The searching for agents for Alzheimer’s disease treatment via the system of self-consistent models. Toxicology Mechanisms and Methods, 32 (7), 549–557.
- Toropov, A.A., Kjeldsen, F., and Toropova, A.P., 2022. Use of quasi-SMILES to build models based on quantitative results from experiments with nanomaterials. Chemosphere, 303 (Pt 2), 135086.
- Toropova, A.P. and Toropov, A.A., 2017. The index of ideality of correlation: a criterion of predictability of QSAR models for skin permeability? Science of the Total Environment, 586, 466–472.
- Toropova, A.P. and Toropov, A.A., 2021. The system of self-consistent of models: a new approach to build up and validation of predictive models of the octanol/water partition coefficient for gold nanoparticles. International Journal of Environmental Research, 15 (4), 709–722.
- Toropova, A.P., et al., 2021. Application of quasi-SMILES to the model of gold-nanoparticles uptake in A549 cells. Computers in Biology and Medicine, 136, 104720.
- Toropova, A.P., Toropov, A.A., and Benfenati, E., 2021. The self-organizing vector of atom-pairs proportions: use to develop models for melting points. Structural Chemistry, 32 (3), 967–971.
- Toropova, A.P., et al., 2022. The system of self-consistent models for vapour pressure. Chemical Physics Letters, 790, 139354.
- Toropova, A.P., Toropov, A.A., and Fjodorova, N., 2022. Quasi-SMILES for predicting toxicity of nano-mixtures to Daphnia magna. NanoImpact, 28, 100427.
- Toropova, A.P. and Toropov, A.A., 2022. Nanomaterials: quasi-SMILES as a flexible basis for regulation and environmental risk assessment. Science of the Total Environment, 823, 153747.
- Trinh, T.X., et al., 2018. Quasi-SMILES-based nano-quantitative structure–activity relationship model to predict the cytotoxicity of multiwalled carbon nanotubes to human lung cells. Chemical Research in Toxicology, 31 (3), 183–190.
- Weininger, D., 1988. SMILES, a chemical language and information system: 1: introduction to methodology and encoding rules. Journal of Chemical Information and Modeling, 28 (1), 31–36.
- Zielińska, A., et al., 2020. Nanotoxicology and nanosafety: safety-by-design and testing at a glance. International Journal of Environmental Research and Public Health, 17 (13), 4657.