
Abstract
Background: Ketosis in dairy cattle is an important metabolic disorder. Currently, the plasma metabolic profile of ketosis as determined using liquid chromatography–mass spectrometry (LC/MS) has not been reported.
Objective: To investigate plasma metabolic profiles from cows with clinical ketosis in comparison to control cows.
Animals and methods: Twenty Holstein dairy cows were divided into two groups based on clinical signs and plasma β-hydroxybutyric acid and glucose concentrations 7–21 days postpartum: clinical ketosis and control cows. Plasma metabolic profiles were analyzed using LC/MS. Data were processed using principal component analysis and orthogonal partial least-squares discriminant analysis.
Results: Compared to control cows, the levels of valine, glycine, glycocholic, tetradecenoic acid, and palmitoleic acid increased significantly in clinical ketosis. On the other hand, the levels of arginine, aminobutyric acid, leucine/isoleucine, tryptophan, creatinine, lysine, norcotinine, and undecanoic acid decreased markedly.
Conclusion: Our results showed that the metabolic changes in cows with clinical ketosis involve complex metabolic networks and signal transduction. These results are important for future studies elucidating the pathogenesis, diagnosis, and prevention of clinical ketosis in dairy cows.
1. Introduction
Ketosis is an important metabolic disease in dairy cows resulting from carbohydrate and fatty acid metabolism disorders that may occur postpartum during peak lactation prior to the recovery of appetite and food intake (Padilla et al. Citation2005). Ketosis is usually divided into clinical ketosis and subclinical ketosis according to the presence of clinical symptoms. The clinical features of ketosis include rapid body weight loss, digestive disorders, decreased milk production associated with low blood glucose and high ketone body levels in blood, urine, and milk (Cote et al. Citation1969; Steen Citation2001). Cows with ketosis and low immunity are more susceptible to infectious diseases, such as mastitis and endometritis, that can give rise to poor milk production and reproductive performance, bringing a tremendous financial loss to the dairy industry (Miettinen Citation1995; Forslund et al. Citation2010). Therefore, although the etiology of ketosis remains contentious, it is essential to understand its pathogenesis.
Metabolomics is an important branch of study in systems biology, following genomics, transcriptomics, and proteomics (Nicholson et al. Citation1999). The levels of metabolites in cells, tissues, and fluids can directly reflect relationships between genes, proteins, and metabolism (Zhang et al. Citation2013). Thus, metabolomics research is helpful for clinical diagnoses (Oresic et al. Citation2006), drug discovery (Schneider et al. Citation2003), and other bioscience. Metabolomics research methods include mainly nuclear magnetic resonance (NMR), liquid chromatography–mass spectrometry (LC/MS), gas chromatography–mass spectrometry (GC/MS), and metabolic chips (Li et al. Citation2014). Of these techniques, LC/MS is well suited for detecting complex metabolites and identifying potential markers in biological samples.
LC/MS has been widely used for research in important diseases in human and animals, such as cancer, diabetes, and fatty liver. Yang et al. (Citation2011) found urine glycoprotein as biomarkers for bladder cancer and Chen et al. (Citation2011) found metabolite biomarkers of liver cancer and established a prediction model. To date, however, the plasma metabolic profile of ketosis as determined using LC/MS has not been reported. Therefore, the objective of the present study is to reveal the etiology of ketosis and lay a foundation for determining new biomarkers of clinical ketosis using LC/MS.
2. Materials and methods
2.1. Experimental animals
All experimental animals were treated according to the International Guiding Principles for Biomedical Research Involving Animals. Twenty animals with parities of 2–3 were selected 7–21 days postpartum from a dairy farm comprising 635 cows with a mean milk yield of 21.7 kg consisting of 3.42% protein and 2.93% fat. The cows were divided into two groups of 10 cows, each based on clinical symptoms and levels of plasma β-hydroxybutyric acid (BHBA): clinical ketosis (group I) and control cows (group II) (see ). Cows with clinical signs typical of ketosis and plasma BHBA concentrations >1.40 mmol/L and plasma glucose concentrations <2.50 mmol/L were assigned to group I; cows with no clinical signs and normal plasma BHBA concentrations <1.00 mmol/L and plasma glucose concentrations >2.80 mmol/L were assigned to group II (Al-Rawashdeh, Citation1999; Oetzel, Citation2004). Cows were fed a total mixed ration (TMR), which consisted of 8.5 kg of concentrated feed, 18.5 kg of silage maize, 4 kg of hay, and 350 g of fat. The nutritional components consisted of 55.60% dry matter (DM), 1.75 mcal/DM net energy for lactation, 16% crude protein, 5.60% fat, 20.30% acid detergent fiber, 39.10% neutral detergent fiber, 180 g calcium, and 116 g phosphorus.
Table 1. Characterization of both experimental groups (n = 10), namely group I suffering from clinical ketosis and group II being control cows.
2.2. Sample collection and processing
All blood samples were collected from the jugular vein, stabilized in sodium heparin, and immediately centrifuged at 1400 g for 10 min at room temperature. The plasma was transferred to Eppendorf tubes (1 mL) and stored at −80 °C.
Prior to LC/MS analysis, plasma samples were thawed at room temperature. Plasma samples (100 μL) from each animal were mixed into a methanol solution (300 μL). The solution was vortexed for 30 s and then centrifuged at 16,000 g for 10 min at 4 °C. The resulting supernatant (300 μL) was transferred to Eppendorf tubes and the solution was blow-dried using liquid nitrogen. A 50% methanol solution (75 μL) was added to the sample, vortexed for 30 s, and centrifuged at 16,000 g for 15 min at 4° C. Aliquots (50 mL) of this supernatant were used to MS analysis using an Agilent 6520 Q-TOF LC/MS system (Agilent Technologies Co., LTD, San Francisco, CA, USA), a centrifuge, and a pressure blowing concentrator.
2.3. LC/MS analysis
The following HPLC conditions were used: chromatographic column (Agilent Poroshell 120 EC-C18 HPLC, 2.1 × 50 mm, 2.7 μm); mobile phase A, 0.1% formic acid aqueous solution; mobile phase B, 0.1% formic acid in an acetonitrile solution with Millipore ultrapure water; and HPLC grade acetonitrile. The gradient elution program was as follows: 0 min, 1% B; 1 min, 1% B; 6 min, 35% B; 21 min, 100% B; 24 min, 100% B; 25 min, 1% B; 30 min, 1% B. The flow rate was 0.2 mL/min. The sample injection volume was 5 μL. 50% methanol was used to wash the outer surface of the entry pin in each injection.
The mass spectrum conditions were as follows: double spray ESI ion source; drying gas temperature was 330 °C; flow rate of high-purity nitrogen was 10 L/min; pressure for the spray needle was 40 psi; capillary voltage was set at 4000 V; outer voltage of the capillary was 135 V; separator was 65 V; octopole RF peak was 750 V; real-time correction for accurate molecular weight through two standard internal references (one time per second) with the reference quality ions at 121.050873 and 922.009798 m/z. The samples were scanned with ESI + mode and the quality inspection scope was 50–1000 m/z.
2.4. Statistical analysis
Data were processed using principal component analysis (PCA) and orthogonal partial least-squares discriminant analysis (OPLS-DA). One-way analysis of variance (ANOVA) was used to analyze the clinical data and blood parameters with the statistical significance set at P < 0.05.
Multivariate statistical analysis included mainly PCA and OPLS-DA. PCA can reflect the overall metabolic differences among groups and the variability between samples within a group (Trygg et al. Citation2007). After the PCA, data were analyzed using OPLS-DA based on the results of the PCA. The OPLS-DA was also based on a unit variance scaling strategy, which can maximize the highlights of the internal model within the differences between groups. R2X, R2Y, and Q2 parameters describe the optimization of the analytic model.
3. Results
3.1. Original chromatograms
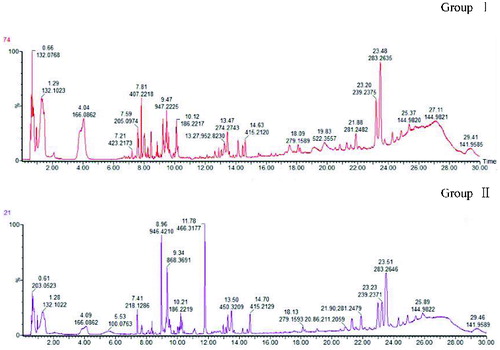
The total ion current (TIC) chromatogram was visually determined in all samples prior to the formal analysis. The results showed that the sensitivity of the mass spectrometer for all samples was within the normal range, and this was accompanied by good reproducibility of the retention times in the chromatograms. The representative TIC chromatograms of samples from each group are shown in .
Figure 1. Total ion current (TIC) chromatograms of plasma samples from two groups of dairy cows: clinical ketosis (group I) and (group II). X-axis indicates the retention time (min); Y-axis indicates the control cows’ relative abundance of the mass response.
3.2. Multivariate statistical analysis
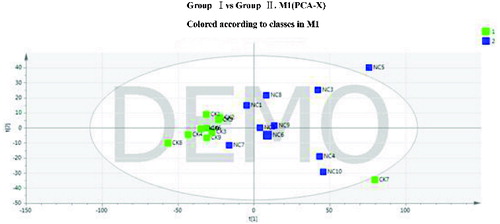
A PCA was conducted on the two groups of samples to obtain a panoramic comparison of the groups. The results showed that R2X = 0.396 and Q2 = 0.078. The PCA score plot is shown in . Two samples in groups I and II were found to be abnormal, and because they deviated from all other samples of that group, they were removed in the subsequent analyses.
Figure 2. Principal component analysis (PCA) score plot of groups I and II.
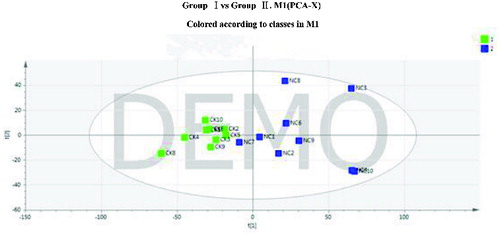
shows the PCA for the two groups of samples after the removal of the abnormal sample, with R2X = 0.385 and Q2 = 0.087. A clear separation appears between groups I and II.
Figure 3. Principal component analysis (PCA) score plot of groups I and II after the removal of outliers.
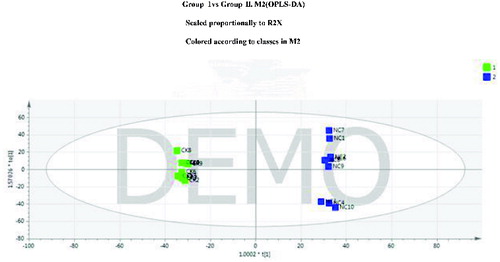
To reduce the error in the groups, eliminate the random error, and determine the representative differential metabolites, the data were analyzed using OPLS-DA after the PCA. The results showed that the OPLS-DA model may best distinguish the two groups of plasma samples. The OPLS-DA parameters R2Y and Q2 were 0.993 and 0.702 for groups I and II. The OPLS-DA score plots are shown in . The metabolic spectra for any two groups of samples were clearly separated on principal component 1 (PC1), representing differential metabolites between the two groups.
Figure 4. Orthogonal partial least-squares (OPLS) score plot of groups I and II.
3.3. Differential metabolites
As shown in , 13 differential metabolites in plasma from dairy cows with clinical ketosis were detected using the variable importance in projection (VIP) values of the OPLS-DA model and Student's t-test (P < 0.05). Compared to control cows, the levels of some metabolites increased significantly in clinical ketosis, including valine, glycine, glycocholic, tetradecenoic acid, and palmitoleic acid. At the same time, other metabolites decreased markedly, such as arginine, aminobutyric acid, leucine/isoleucine, tryptophan, creatinine, lysine, norcotinine, and undecanoic acid. These metabolites are involved mainly in gluconeogenesis, amino acid metabolism, fat metabolism, vitamin metabolism, and nerve signal transduction.
Table 2. Metabolites in dairy cows with clinical ketosis as determined with LC/MS.
4. Discussion
LC/MS has high specificity and sensitivity and is a common methodology used in metabolomics. It does not require multifarious pretreatments and is suitable for detecting complex metabolites and identifying potential biomarkers (Wilson et al. Citation2005; Yang et al. Citation2006; Wagner et al. Citation2007).
The tricarboxylic acid cycle and oxidative phosphorylation transfer energy for glucose, fat, and protein metabolism. With metabolic process inextricably linked, one metabolic disorder may lead to other metabolic obstacles. A negative energy balance (NEB) results from the rapid increase in energy required after parturition; a higher glucose consumption and a lower available supply lead to hypoglycemia (Wang et al. Citation2012). However, energy metabolism in ruminants is different from that in monogastric animals, which is mainly regulated by gluconeogenesis (van Knegsel et al. Citation2007). Dairy cows in a state of NEB need to mobilize fat and protein to alleviate their NEB. The results of our study indicated that vitamin metabolism and nervous signal transduction are abnormal in dairy cows with ketosis.
4.1. Fat metabolism
The liver is pivotal in energy metabolism through gluconeogenesis (Kuhla et al. Citation2009). Fat mobilization increases when blood glucose concentration decreases. Glycerol and fatty acids from lipolysis may become precursors to make up for the lack of glucose (Farid et al. Citation2013). In the present study, the levels of fatty acids, such as tetradecenoic acid and palmitic acid, were higher in cows suffering from clinical ketosis than in control animals. The content of bile acid increased significantly to meet the chyle. A large amount of fat was metabolized because of the low blood glucose concentration, since the concentration of free fatty acid increased and a high concentration of acetyl-CoA was generated through beta oxidation in the liver (Gaster Citation2012). However, acetyl-CoA could not enter the Krebs cycle obviously because of the decrease in oxaloacetic acid that resulted from the low glucose concentration, ultimately leading to a marked increase in ketones, such as BHBA, acetyl acetate, and acetone (Grummer & Carroll Citation1991). In addition, triglycerides may accumulate in the liver with lower levels of very-low-density lipoproteins (VLDLs) from fatty acids, which may cause a disorder in gluconeogenesis, increased lipolysis, and excessive ketones (Gonzalez & Rosendo Citation2013). Previous studies have shown that the concentration of glycocholic acid increases when the liver is damaged (Woolbright & Jaeschke Citation2012). In the present study, the high concentration of glycocholic acid in cows suffering from clinical ketosis indicated that increased fat mobilization intensified the burden on the liver. Thus, glycocholic acid may be an indicator of liver injury in dairy cows with ketosis.
4.2. Amino acid metabolism
Hypoglycemia is a key link in the pathogenesis of ketosis in dairy cows, the catabolism of fat and protein, and the promotion of gluconeogenesis to maintain the normal blood glucose level (Chacher et al. Citation2013). Pyruvic acid, α-ketoglutarate, oxaloacetic acid, succinyl-CoA, and fumaric acid are produced by glucogenic amino acids, such as arginine, valine, glycine, and isoleucine, and then further processed into phosphoenolpyruvate to synthesize glucose through the gluconeogenesis pathway (Lapierre et al. Citation2012). When glucose and oxaloacetic acid are lacking, marked levels of acetoacetyl CoA are generated from ketogenic amino acids, such as leucine and lysine, through oxidative decarboxylation of pyruvic acid and converted into ketones in the liver (Gerich et al. Citation2001). Amino acids that are both glucogenic and ketogenic, such as tryptophan and isoleucine, may participate in several metabolic pathways to make up the shortage of blood glucose or to synthesize ketones (Pan et al. Citation2013). The results of the present study indicated that the levels of isoleucine/leucine were decreased in the group of cows with clinical ketosis compared to those in the control group. Further study will be required to elucidate the mechanism for the difference in the levels of these amino acids in clinical ketosis.
4.3. Additional abnormal metabolism
Glucose, fat, and protein are closely associated with ketosis. However, some nervous system signals generated via metabolites like nicotine, tryptophan, and arginine may also play a role in the development of ketosis. A messenger generated by tryptophan that can produce pleasurable emotions and affects nearly all brain activity is 5-hydroxytryptamine (Chen & Miller Citation2012). Previous studies have shown that low levels of 5-hydroxytryptamine can lead to depression (Hale et al. Citation2011). The results from the present study indicated that nicotine and tryptophan were significantly lower in the group of dairy cows with clinical ketosis compared with those in controls, and these decreases may be related to the inappetence and depression observed in ketosis. However, it is unclear what roles they may play in the development of ketosis.
5. Conclusions
The metabolic patterns in the plasma of dairy cows with clinical ketosis were established using LC/MS. We found 13 potential metabolic markers for plasma ketosis. Our study confirmed that metabolomics technology is a powerful tool to reveal the metabolic processes of ketosis. Our results will help to better understand the pathogenesis of ketosis in the dairy cow, lay the foundation for further assessment of the disease, and provide new disease prevention strategies for the future.
Funding
This study was supported by the China Natural Foundation Council Project [grant number 31072181]; the Chinese National Science and Technology Project [grant number 2013BAD21B01-2], [grant number 2012BAD12B05-2], [grant number 2012BAD12B03-2]; the Innovation Research Projects of Graduate Students in Heilongjiang Bayi Agricultural University [Y31].
References
- Al-Rawashdeh OF. 1999. Prevalence of ketonemia and associations with herd size, lactation stage, parity and postparturient diseases in Jordanian dairy cattle. Prev Vet Med. 40:117–125.
- Chacher B, Liu H, Wang D, Liu J. 2013. Potential role of N-carbamoyl glutamate in biosynthesis of arginine and its significance in production of ruminant animals. J Anim Sci Biotechnol. 4:16.
- Chen F, Xue J, Zhou L, Wu S, Chen Z. 2011. Identification of serum biomarkers of hepatocarcinoma through liquid chromatography/mass spectrometry-based metabonomic method. Anal Bioanal Chem. 401:1899–1904.
- Chen GL, Miller GM. 2012. Advances in tryptophan hydroxylase-2 gene expression regulation: new insights into serotonin-stress interaction and clinical implications. Am J Med Genet B Neuropsychiatr Genet. 159B:152–171.
- Cote JF, Curtis RA, McSherry BJ, Robertson JM, Kronfeld DS. 1969. Bovine ketosis: frequency of clinical signs, complications and alterations in blood ketones, glucose and free fatty acids. Can Vet J. 10:179–187.
- Farid AS, Honkawa K, Fath EM, Nonaka N, Horii Y. 2013. Serum paraoxonase-1 as biomarker for improved diagnosis of fatty liver in dairy cows. BMC Vet Res. 9:73.
- Forslund KB, Ljungvall OA, Jones BV. 2010. Low cortisol levels in blood from dairy cows with ketosis: a field study. Acta Vet Scand. 52:31.
- Gaster M. 2012. A primary reduced TCA flux governs substrate oxidation in T2D skeletal muscle. Curr Diabetes Rev. 8:458–479.
- Gerich JE, Meyer C, Woerle HJ, Stumvoll M. 2001. Renal gluconeogenesis: its importance in human glucose homeostasis. Diabetes Care. 24:382–391.
- Gonzalez CI, Rosendo O. 2013. Assessment of fatty liver syndrome and its predisposing factors in a dairy herd from Venezuela. ISRN Vet Sci. 2013:191708.
- Grummer RR, Carroll DJ. 1991. Effects of dietary fat on metabolic disorders and reproductive performance of dairy. J Anim Sci. 69:3838–3852.
- Hale MW, Shekhar A, Lowry CA. 2011. Development by environment interactions controlling tryptophan hydroxylase expression. J Chem Neuroanat. 41:219–226.
- Kuhla B, Albrecht D, Kuhla S, Metges CC. 2009. Proteome analysis of fatty liver in feed-deprived dairy cows reveals interaction of fuel sensing, calcium, fatty acid, and glycogen metabolism. Physiol Genomics. 37:88–98.
- Lapierre H, Lobley GE, Doepel L, Raggio G, Rulquin H, Lemosquet S. 2012. Triennial lactation symposium: mammary metabolism of amino acids in dairy cows. J Anim Sci. 90:1708–2171.
- Li Y, Su Z, Lin S, Li C, Ya Zhao, Gao X, Lai Y, Wu X, Wu H, Cai Z. 2014. Characterisation of the metabolism of pogostone in vitro and in vivo using liquid chromatography with mass spectrometry. Phytochem Anal. 25:97–105.
- Miettinen PV. 1995. Prevention of bovine ketosis with glucogenic substance and its effect on fertility in Finnish dairy cows. Berl Munch Tierarztl Wochenschr. 108:14–19.
- Nicholson JK, Lindon JC, Holmes E. 1999. Metabonomics: understanding the metabolic responses of living systems to pathophysiological stimuli via multivariate statistical analysis of biological NMR spectroscopic date. Xenobiotica. 29:1181–1189.
- Oetzel GR. 2004. Monitoring and testing dairy herds for metabolic disease. Vet Clin North Am Food Anim Pract. 20:651–674.
- Oresic M, Vidal-Puig A, Hänninen V. 2006. Metabolomic approaches to phenotype characterization and applications to complex diseases. Expert Rev Mol Diagn. 6:575–585.
- Padilla L, Shibano K, Inoue J, Matsui T, Yano H. 2005. Plasma vitamin C concentration is not related to the incidence of ketosis in dairy cows during the early lactation period. J Vet Med Sci. 67:883–886.
- Pan YH, Zhang Y, Cui J, Liu Y, McAllan BM, Liao CC, Zhang S. 2013. Adaptation of phenylalanine and tyrosine catabolic pathway to hibernation in bats. PLoS One. 8:e62039.
- Schneider H, Ma L, Glatt H. 2003. Extractionless method for the determination of urinary caffeine metabolites using high-performance liquid chromatography coupled with tandem mass spectrometry. J Chromatogr B Analyt Technol Biomed Life Sci. 789:227–237.
- Steen A. 2001. Field study of dairy cows with reduced appetite in early lactation: clinical examinations, blood and rumen fluid analyses. Acta Vet Scand. 42:219–228.
- Trygg J, Holmes E, Lundstedt T. 2007. Chemometrics in metabolomics. J Proteome Res. 6:469–479.
- Van Knegsel AT, van den Brand H, Dijkstra J, Kemp B. 2007. Effects of dietary energy source on energy balance, metabolites and reproduction variables in dairy cows in early lactation. Theriogenology. 68:S274–S280.
- Wagner S, Scholz K, Sieber M, Kellert M, Voelkel W. 2007. Tool in metabonomics: an integrated validation approach for LC-MS metabolic profiling of mercapturic acids in human urine. Anal Chem. 79:2918–2926.
- Wang X, Li X, Zhao C, Hu P, Chen H, Liu Z, Liu G, Wang Z. 2012. Correlation between composition of the bacterial community and concentration of volatile fatty acids in the rumen during the transition period and ketosis in dairy cows. Appl Environ Microbiol. 78:2386–2392.
- Wilson ID, Plumb R, Granger J, Major H, Williams R, Lenz EM. 2005. HPLC-MS-based methods for the study of metabonomics. J Chromatogr B Analyt Technol Biomed Life Sci. 817:67–76.
- Woolbright BL, Jaeschke H. 2012. Novel insight into mechanisms of cholestatic liver injury. World J Gastroenterol. 18:4985–4993.
- Yang J, Zhao X, Liu X, Wang C, Gao P, Wang J, Li L, Gu J, Yang S, Xu G. 2006. High performance liquid chromatography-mass spectrometry for metabonomics: potential biomarkers for acute deterioration of liver function in chronic hepatitis B. J Proteome Res. 5:554–561.
- Yang N, Feng S, Shedden K, Xie X, Liu Y, Rosser CJ, Lubman DM, Goodison S. 2011. Urinary glycoprotein biomarker discovery for bladder cancer detection using LC-MS/MS and label-free quantification. Clin Cancer Res. 17:3349–3359.
- Zhang A, Sun H, Han Y, Yan G, Wang X. 2013. Urinary metabolic biomarker and pathway study of hepatitis B virus infected patients based on UPLC-MS system. PLOS One. 8:e64381.