
Abstract
Presynaptic Ca2+ appears to play multiple roles in synaptic development and physiology. We examined the effect of buffering presynaptic Ca2+ by expressing parvalbumin (PV) in Drosophila neurons, which do not normally express PV. The studies were performed on the identified Ib terminal that innervates muscle fiber 5. The volume-averaged, residual Ca2+ resulting from single action potentials (APs) and AP trains was measured using the fluorescent Ca2+ indicator, OGB-1. PV reduced the amplitude and decay time constant (τ) for single-AP Ca2+ transients. For AP trains, there was a reduction in the rate of rise and decay of [Ca2+]i but the plateau [Ca2+]i was not affected. Electrophysiological recordings from muscle fiber 5 showed a reduction in paired-pulse facilitation, particularly the F1 component; this was likely due to the reduction in residual Ca2+. These synapses also showed reduced synaptic enhancement during AP trains, presumably due to less buildup of synaptic facilitation. The transmitter release for single APs was increased for the PV-expressing terminals and this may have been a homeostatic response to the decrease in facilitation. Confocal microscopy was used to examine the structure of the motor terminals and PV expression resulted in smaller motor terminals with fewer synaptic boutons and active zones. This result supports earlier proposals that increased AP activity promotes motor terminal growth through increases in presynaptic [Ca2+]i.
Introduction
Intracellular Ca2+ appears to play many roles at the presynaptic terminal. Ca2+ entering through voltage-dependent Ca2+ channels during an action potential (AP) produces a local, transient, and large increase in [Ca2+]i required for the exocytosis of neurotransmitter (Zucker, Citation1996). Ca2+ subsequently equilibrates in the terminal and this residual Ca2+ plays a role in short-term synaptic plasticity. Residual Ca2+ has been shown to be correlated with forms of synaptic enhancement including facilitation, augmentation and post-tetanic potentiation (PTP) at a variety of vertebrate and invertebrate synapses (Jackman & Regehr, Citation2017; Zucker & Regehr, Citation2002). In addition, increases in presynaptic [Ca2+]i produced by impulse activity have been proposed to play a role in the growth of synaptic terminals during development (Zhong, Budnik, & Wu, Citation1992) and Ca2+ oscillations appear to be involved in pruning of synaptic terminals (Vonhoff & Keshishian, Citation2017).
Differences in the regulation of [Ca2+]i likely play an important role in the differentiation of neuronal structure and function. Ca2+ entering the presynaptic terminal during an AP is bound by fast Ca2+ buffers so that typically less than 5% remains free (Neher, Citation1995); Ca2+ is subsequently cleared by slow Ca2+ buffers, uptake by intracellular organelles, and extrusion by the Na/Ca exchanger and/or the plasma membrane Ca2+ ATPase (PMCA) (Lnenicka, Grizzaffi, Lee, & Rumpal, Citation2006; Morgans, El, Berntson, Wassle, & Taylor, Citation1998; Mulkey & Zucker, Citation1992; Reuter & Porzig, Citation1995; Sanyal et al., Citation2005; Scotti, Chatton, & Reuter, Citation1999). Differences in the expression of Ca2+-buffering proteins are likely to play an important role in the differentiation of [Ca2+]i regulation. The expression of Ca2+-buffering proteins in the mammalian central nervous system is broad, distinctive, and dependent on the developmental stage; they are localized to well-defined subpopulations of neurons either alone or in combination (Andressen, Blümcke, & Celio, Citation1993; Bastianelli, Citation2003; DeFelipe, Citation1997; Hof et al., Citation1999; Jande, Maler, & Lawson, Citation1981; Rogers, Citation1989). The best characterized Ca2+-buffering proteins include calbindin, calretinin, and parvalbumin (PV); they have been classified as Ca2+-buffering proteins since they have multiple Ca2+-binding sites and no apparent direct roles in cell signaling (Baimbridge, Celio, & Rogers, Citation1992; Schwaller, Meyer, & Schiffmann, Citation2002). These Ca2+ buffers all have a high affinity for Ca2+ (Kd in the nanomolar range), but differ in their Ca2+ binding rates; calbindin and calretinin are considered fast buffers and PV a slow buffer (Lee, Schwaller, & Neher, Citation2000; Nagerl, Novo, Mody, & Vergara, Citation2000).
The physiological effects of PV have been studied in the mouse CNS by knocking out PV expression. Elimination of PV slowed the decay of residual Ca2+ produced by a single AP or short train of APs in the mouse CNS (Collin et al., Citation2005; Muller, Felmy, Schwaller, & Schneggenburger, Citation2007). A range of effects on paired-pulse facilitation (PPF) have been reported after knocking out PV including no change in PPF, an increase in PPF amplitude and no effect on PPF amplitude but a slower decay (Caillard et al., Citation2000; Muller et al., Citation2007; Vreugdenhil, Jefferys, Celio, & Schwaller, Citation2003).
We examined the influence of the slow Ca2+-buffer PV on synaptic development and physiology at an identified neuromuscular junction (NMJ) in Drosophila larvae. PV, which is normally not found in Drosophila, was expressed pan-neuronally and we examined the physiology and structure of an identified motor terminal innervating larval muscle fiber 5 (MF5). We used MF5 since it is innervated by only a single Ib motor neuron (Hoang & Chiba, Citation2001). The more commonly studied larval muscle fibers produce compound EPSPs due to simultaneous activation of Is and Ib terminals; this would complicate measurements of facilitation since the Ib synapses show facilitation and the Is synapses show depression (Lnenicka & Keshishian, Citation2000). Also, the motor terminal on MF5 is relatively small making it easier to perform morphological measurements. The effects of PV on the volume-averaged residual Ca2+ were examined using the fluorescent Ca2+ indicator Oregon Green 488 BAPTA-1 (OGB-1). Transmitter release and synaptic facilitation were examined by recording synaptic potentials from the muscle fibers. Confocal microscopy and immunostaining were used to examine the structure of the motor terminal. We found that PV expression produced a range of effects including a reduction in residual Ca2+, facilitation, and terminal growth. In addition, there was an increase in transmitter release, which may have developed to compensate for the reduction in synaptic facilitation.
Methods
Drosophila larvae
All experiments were performed at 20 °C on wandering third-instar female larvae. Larvae were pinned out in a physiology chamber and after an incision through the dorsal body wall, the internal organs were removed to expose the body-wall muscles. The segmental nerves were cut and the brain was removed. To express PV in the nervous system, flies containing two UAS-PV transgenes on each second and third chromosome (Harrisingh, Wu, Lnenicka, & Nitabach, Citation2007) were crossed to flies with the pan-neuronal driver elavC155–GAL4 (Lin & Goodman, Citation1994) obtained from the Bloomington Drosophila Stock Center, Bloomington, IN (stock #458).
Both of these parental lines were generated in a w1118 background. Control experiments were performed on Canton S (CS) and UAS-PV larvae. We have previously examined the synaptic properties of the MF5 NMJ and found different neuromuscular synaptic properties in male and female larvae so only female larvae were used in this study (Lnenicka, Theriault, & Monroe, Citation2006).
Immunohistochemistry
The UAS-PV transgene contained a Myc epitope tag (Harrisingh et al., Citation2007) and the expression of the PV protein was detected using an antibody to Myc (mouse monoclonal, 1:50, Santa Cruz, Santa Cruz, CA). The terminals were immunostained using Goat anti-horseradish peroxidase (HRP; 1:200; Cappel, Solon, OH) in order to calculate the number and the size of boutons (Jan & Jan, Citation1982). A monoclonal antibody nc82 (1:100; Developmental Studies Hybridoma Bank, Iowa City, IA), which recognizes the active zone component Bruchpilot (Wagh et al., Citation2006), was used to label the active zones. Procedures for immunostaining were previously described (He, Singh, Rumpal, & Lnenicka, Citation2009). In brief, third-instar larvae were dissected and fixed in 4% formaldehyde for an hour. The fixed larvae were incubated overnight (4 °C) in primary antibody (anti-Myc, anti-HRP or nc82) followed by corresponding secondary antibody (Alexa Flour 488 goat anti-mouse IgG for anti-Myc; Alexa Fluor 546 rabbit anti-goat IgG for HRP and Alexa Fluor goat anti-mouse IgG for nc82; all 1:200; Invitrogen, Carlsbad, CA) for 5 h at room temperature. Preparations were mounted in SlowFade gold antifade reagent (Invitrogen) and viewed under a Zeiss LSM 510 confocal microscope with a Zeiss 63×, 1.4NA objective (Carl Zeiss, Jena, Germany). Alexa Fluor 488 was imaged using a 488 laser with a BP 505–530 emission filter and Alexa Fluor 546 with a 543 laser and a LP 560 emission filter.
For morphological measurements, stacks of slices were acquired from MF5 in segments 3 and 4. These images were then analyzed using Zeiss LSM Image Browser (Carl Zeiss) in order to count the boutons, determine bouton size, and count active zones. After measuring the bouton width and length, bouton volume, and surface area were estimated as in a previous study (He et al., Citation2009). To count active zones, the number of spots recognized by nc82 per bouton was counted, assuming that each spot represented one active zone; when an active zone spanned more than one slice it was counted only once. For the length of terminals, the measurements began at the first branch point where the terminals left the axon. The number of branches was determined by counting all segments arising from each branch point.
Electrophysiology
All experiments were performed in HL3 saline containing 1.0 mM Ca2+ (Stewart, Atwood, Renger, Wang, & Wu, Citation1994). The motor axons were electrically stimulated in segments 3 or 4 by sucking up the cut end of the segmental nerve with a suction electrode (approximately 10 µm inside diameter). EPSPs from MF5 were recorded using sharp microelectrodes filled with 3 M KCl (20–30 MΩ) and connected to a preamplifier (Axoclamp 2A; Axon Instruments Inc., Foster City, CA). Data were acquired (sampling rate 5 KHz) and analyzed using a Digidata 1322A (Axon Instruments Inc.) interface and pCLAMP 10.2 (Axon Instruments Inc.) software. We have previously noted that the membrane resistance for MF5 decreased by about 25% during prolonged electrode penetrations (Powers, Grizzaffi, Ribchester, & Lnenicka, Citation2016). We assumed that this occurred during our recordings in this study; however, it should have affected the experimental and control fibers equally.
We studied PPF using a range of inter-stimulus intervals (ISIs). For very short ISIs such as 10 ms, the amplitudes of the peaks were measured from the projected tail of the proceeding EPSPs. The PPF was analyzed based upon early studies of neuromuscular facilitation (Bittner & Sewell, Citation1976; Mallart & Martin, Citation1967). The facilitation was determined by calculating the ratio of the change in EPSP amplitude over that obtained with the conditioning stimulus, that is (EPSP2nd – EPSP1st)/EPSP1st. To examine the components of facilitation, facilitation values were fit to a single exponential decay using a least-squares regression for ISIs ≤50 ms (F1) and ≥200 ms (F2). To examine synaptic enhancement during AP trains, stimulation at 0.5 Hz for 40 s was used to establish the pre-train EPSP level, followed by a 10 s, 20 Hz train and then post-train EPSPs were recorded at 0.5 Hz stimulation for 20 s beginning 1 s after the train. The synaptic enhancement for the train and post-train was calculated as 100 * (EPSP amplitude − pre-train EPSP amplitude)/pre-train EPSP amplitude. Spontaneous miniature EPSPs (mEPSPs) were recorded in the absence of nerve stimulation and they were measured using MiniAnalysis (Synaptosoft, Inc. Decatur, GA, USA).
Ca2+ imaging
All experiments were performed on terminals innervating MF5 in segment 3 of wandering third-instar larvae in HL3 with 1 mM Ca2+ or HL3.1 with 1.5 mM Ca2+, both contained 7 mM glutamate to prevent contraction (Feng, Ueda, & Wu, Citation2004; Stewart et al., Citation1994). The terminals were loaded with OGB-1 coupled to 10,000 MW dextrans (Invitrogen) (Macleod, Hegstrom-Wojtowicz, Charlton, & Atwood, Citation2002). Terminals were imaged using an upright, fixed-stage BH2 microscope (Olympus Optical, Tokyo, Japan) equipped with epifluorescence, DIC, a water-immersion 40× Zeiss (Thornwood, NY) lens (NA 0.75) and a cooled-CCD camera (CoolSNAP HQ, Photometrics, Tuscon, AZ) or a scientific CMOS camera (PCO.edge, PCO-TECH Inc. Romulus, MI). The technique for image acquisition and OGB-1 excitation during stimulation has been previously described (Lnenicka, Grizzaffi, et al., Citation2006). Images were streamed at 50 or 500 Hz for single APs and 20 Hz for AP trains. The percentage change in fluorescence (ΔF) was calculated as 100 * (fluorescence − resting fluorescence)/resting fluorescence.
Sigmaplot 12.5 Systat software, Inc. San Jose, CA, USA was used for data transformation and statistical analyses. The n value represents (number of muscle fibers, number of animals), all statistical tests were performed using the muscle fiber values and averages were expressed as mean ± SE.
Results
Parvalbumin (PV) expression reduces PPF and synaptic enhancement during AP trains
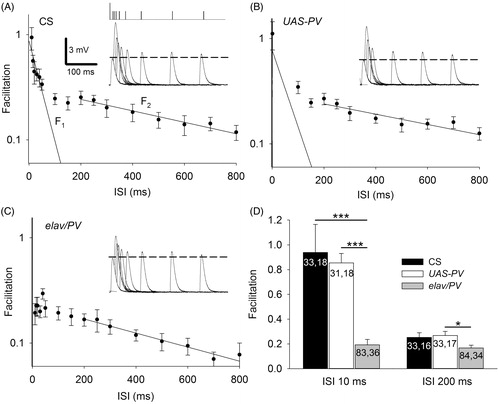
To examine the effect of PV on the development and function of synapses, we studied larvae (elav/PV) in which PV was expressed pan-neuronally. Immunohistochemistry revealed expression of PV in motor terminals () as well as in peripheral axons and the brain (not shown) of elav/PV larvae but not in the UAS-PV or CS, which served as controls. We compared PPF among the PV-expressing and control larvae. An early study of PPF at the frog neuromuscular junction found that the decay of PPF could be separated into two components (Mallart & Martin, Citation1967), an early component of facilitation with rapid decay (F1) and a later component of facilitation with slower decay (F2). The control synapses clearly showed these two components of facilitation (). A single exponential decay was fit to points less ≤50 ms to give the amplitude (y intercept) and decay time constant (τ) for F1. For F2, the maximum amplitude was assumed to occur at the hump in the decay curve as in previous studies (Bittner & Sewell, Citation1976; Charlton & Bittner, Citation1978; Mallart & Martin, Citation1967), which occurred at about 200 ms and the exponential decay was fit to ISIs ≥200 ms. For both F1 and F2, the amplitude and decay time constants were similar for CS and UAS-PV. The PV-expressing terminals showed considerably less facilitation than the controls (). F1 was greatly reduced and it was not possible to fit a regression describing its decay; F2 showed a reduced amplitude and decay τ compared to the controls. To further examine the effects of PV on F1 and F2, we compared facilitation at 10 ms ISIs where F1 predominates and at 200 ms ISIs where F2 appears to reach its maximum (). The facilitation for elav/PV larvae was reduced at both the 10 ms ISI and the 200 ms ISI.
Figure 1. Anti-Myc immunohistochemistry revealed expression of PV at the motor terminal (arrow) innervating muscle fiber 5. This single-plane confocal image passes through the central region of the muscle in segment 3. Calibration: 10 µm.
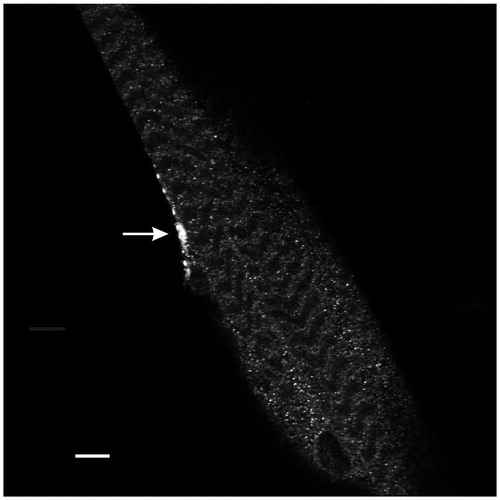
Figure 2. Expression of PV produced a reduction in PPF at the Drosophila NMJ. (A) A semi-log graph of facilitation versus the interpulse interval (ISI). The decay of PPF in CS larvae showed F1 and F2 components of facilitation. A single exponential decay was fit to the data using least-squares regression: F1 = 0.9, decay τ = 46 ms, r2 = 0.66; F2 = 0.3, decay τ = 798 ms, r2 = 0.96. Insert: The first EPSP and superimposed second EPSPs delivered at various ISIs. The vertical ticks at the top show the timing of the first stimulation (large tick) and the second stimulation (small ticks). The broken line shows the amplitude of the first EPSP. (B) PPF in UAS-PV larvae appeared similar to CS. F1 = 0.8, decay τ = 60 ms, r2 = 0.50 and F2 = 0.3, decay τ = 890 ms, r2 = 0.82. (C) For elav/PV larvae, the F1 component of facilitation was nearly absent and could not be fitted by an exponential decay; F2 was reduced. F2 = 0.23, decay τ = 619 ms, r2 = 0.96. (D) The elav/PV facilitation was less than controls at an ISI of 10 ms and an ISI of 200 ms. elav/PV values were compared to CS and UAS-PV values using a one-way ANOVA with a post hoc Bonferroni t-test; *p < .05; ***p < .001.
The amplitude of the first EPSP was larger for elav/PV larvae than for the control larvae and this could have been responsible for reduced facilitation seen at those synapses. It has been observed at the larval NMJ that greater facilitation can be produced at a synapse by lowering external [Ca2+] to reduce transmitter release (e.g. Mallart, Citation1993). A larger initial transmitter release might reduce facilitation by saturating the transmitter release process or through the depletion of synaptic vesicles. To examine this, we systematically eliminated experiments with the largest first EPSP amplitudes from elav/PV so its mean was reduced from 3.46 ± 0.20 mV (83, 36) to 2.50 ± 0.11 mV (58, 26) and it was now the same as UAS-PV (2.50 ± 0.30 mV; 31, 18). The facilitation at 10 ms ISIs for this elav/PV subpopulation (0.26 ± 0.06) was still significantly less than for UAS-PV (0.89 ± 0.10; p < .001, t-test).
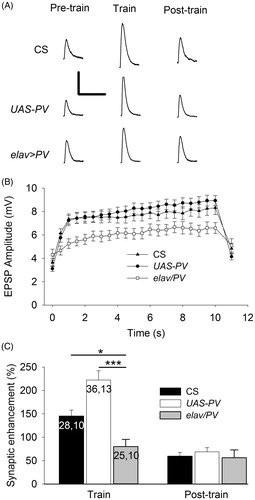
We also examined the effect of PV on the synaptic enhancement seen during 20 Hz stimulation for 10 s (). During the train, EPSP amplitude increased more slowly for PV-expressing synapses and the EPSP amplitude at the end of the train was smaller than for controls (). The increase in EPSP amplitude seen during the final second of the train was compared for elav/PV larvae and control larvae (). The PV-expressing larvae showed significantly less synaptic enhancement than either of the controls. For unknown reasons, the UAS-PV synapses showed greater synaptic enhancement than the CS synapses. The post-train synaptic enhancement seen between 1 and 40 s after the train was also examined; this should represent a combination of augmentation and PTP since facilitation should be almost gone by 1 s, whereas the decay time constants for augmentation and PTP are 5–10 and 30 s to several minutes, respectively (Magleby & Zengel, Citation1976; Zengel, Magleby, Horn, McAfee, & Yarowsky, Citation1980). PV expression had no effect on augmentation or PTP since there was no difference among the 3 classes of larvae for the post-train values.
Figure 3. PV-expressing terminals showed less synaptic enhancement during trains of APs delivered at 20 Hz. (A) Representative EPSPs from CS, UAS-PV and elav/PV larvae. Pre-train EPSPs were recorded before the train; Train EPSPs were recorded during the end of the train; and Post-train EPSPs were recorded beginning 1 s after the train. Calibration: 4 mV, 100 ms. (B) EPSP amplitudes were plotted to show the synaptic enhancement during a train. The pre-train EPSP amplitude is shown at 0 s and this was followed by 20 Hz stimulation for 10 s with each value (0.5–10 s) representing the average of 10 EPSPs. The post-train value at 11 s is the average of 20 EPSPs recorded during 0.5 Hz stimulation beginning 1 s after the train. (C) The synaptic enhancement was compared for EPSPs recorded during and after the train. The synaptic enhancement seen during the Train was the percent increase in EPSP amplitude for the final 20 EPSPs; the Post-train synaptic enhancement was determined for the 10 EPSPs recorded after the train. Values for CS and UAS-PV larvae were compared to elav/PV larvae (one-way ANOVA with post hoc Bonferroni t-test; *p < .05, *p < .001). The n values for B are the same as those in C.
PV expression results in an increase in transmitter release
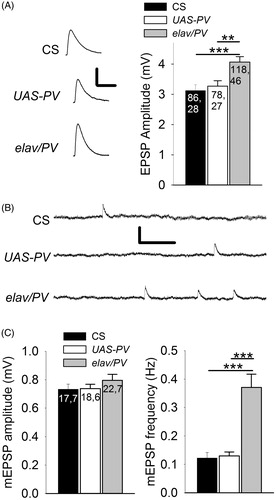
A consistent observation in the above studies was that the baseline EPSP amplitude was greater for the PV-expressing terminals compared to control ones (). We examined this by combining all measurements of the first EPSP in the PPF experiments and the pre-train EPSPs and we found that the EPSPs from the PV-expressing terminals were significantly greater than those from the controls (). To determine whether the increase in EPSP amplitude was due to an increase in transmitter release, we compared the amplitude of miniature EPSPs (mEPSPs). Spontaneous mEPSPs were recorded from each muscle fiber for about 10 min and their amplitudes were averaged (). It was found that there was no significant difference in mEPSP amplitudes between the PV-expressing synapses and controls; thus, single APs released more transmitter from PV-expressing terminals compared to controls. We estimated that the elav/PV terminals released on average 5.1 quanta compared to 4.2 for CS and 4.4 for UAS-PV. In addition, the mEPSP frequency was approximately threefold greater for the elav/PV synapses compared to the control synapses ().
Figure 4. PV-expressing terminals showed greater transmitter release for single APs than the controls. (A) Left: Representative EPSPs produced during 0.5 Hz stimulation. Calibration: 2 mV, 50 ms. Right: EPSP amplitudes for PV-expressing synapses (elav/PV) was significantly greater than those in CS and UAS-PV. (B) Representative mEPSPs recorded from a muscle fiber for each of the three populations. Calibration: 0.75 mV, 0.5 s. (C) Left: There was no significant difference in the mEPSP amplitudes between elav/PV and the controls (p > .10). Right: The mEPSP frequency was significantly greater for PV-expressing synapses compared to UAS-PV and CS. elav/PV was compared to CS and UAS-PV using a one-way ANOVA with a post hoc Bonferroni t-test; **p < .01, ***p < .001.
Effect of PV expression on motor terminal morphology
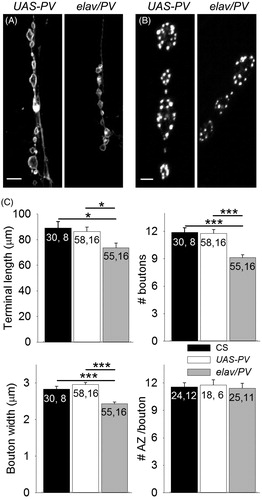
We examined whether buffering presynaptic Ca2+ affected the development of motor terminal structure. Previous studies have suggested that reducing presynaptic [Ca2+]i might reduce motor terminal growth (Zhong et al., Citation1992). Conversely, the increase in transmitter release we observed for elav/PV larvae could be explained by larger motor terminals. We first examined the terminal length as well as the number and size of the boutons. Using confocal microscopy, we measured the length of terminal contacting the muscle fiber and then we counted the number of boutons along the terminal and measured all the bouton widths (). The length of the elav/PV terminals was about 15% less than for the control CS and UAS-PV terminals () although the number of terminal branches among the groups was not significantly different (data not shown). The number of boutons per terminal was about 25% less for PV-expressing terminals compared to the controls (). In addition, the boutons along the PV-expressing terminals were smaller than for control terminals; the width of PV-positive boutons was about 15–20% less than the control boutons (). Our calculations of bouton volume and surface area estimated that the bouton volume was approximately 34% less for PV-positive boutons and the surface area was approximately 24% less compared to UAS-PV boutons. In spite of the smaller bouton size, the PV-expressing terminals and controls had a similar number of active zones per bouton (). Thus, PV expression resulted in shorter terminals with fewer and smaller synaptic boutons. Based upon the number of boutons per terminal and the number of active zones per bouton, the PV-expressing terminals had about 25% fewer total active zones than the controls.
Figure 5. Expression of PV reduced terminal size. (A) Images of muscle fiber 5 motor terminals from UAS-PV and elav/PV larvae visualized with anti-HRP staining. Calibration: 10 µm. (B) Active zones were identified in synaptic boutons using anti-Bruchpilot staining. Calibration: 2 µm. (C) Morphological features of the terminals were compared including terminal length, number of boutons per terminal, bouton width, and the number of active zones (AZ) per bouton. elav/PV was compared to UAS-PV and CS using a one-way ANOVA with a post hoc Bonferroni t-test; *p < .05; ***p < .001.
PV expression affects presynaptic Ca2+ transients
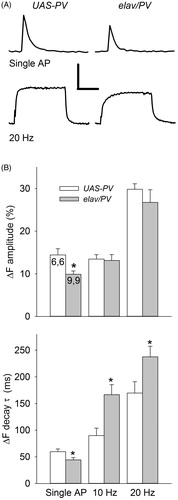
The effect of PV expression on synaptic morphology and physiology is presumably due to changes in Ca2+ buffering and the resultant Ca2+ signal. We previously showed an effect of PV expression on Ca2+ transients in Ib terminals found on muscle fiber 6 (Harrisingh et al., Citation2007). We examined MF5 to confirm that the Ca2+ transients in these Ib terminals were also affected by PV expression. Ca2+ transients were measured during single APs and AP trains in synaptic boutons from elav/PV and UAS-PV larvae using the same saline as in the synaptic physiology studies. Since the concentration of OGB-1 in these terminals can have an effect on the Ca2+ transients (He & Lnenicka, Citation2011), we matched the [OGB-1] in the elav/PV and UAS-PV terminals. This was accomplished by selecting terminals that had similar values of resting OGB-1 fluorescence/bouton width (arbitrary units/µm): elav/PV- 15.1 ± 2.1, n = 9, 9; UAS-PV- 16.2 ± 2.9, n = 6, 6; p > 0.1, t-test. In these experiments, we used a 50 Hz frame frequency to measure the ΔF produced by single APs and 20 Hz rate for AP trains (). For single APs, we found that PV expression produced a 29% decrease in the amplitude of the ΔF and a 26% decrease in its decay τ (). For 5 s trains of APs delivered at 10 and 20 Hz, we measured the amplitude of the ΔF at the plateau and the decay τ at the end of the train (). For both 10 and 20 Hz stimulation, the amplitude of the Ca2+ transient was not significantly different between elav/PV and UAS-PV terminals; however, the decay τ was significantly greater for elav/PV terminals compared to UAS-PV terminals for both 10 and 20 Hz trains (). Also for both 10 and 20 Hz trains, the rate of increase in the ΔF at the beginning of the train was noticeably slower in elav/PV terminals compared to UAS-PV terminals ().
Figure 6. Comparison of the Ca2+ transients produced by single APs and AP trains for elav/PV and UAS-PV boutons. (A) Typical Ca2+ transients for single APs and AP trains seen at these two types of boutons. Calibration: Top: 10% ΔF, 0.2 s; Bottom: 20% ΔF, 2 s. (B) Top: The amplitude of the ΔF was measured at the peak for single APs and at the plateau for AP trains. The Ca2+ transient amplitude for single APs was smaller in elav/PV boutons compared to UAS-PV ones; however, there was no difference in the Ca2+ transient plateau during AP trains for these two groups. Bottom: The ΔF decay τ for elav/PV boutons was smaller for single APs and larger for AP trains compared to UAS-PV boutons. A total of 52 boutons were examined for elav/PV and 48 boutons for UAS-PV. Values for elav/PV compared to UAS-PV using a t-test (*p < .05).
The differences in Ca2+ transients for PV-expressing terminals and control ones could have been influenced by differences in bouton size since we previously found that smaller boutons had a larger Ca2+ transient amplitude for single APs and a shorter decay τ for single APs and AP trains (Lnenicka, Grizzaffi, et al., Citation2006). Consistent with our morphological measurements (), we also found that the bouton width for elav/PV terminals (2.7 ± 0.1 μm) was significantly smaller than for USA-PV terminals (3.2 ± 0.2 μm; p < .05, t-test) in our Ca2+-imaging studies. Since elav/PV boutons were smaller, bouton size could not have been responsible for their smaller Ca2+ transient amplitude; however the difference in bouton size could have contributed to their more rapid Ca2+ transient decay. Nonetheless, it is unlikely to be completely responsible since we observed a 26% reduction in the decay τ and only a 7% reduction was predicted based upon previous results (Lnenicka, Grizzaffi, et al., Citation2006).
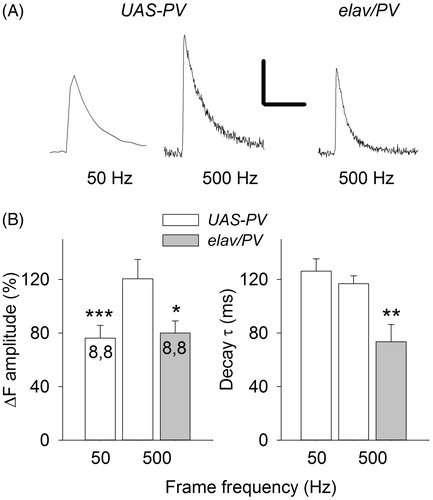
The smaller amplitude of the single-AP Ca2+ transient seen in elav/PV boutons could be due to a low frame frequency. If our sampling rate rounds off the peak, then the faster [Ca2+]i decay for elav/PV boutons may have reduced our measured peak. To check for this, images were acquired at higher rates by using a faster camera and HL3.1 saline with 1.5 mM Ca2+ (. This saline was used because it produces a larger Ca2+ signal (He & Lnenicka, Citation2011) allowing for shorter exposure times. When single- AP Ca2+ transients were measured at 50 Hz frame frequencies, the amplitude was fivefold greater and the decay τ was twice as long in this saline compared to the previous saline (compare and ). Increasing the frame frequency from 50 to 500 Hz resulted in about a 60% increase in the peak amplitude and no effect on the decay τ (). When we compared elav/PV and UAS-PV boutons at 500 Hz frame frequencies, we still saw a significantly smaller Ca2+ transient amplitude and decay τ for elav/ PV boutons compared to UAS-PV boutons (). We also examined a few AP trains at the 500 Hz sampling rate and Ca2+ spikes could now be observed during the train plateau; however, they appeared similar in amplitude for elav/PV and UAS-PV boutons, presumably because the PV was saturated during the train plateau.
Figure 7. The effect of frame frequency on measurements of single-AP Ca2+ transients. (A) Single-AP Ca2+ transients measured at frame frequency rates of 50 and 500 Hz for a UAS-PV bouton and at 500 Hz for an elav/PV bouton. Calibration: 40% ΔF. 0.2 s, (B) Single-AP Ca2+ transient amplitudes and decay time constants were compared at 50 and 500 Hz frame frequencies for UAS-PV boutons and at 500 Hz for UAS-PV and elav/PV boutons. A paired t-test was used to compare 50 and 500 Hz measurements and a t-test was used to compare UAS-PV and elav/PV measurements at 500 Hz (significantly different from UAS-PV 500 Hz values *p < .05, **p < .01, ***p < .001).
Discussion
Ca2+ transients recorded from MF5 terminals
We recorded single-AP Ca2+ transients in Ib terminals on MF5 in HL3 with 1 mM Ca2+ at frame rates of 50 Hz. Our control terminals (UAS-PV) gave values for peak ΔF and decay τ that were similar or slightly lower than found for Ib terminals on MFs 4 and 6/7 in CS larvae in previous studies (He et al., Citation2009; Lnenicka, Grizzaffi, et al., Citation2006). For Ib terminals on MF 6/7, about 99% of the Ca2+ entering these terminals was initially bound by fast Ca2+ buffers (He & Lnenicka, Citation2011); subsequent Ca2+ clearance after single APs and AP trains was mainly due to extrusion by the plasma membrane Ca2+ ATPase and Ca2+ uptake by the endoplasmic reticulum (Lnenicka, Grizzaffi, et al., Citation2006). It was estimated that a single AP produced an increase in free [Ca2+]i of about 120 nM at the Ib terminals on MF 6/7 based upon calibration of the OGB-1 signal (He & Lnenicka, Citation2011). However, the increase in [Ca2+]i was likely greater since here we show that the 50 Hz frame frequency used in the previous study underestimated the peak ΔF by about 35%. When we switched from HL3 with 1 mM Ca2+ to HL3.1 with 1.5mM Ca2+, the single-AP Ca2+ signal increased in amplitude and duration due to greater Ca2+ influx. This increase in amplitude was expected and consistent with a previous study (He & Lnenicka, Citation2011); the increase in the decay τ might be due to greater Ca2+ binding to fast buffers, which subsequently release Ca2+ during the decay phase.
Effect of PV expression on Ca2+ regulation
Expression of PV in the motor terminals reduced both the amplitude and decay τ of the single-AP Ca2+ transient; this was observed at both 50 and 500 Hz frame frequencies. Due to its slow action, PV is expected to produce a greater effect on the [Ca2+]i decay than the amplitude of single-AP Ca2+ transients (Lee et al., Citation2000). For example, the addition of 100 µM PV to the presynaptic terminal at the Calyx of Held did not produce a significant decrease in the Ca2+ transient amplitude but reduced the decay τ (Muller et al., Citation2007). The Ca2+ transient amplitude may have been reduced in our experiments due to a high level of PV expression. For example, when EGTA, an inorganic Ca2+ buffer that shows similar Ca2+-binding kinetics as PV, was added to granule cells in the rat cerebellum at low concentrations only the decay was affected but at higher concentrations both the Ca2+ transient amplitude and duration were decreased (Atluri & Regehr, Citation1996). This is consistent with calculations predicting that the mean time for a buffer to capture Ca2+ is inversely related to buffer concentration (Roberts, Citation1994). For a 5 s AP train delivered at 10 or 20 Hz, the rate of rise and decay of [Ca2+]i was slower for PV-expressing terminals compared to control ones; however, the increase in [Ca2+]i at the plateau was similar for PV-expressing and control terminals. This is consistent with experimental and theoretical studies of the effect of a Ca2+ buffer on an AP train; the Ca2+ buffer binds Ca2+ to slow its buildup; it does not affect the plateau, which occurs when the buffer is saturated and Ca2+ influx is matched by Ca2+ extrusion and it slows the decay due to the release of Ca2+ (Tank, Regehr, & Delaney, Citation1995).
Our findings that PV reduced the Ca2+ transient amplitude for single APs and slowed the buildup and decay of [Ca2+]i during an AP train are consistent with a previous study in which PV was expressed at the Ib terminals innervating muscle fiber 6 (Harrisingh et al., Citation2007). However, the previous study found no effect on [Ca2+]i decay for single APs and the Ca2+-transient plateau during AP trains was increased for PV-expressing terminals. This latter effect was proposed to reflect a homeostatic reduction in the Ca2+ extrusion rate in response to increased Ca2+ buffering. This disparity in the effect of an exogenous Ca2+ buffer on Ca2+ regulation might be due to neuron-specific differences in the strength of native Ca2+ clearance mechanisms and/or variability in the homeostatic response to the exogenous buffer, which could be influenced by differences in impulse activity.
Effects of PV expression on PPF and synaptic enhancement during AP trains
We characterized PPF at the Ib terminal innervating MF5. The components of facilitation were first described at the frog NMJ where F1 was 1.3 with a decay τ of 35 ms and F2 was 0.2 with a decay τ of 250 ms (Mallart & Martin, Citation1967). In an early study at the Drosophila larval NMJ, F1 and F2 were characterized using extracellular focal recording with greatly reduced Ca2+; F1 was 2.1 with a 68 ms decay τ and the F2 decay τ was 400 ms (Rivosecchi, Pongs, Theil, & Mallart, Citation1994). Our values were similar to these previous studies except our F2 decay τ was about 2–3-fold greater; however, it appears that these values can vary greatly among synapses. For example, in the crayfish opener muscle, the F1 was 2.7–4.6 and the decay τ 19–32 ms for synapses in the central region of the muscle and 1.8 with a decay τ of 180 ms for synapses in the distal muscle region (Bittner & Sewell, Citation1976; Linder, Citation1974; Zucker, Citation1974). F1 showed a very rapid decay at the squid giant synapse, where F1 was 1.4 and the decay τ was 5.8 ms (Charlton & Bittner, Citation1978).
We examined the effect of PV expression on facilitation and found that PV-expressing terminals showed a large decrease in the F1 component of PPF and smaller decrease in the F2 component. In the mouse CNS, PV knockouts have produced a variety of effects on PPF (Caillard et al., Citation2000; Muller et al., Citation2007; Vreugdenhil et al., Citation2003) possibly because PV knockouts only increased facilitation in neurons with normally high levels of PV (Eggermann, Bucurenciu, Goswami, & Jonas, Citation2012). Previous studies showed that EGTA affects PPF in a dose-dependent manner: high EGTA concentrations reduced peak facilitation whereas low ones did not (Atluri & Regehr, Citation1996; Caillard et al., Citation2000). In fact, the effects of introducing high EGTA concentrations into presynaptic terminals of rat cerebellar neurons are similar to our findings since the amplitude and duration of the single AP Ca2+ transient were reduced and PPF was almost eliminated (Atluri & Regehr, Citation1996). These results supported the hypothesis that residual Ca2+ promotes facilitation by binding to a high-affinity Ca2+ sensor for facilitation, which is separate from the low-affinity Ca2+ sensor for exocytosis. This ‘multiple-site hypothesis’ for facilitation appears to be the most widely supported model (Jackman & Regehr, Citation2017; Zucker & Regehr, Citation2002). We find that the F1 decay is similar to the decay of residual Ca2+ since the F1 decay and ΔF decay were both 60 ms for UAS-PV terminals; however the F2 decay (890 ms) outlasted residual Ca2+. This is not surprising since facilitation has often been found to outlast residual Ca2+ and it has been proposed that this resulted from the slow kinetics of Ca2+ unbinding from the facilitation site (Atluri & Regehr, Citation1996). It has been proposed that synaptotagmin 7 acts as the high-affinity Ca2+ sensor for facilitation since knocking out synaptotagmin 7 eliminated PPF at multiple mouse CNS synapses (Jackman, Turecek, Belinsky, & Regehr, Citation2016). However, synaptotagmin 7 does not appear to be required for facilitation at the Drosophila larval NMJ because synaptotagmin 7 mutants still showed PPF (Saraswati, Adolfsen, & Littleton, Citation2007). Although our results support the multiple-site hypothesis for facilitation, they do not rule out the buffer saturation model where facilitation results from the saturation of fast, high-affinity Ca2+ buffers that normally reduces transmitter release by binding Ca2+ before it triggers exocytosis (Rozov, Burnashev, Sakmann, & Neher, Citation2001). In this scenario, modelling has predicted that PV could act to reduce saturation of the fast buffer and reduce facilitation (Eggermann et al., Citation2012).
We found that the synaptic enhancement during 10 s of 20 Hz stimulation in PV-expressing terminals was dramatically reduced compared to controls. The synaptic enhancement seen during these brief AP trains likely result from the buildup of facilitation plus the onset of the longer lasting augmentation and post-tetanic potentiation (Zengel et al., Citation1980; Zengel & Magleby, Citation1980). During the 20 Hz train, the PV terminals showed a slower buildup of synaptic enhancement and [Ca2+]i compared to the controls. This is consistent with studies in the crayfish where the synaptic enhancement during the beginning of a train correlated with the buildup of [Ca2+]i (Delaney & Tank, Citation1994). We also found that the PV terminals showed much less synaptic enhancement than the controls once the EPSP amplitude had plateaued. This was apparently due to less buildup of synaptic facilitation since the synaptic enhancement measured 1–40 s after the train, when only augmentation and post-tetanic potentiation should be present, was not affected by PV expression. Studies of guinea pig hippocampal synapses found a correlation between the plateau [Ca2+]i change and synaptic enhancement for a range of stimulation frequencies (Regehr, Delaney, & Tank, Citation1994). Our reduction in synaptic facilitation during the plateau phase was surprising since the [Ca2+]i plateau was similar in PV and control terminals, presumably because PV was saturated and not an effective Ca2+ buffer.
PV expression produces an increase in transmitter release
The expression of PV resulted in an increase in evoked transmitter release. The expression of a Ca2+ buffer should not directly increase transmitter release so this must be a developmental effect of PV expression. We also observed a surprisingly large increase in spontaneous transmitter release. Increases in evoked release have been reported to be accompanied by an increase in spontaneous release (Cheung, Shayan, Boulianne, & Atwood, Citation1999; Stewart, Schuster, Goodman, & Atwood, Citation1996). However, evoked and spontaneous release are not always correlated and can be differentially regulated, arise from different synaptic sites and involve different molecular mechanisms (Kaeser & Regehr, Citation2014; Melom, Akbergenova, Gavornik, & Littleton, Citation2013; Powers et al., Citation2017; Ramirez & Kavalali, Citation2011). The increase in evoked transmitter release compensated for the decrease in facilitation and partially restored the EPSP amplitude during trains of APs. The increase in transmitter release may have resulted from a homeostatic mechanism designed to maintain synaptic strength during AP trains. Synaptic homeostatic plasticity is a well-established phenomenon at the Drosophila NMJ. In Drosophila, transgenic larvae were shown to compensate for a reduced sensitivity to glutamate at the NMJ or a decrease in muscle membrane resistance by increasing transmitter release from the motor terminals (Davis, DiAntonio, Petersen, & Goodman, Citation1998; DiAntonio, Petersen, Heckmann, & Goodman, Citation1999; Paradis, Sweeney, & Davis, Citation2001; Petersen, Fetter, Noordermeer, Goodman, & DiAntonio, Citation1997). Although these studies examined transmitter release for single APs, it would not be surprising to see homeostasis of synaptic strength for AP trains since these Drosophila terminals normally fire trains of impulses, not single APs; for example, the Ib terminals on muscle fiber 6 fire trains with average AP frequencies of 20–30 Hz (Chouhan et al., Citation2012). We previously found that PV expression in the muscle appeared to decrease transmitter release (Gertner, Desai, & Lnenicka, Citation2014). In that case, postsynaptic Ca2+ buffering reduced activation of Ca-dependent K channels and increased synaptic excitation during AP trains. There, the reduced transmitter release appeared to compensate for the increased synaptic excitation produced by postsynaptic Ca2+ buffering.
PV expression results in the development of smaller motor terminals
We found that PV-expressing terminals were shorter and they had fewer and smaller boutons than control terminals. These results appear consistent with the effects of impulse activity on motor terminal development. The motor terminals in larvae that are hyperactive due to the K+-channel mutant eag Sh were shown to have more synaptic boutons than controls (Budnik, Zhong, & Wu, Citation1990); whereas, hypoactive larvae with the Na+ channel mutant napts developed smaller boutons compared to the controls (Lnenicka, Spencer, & Keshishian, Citation2003). It was proposed that AP activity promoted synaptic growth during larval development by elevating [Ca2+]i leading to the activation of Ca2+-dependent adenylyl cyclases and increased levels of cAMP (Zhong et al., Citation1992); in fact, increases in Ca2+ influx have been shown to produce increased levels of cAMP (Gorbunova & Spitzer, Citation2002). Also, the formation of new boutons produced by patterned depolarization in acute larval preparations appeared to involve increases in cAMP (Vasin et al., Citation2014). The most direct explanation for the change in morphology is that the smaller Ca2+ transients during low frequency AP activity and a slower buildup of [Ca2+]i during AP trains led to the decrease in bouton size and number.
The developmental effects on terminal size could also have resulted from a change in impulse activity. PV expression in the brain may have changed the impulse activity in upstream neural circuits and altered the synaptic drive to the motor neurons. Alternatively, PV expression in the motor neurons may have influenced their excitability by altering the activity of ion channels, such as Ca2+-dependent K+ channels. An argument against an overall change in impulse activity is that neural networks have been shown to adapt to perturbations and restore their normal activity levels (Turrigiano, Citation1999).
We did not see any morphological changes in the motor terminals that could lead to the increase in the transmitter release seen for PV-expressing terminals. In fact, we estimated that the PV-expressing terminals had approximately 25% fewer active zones than the control terminals. Presumably there were molecular changes that resulted in an increase in the probability of evoked transmitter release at the active zones, possibly due to a homeostatic mechanism separate from the mechanism producing the change in terminal size.
Disclosure statement
No potential conflict of interest was reported by the authors.
Additional information
Funding
References
- Andressen, C., Blümcke, I., & Celio, M.R. (1993). Calcium-binding proteins: selective markers of nerve cells. Cell and Tissue Research, 271, 181–208. doi:10.1007/BF00318606
- Atluri, P.P., & Regehr, W.G. (1996). Determinants of the time course of facilitation at the granule cell to Purkinje cell synapse. Journal of Neuroscience, 16, 5661–5671. doi:10.1523/JNEUROSCI.16-18-05661.1996
- Baimbridge, K.G., Celio, M.R., & Rogers, J.H. (1992). Calcium-binding proteins in the nervous system. Trends in Neurosciences, 15, 303–308. doi:10.1016/0166-2236(92)90081-I
- Bastianelli, E. (2003). Distribution of calcium-binding proteins in the cerebellum. Cerebellum, 2, 242–262. doi:10.1080/14734220310022289
- Bittner, G.D., & Sewell, V.L. (1976). Facilitation at crayfish neuromuscular junctions. Journal of Comparative Physiology, 109, 287–308. doi:10.1007/BF00663610
- Budnik, V., Zhong, Y., & Wu, C.F. (1990). Morphological plasticity of motor axons in Drosophila mutants with altered excitability. Journal of Neuroscience, 10, 3754–3768. doi:10.1523/JNEUROSCI.10-11-03754.1990
- Caillard, O., Moreno, H., Schwaller, B., Llano, I., Celio, M.R., & Marty, A. (2000). Role of the calcium-binding protein parvalbumin in short-term synaptic plasticity. Proceedings of the National Academy of Sciences of the United States of America, 97, 13372–13377. doi:10.1073/pnas.230362997
- Charlton, M.P., & Bittner, G.D. (1978). Facilitation of transmitter release at squid synapses. Journal of General Physiology, 72, 471–486. doi:10.1085/jgp.72.4.471
- Cheung, U.S., Shayan, A.J., Boulianne, G.L., & Atwood, H.L. (1999). Drosophila larval neuromuscular junction's responses to reduction of cAMP in the nervous system. Journal of Neurobiology, 40, 1–13. doi:10.1002/(SICI)1097-4695(199907)40:1<1::AID-NEU1>3.0.CO;2-1
- Chouhan, A.K., Ivannikov, M.V., Lu, Z., Sugimori, M., Llinas, R.R., & Macleod, G.T. (2012). Cytosolic calcium coordinates mitochondrial energy metabolism with presynaptic activity. Journal of Neuroscience, 32, 1233–1243. doi:10.1523/JNEUROSCI.1301-11.2012
- Collin, T., Chat, M., Lucas, M.G., Moreno, H., Racay, P., Schwaller, B., … Llano, I. (2005). Developmental changes in parvalbumin regulate presynaptic Ca2+ signaling. Journal of Neuroscience, 25, 96–107. doi:10.1523/JNEUROSCI.3748-04.2005
- Davis, G.W., DiAntonio, A., Petersen, S.A., & Goodman, C.S. (1998). Postsynaptic PKA controls quantal size and reveals a retrograde signal that regulates presynaptic transmitter release in Drosophila. Neuron, 20, 305–315. doi:10.1016/S0896-6273(00)80458-4
- DeFelipe, J. (1997). Types of neurons, synaptic connections and chemical characteristics of cells immunoreactive for calbindin-D28K, parvalbumin and calretinin in the neocortex. Journal of Chemical Neuroanatomy, 14, 1–19. doi:10.1016/S0891-0618(97)10013-8
- Delaney, K.R., & Tank, D.W. (1994). A quantitative measurement of the dependence of short-term synaptic enhancement on presynaptic residual calcium. Journal of Neuroscience, 14, 5885–5902. doi:10.1523/JNEUROSCI.14-10-05885.1994
- DiAntonio, A., Petersen, S.A., Heckmann, M., & Goodman, C.S. (1999). Glutamate receptor expression regulates quantal size and quantal content at the Drosophila neuromuscular junction. Journal of Neuroscience, 19, 3023–3032. doi:10.1523/JNEUROSCI.19-08-03023.1999
- Eggermann, E., Bucurenciu, I., Goswami, S.P., & Jonas, P. (2012). Nanodomain coupling between Ca(2)(+) channels and sensors of exocytosis at fast mammalian synapses. Nature Reviews Neuroscience, 13, 7–21. doi:10.1038/nrn3125
- Feng, Y., Ueda, A., & Wu, C.F. (2004). A modified minimal hemolymph-like solution, HL3.1, for physiological recordings at the neuromuscular junctions of normal and mutant Drosophila larvae. Journal of Neurogenetics, 18, 377–402. doi:10.1080/01677060490894522
- Gertner, D.M., Desai, S., & Lnenicka, G.A. (2014). Synaptic excitation is regulated by the postsynaptic dSK channel at the Drosophila larval NMJ. Journal of Neurophysiology, 111, 2533–2543. doi:10.1152/jn.00903.2013
- Gorbunova, Y.V., & Spitzer, N.C. (2002). Dynamic interactions of cyclic AMP transients and spontaneous Ca(2+) spikes. Nature, 418, 93–96. doi:10.1038/nature00835
- Harrisingh, M.C., Wu, Y., Lnenicka, G.A., & Nitabach, M.N. (2007). Intracellular Ca2+ regulates free-running circadian clock oscillation in vivo. Journal of Neuroscience, 27, 12489–12499. doi:10.1523/JNEUROSCI.3680-07.2007
- He, T., & Lnenicka, G.A. (2011). Ca(2+) buffering at a Drosophila larval synaptic terminal. Synapse, 65, 687–693. doi:10.1002/syn.20909
- He, T., Singh, V., Rumpal, N., & Lnenicka, G.A. (2009). Differences in Ca2+ regulation for high-output Is and low-output Ib motor terminals in Drosophila larvae. Neuroscience, 159, 1283–1291. doi:10.1016/j.neuroscience.2009.01.074
- Hoang, B., & Chiba, A. (2001). Single-cell analysis of Drosophila larval neuromuscular synapses. Developmental Biology, 229, 55–70. doi:10.1006/dbio.2000.9983
- Hof, P.R., Glezer, I.I., Conde, F., Flagg, R.A., Rubin, M.B., Nimchinsky, E.A., & Vogt Weisenhorn, D.M. (1999). Cellular distribution of the calcium-binding proteins parvalbumin, calbindin, and calretinin in the neocortex of mammals: phylogenetic and developmental patterns. Journal of Chemical Neuroanatomy, 16, 77–116. doi:10.1016/S0891-0618(98)00065-9
- Jackman, S.L., & Regehr, W.G. (2017). The mechanisms and functions of synaptic facilitation. Neuron, 94, 447–464. doi:10.1016/j.neuron.2017.02.047
- Jackman, S.L., Turecek, J., Belinsky, J.E., & Regehr, W.G. (2016). The calcium sensor synaptotagmin 7 is required for synaptic facilitation. Nature, 529, 88–91. doi:10.1038/nature16507
- Jan, L.Y., & Jan, Y.N. (1982). Antibodies to horseradish peroxidase as specific neuronal markers in Drosophila and in grasshopper embryos. Proceedings of the National Academy of Sciences of the United States of America, 79, 2700–2704. doi:10.1073/pnas.79.8.2700
- Jande, S.S., Maler, L., & Lawson, D.E. (1981). Immunohistochemical mapping of vitamin D-dependent calcium-binding protein in brain. Nature, 294, 765–767. doi:10.1038/294765a0
- Kaeser, P.S., & Regehr, W.G. (2014). Molecular mechanisms for synchronous, asynchronous, and spontaneous neurotransmitter release. Annual Review of Physiology, 76, 333–363. doi:10.1146/annurev-physiol-021113-170338
- Lee, S.H., Schwaller, B., & Neher, E. (2000). Kinetics of Ca2+ binding to parvalbumin in bovine chromaffin cells: Implications for [Ca2+] transients of neuronal dendrites. Journal of Physiology, 525, 419–432. doi:10.1111/j.1469-7793.2000.t01-2-00419.x
- Lin, D.M., & Goodman, C.S. (1994). Ectopic and increased expression of fasciclin II alters motoneuron growth cone guidance. Neuron, 13, 507–523. doi:10.1016/0896-6273(94)90022-1
- Linder, T.M. (1974). The accumulative properties of facilitation at crayfish neuromuscular synapses. Journal of Physiology, 238, 223–234. doi:10.1113/jphysiol.1974.sp010520
- Lnenicka, G.A., & Keshishian, H. (2000). Identified motor terminals in Drosophila larvae show distinct differences in morphology and physiology. Journal of Neurobiology, 43, 186–197. doi:10.1002/(SICI)1097-4695(200005)43:2<186::AID-NEU8>3.0.CO;2-N
- Lnenicka, G.A., Grizzaffi, J., Lee, B., & Rumpal, N. (2006). Ca2+ dynamics along identified synaptic terminals in Drosophila larvae. Journal of Neuroscience, 26, 12283–12293. doi:10.1523/JNEUROSCI.2665-06.2006
- Lnenicka, G.A., Spencer, G.M., & Keshishian, H. (2003). Effect of reduced impulse activity on the development of identified motor terminals in Drosophila larvae. Journal of Neurobiology, 54, 337–345. doi:10.1002/neu.10133
- Lnenicka, G.A., Theriault, K., & Monroe, R. (2006). Sexual differentiation of identified motor terminals in Drosophila larvae. Journal of Neurobiology, 66, 488–498. doi:10.1002/neu.20234
- Macleod, G.T., Hegstrom-Wojtowicz, M., Charlton, M.P., & Atwood, H.L. (2002). Fast calcium signals in Drosophila motor neuron terminals. Journal of Neurophysiology, 88, 2659–2663. doi:10.1152/jn.00515.2002
- Magleby, K.L., & Zengel, J.E. (1976). Augmentation: A process that acts to increase transmitter release at the frog neuromuscular junction. Journal of Physiology, 257, 449–470. doi:10.1113/jphysiol.1976.sp011378
- Mallart, A., & Martin, A.R. (1967). An analysis of facilitation of transmitter release at the neuromuscular junction of the frog. Journal of Physiology, 193, 679–694. doi:10.1113/jphysiol.1967.sp008388
- Mallart, A. (1993). Calcium-dependent modulation of the facilitation of transmitter release at neuromuscular junctions of Drosophila. Journal of Physiology, 87, 83–88. doi:10.1016/0928-4257(93)90002-B
- Melom, J.E., Akbergenova, Y., Gavornik, J.P., & Littleton, J.T. (2013). Spontaneous and evoked release are independently regulated at individual active zones. Journal of Neuroscience, 33, 17253–17263. doi:10.1523/JNEUROSCI.3334-13.2013
- Morgans, C.W., El, F.O., Berntson, A., Wassle, H., & Taylor, W.R. (1998). Calcium extrusion from mammalian photoreceptor terminals. Journal of Neuroscience, 18, 2467–2474. doi:10.1523/JNEUROSCI.18-07-02467.1998
- Mulkey, R.M., & Zucker, R.S. (1992). Posttetanic potentiation at the crayfish neuromuscular junction is dependent on both intracellular calcium and sodium ion accumulation. Journal of Neuroscience, 12, 4327–4336. doi:10.1523/JNEUROSCI.12-11-04327.1992
- Muller, M., Felmy, F., Schwaller, B., & Schneggenburger, R. (2007). Parvalbumin is a mobile presynaptic Ca2+ buffer in the calyx of held that accelerates the decay of Ca2+ and short-term facilitation. Journal of Neuroscience, 27, 2261–2271. doi:10.1523/JNEUROSCI.5582-06.2007
- Nagerl, U.V., Novo, D., Mody, I., & Vergara, J.L. (2000). Binding kinetics of calbindin-D(28k) determined by flash photolysis of caged Ca(2+). Biophysical Journal, 79, 3009–3018. doi:10.1016/S0006-3495(00)76537-4
- Neher, E. (1995). The use of fura-2 for estimating Ca buffers and Ca fluxes. Neuropharmacology, 34, 1423–1442. doi:10.1016/0028-3908(95)00144-U
- Paradis, S., Sweeney, S.T., & Davis, G.W. (2001). Homeostatic control of presynaptic release is triggered by postsynaptic membrane depolarization. Neuron, 30, 737–749. doi:10.1016/S0896-6273(01)00326-9
- Petersen, S.A., Fetter, R.D., Noordermeer, J.N., Goodman, C.S., & DiAntonio, A. (1997). Genetic analysis of glutamate receptors in Drosophila reveals a retrograde signal regulating presynaptic transmitter release. Neuron, 19, 1237–1248. doi:10.1016/S0896-6273(00)80415-8
- Powers, A.S., Grizzaffi, J., & Lnenicka, G.A. (2017). Increased postsynaptic Ca(2+) reduces mini frequency at the Drosophila larval NMJ. Synapse, 71, e21971. doi:10.1002/syn.21971
- Powers, A.S., Grizzaffi, J., Ribchester, R., & Lnenicka, G.A. (2016). Regulation of quantal currents determines synaptic strength at neuromuscular synapses in larval Drosophila. Pflügers Archiv, 468, 2031–2040. doi:10.1007/s00424-016-1893-7
- Ramirez, D.M., & Kavalali, E.T. (2011). Differential regulation of spontaneous and evoked neurotransmitter release at central synapses. Current Opinion in Neurobiology, 21, 275–282. doi:10.1016/j.conb.2011.01.007
- Regehr, W.G., Delaney, K.R., & Tank, D.W. (1994). The role of presynaptic calcium in short-term enhancement at the hippocampal mossy fiber synapse. Journal of Neuroscience, 14, 523–537. doi:10.1523/JNEUROSCI.14-02-00523.1994
- Reuter, H., & Porzig, H. (1995). Localization and functional significance of the Na+/Ca2+ exchanger in presynaptic boutons of hippocampal cells in culture. Neuron, 15, 1077–1084. doi:10.1016/0896-6273(95)90096-9
- Rivosecchi, R., Pongs, O., Theil, T., & Mallart, A. (1994). Implication of frequenin in the facilitation of transmitter release in Drosophila. Journal of Physiology, 474, 223–232. doi:10.1113/jphysiol.1994.sp020015
- Roberts, W.M. (1994). Localization of calcium signals by a mobile calcium buffer in frog saccular hair cells. Journal of Neuroscience, 14, 3246–3262. doi:10.1523/JNEUROSCI.14-05-03246.1994
- Rogers, J.H. (1989). Two calcium-binding proteins mark many chick sensory neurons. Neuroscience, 31, 697–709. doi:10.1016/0306-4522(89)90434-X
- Rozov, A., Burnashev, N., Sakmann, B., & Neher, E. (2001). Transmitter release modulation by intracellular Ca2+ buffers in facilitating and depressing nerve terminals of pyramidal cells in layer 2/3 of the rat neocortex indicates a target cell-specific difference in presynaptic calcium dynamics. Journal of Physiology, 531, 807–826. doi:10.1111/j.1469-7793.2001.0807h.x
- Sanyal, S., Consoulas, C., Kuromi, H., Basole, A., Mukai, L., Kidokoro, Y., … Ramaswami, M. (2005). Analysis of conditional paralytic mutants in Drosophila sarco-endoplasmic reticulum calcium ATPase reveals novel mechanisms for regulating membrane excitability. Genetics, 169, 737–750. doi:10.1534/genetics.104.031930
- Saraswati, S., Adolfsen, B., & Littleton, J.T. (2007). Characterization of the role of the Synaptotagmin family as calcium sensors in facilitation and asynchronous neurotransmitter release. Proceedings of the National Academy of Sciences of the United States of America, 104, 14122–14127. doi:10.1073/pnas.0706711104
- Schwaller, B., Meyer, M., & Schiffmann, S. (2002). ‘New’ functions for ‘old’ proteins: The role of the calcium-binding proteins calbindin D-28k, calretinin and parvalbumin, in cerebellar physiology. Studies with knockout mice. Cerebellum, 1, 241–258. doi:10.1080/147342202320883551
- Scotti, A.L., Chatton, J.Y., & Reuter, H. (1999). Roles of Na(+)-Ca2+ exchange and of mitochondria in the regulation of presynaptic Ca2+ and spontaneous glutamate release. Philosophical Transactions of The Royal Society B Biological Sciences, 354, 357–364. doi:10.1098/rstb.1999.0387
- Stewart, B.A., Atwood, H.L., Renger, J.J., Wang, J., & Wu, C.F. (1994). Improved stability of Drosophila larval neuromuscular preparations in haemolymph-like physiological solutions. Journal of Comparative Physiology A, 175, 179–191. doi:10.1007/BF00215114
- Stewart, B.A., Schuster, C.M., Goodman, C.S., & Atwood, H.L. (1996). Homeostasis of synaptic transmission in Drosophila with genetically altered nerve terminal morphology. Journal of Neuroscience, 16, 3877–3886. doi:10.1523/JNEUROSCI.16-12-03877.1996
- Tank, D.W., Regehr, W.G., & Delaney, K.R. (1995). A quantitative analysis of presynaptic calcium dynamics that contribute to short-term enhancement. Journal of Neuroscience, 15, 7940–7952. doi:10.1523/JNEUROSCI.15-12-07940.1995
- Turrigiano, G.G. (1999). Homeostatic plasticity in neuronal networks: The more things change, the more they stay the same. Trends in Neurosciences, 22, 221–227. doi:10.1016/S0166-2236(98)01341-1
- Vasin, A., Zueva, L., Torrez, C., Volfson, D., Littleton, J.T., & Bykhovskaia, M. (2014). Synapsin regulates activity-dependent outgrowth of synaptic boutons at the Drosophila neuromuscular junction. Journal of Neuroscience, 34, 10554–10563. doi:10.1523/JNEUROSCI.5074-13.2014
- Vonhoff, F., & Keshishian, H. (2017). In vivo calcium signaling during synaptic refinement at the Drosophila neuromuscular junction. Journal of Neuroscience, 37, 5511–5526. doi:10.1523/JNEUROSCI.2922-16.2017
- Vreugdenhil, M., Jefferys, J.G., Celio, M.R., & Schwaller, B. (2003). Parvalbumin-deficiency facilitates repetitive IPSCs and gamma oscillations in the hippocampus. Journal of Neurophysiology, 89, 1414–1422. doi:10.1152/jn.00576.2002
- Wagh, D.A., Rasse, T.M., Asan, E., Hofbauer, A., Schwenkert, I., Durrbeck, H., … Buchner, E. (2006). Bruchpilot, a protein with homology to ELKS/CAST, is required for structural integrity and function of synaptic active zones in Drosophila. Neuron, 49, 833–844. doi:10.1016/j.neuron.2006.02.008
- Zengel, J.E., & Magleby, K.L. (1980). Differential effects of Ba2+, Sr2+, and Ca2+ on stimulation-induced changes in transmitter release at the frog neuromuscular junction. Journal of General Physiology, 76, 175–211. doi:10.1085/jgp.76.2.175
- Zengel, J.E., Magleby, K.L., Horn, J.P., McAfee, D.A., & Yarowsky, P.J. (1980). Facilitation, augmentation, and potentiation of synaptic transmission at the superior cervical ganglion of the rabbit. Journal of General Physiology, 76, 213–231. doi:10.1085/jgp.76.2.213
- Zhong, Y., Budnik, V., & Wu, C.F. (1992). Synaptic plasticity in Drosophila memory and hyperexcitable mutants: Role of cAMP cascade. Journal of Neuroscience, 12, 644–651. doi:10.1523/JNEUROSCI.12-02-00644.1992
- Zucker, R.S., & Regehr, W.G. (2002). Short-term synaptic plasticity. Annual Review of Physiology, 64, 355–405. doi:10.1146/annurev.physiol.64.092501.114547
- Zucker, R.S. (1974). Characteristics of crayfish neuromuscular facilitation and their calcium dependence. Journal of Physiology, 241, 91–110. doi:10.1113/jphysiol.1974.sp010642
- Zucker, R.S. (1996). Exocytosis: a molecular and physiological perspective. Neuron, 17, 1049–1055. doi:10.1016/S0896-6273(00)80238-X