
Abstract
Little is known about the molecular underpinning of behavioral pleiotropy. The Drosophila melanogaster foraging gene is highly pleiotropic, affecting many independent larval and adult phenotypes. Included in foraging’s multiple phenotypes are larval foraging path length, triglyceride levels, and food intake. foraging has a complex structure with four promoters and 21 transcripts that encode nine protein isoforms of a cGMP dependent protein kinase (PKG). We examined if foraging’s complex molecular structure underlies the behavioral pleiotropy associated with this gene. Using a promotor analysis strategy, we cloned DNA fragments upstream of each of foraging’s transcription start sites and generated four separate forpr-Gal4s. Supporting our hypothesis of modular function, they had discrete, restricted expression patterns throughout the larva. In the CNS, forpr1-Gal4 and forpr4-Gal4 were expressed in neurons while forpr2-Gal4 and forpr3-Gal4 were expressed in glia cells. In the gastric system, forpr1-Gal4 and forpr3-Gal4 were expressed in enteroendocrine cells of the midgut while forpr2-Gal4 was expressed in the stem cells of the midgut. forpr3-Gal4 was expressed in the midgut enterocytes, and midgut and hindgut visceral muscle. forpr4-Gal4’s gastric system expression was restricted to the hindgut. We also found promoter specific expression in the larval fat body, salivary glands, and body muscle. The modularity of foraging’s molecular structure was also apparent in the phenotypic rescues. We rescued larval path length, triglyceride levels (bordered on significance), and food intake of for0 null larvae using different forpr-Gal4s to drive UAS-forcDNA. In a foraging null genetic background, forpr1-Gal4 was the only promoter driven Gal4 to rescue larval path length, forpr3-Gal4 altered triglyceride levels, and forpr4-Gal4 rescued food intake. Our results refine the spatial expression responsible for foraging’s associated phenotypes, as well as the sub-regions of the locus responsible for their expression. foraging’s pleiotropy arises at least in part from the individual contributions of its four promoters.
Introduction
Genes that regulate behavior, with their often complex molecular structures, are fertile ground for investigations into the molecular basis of pleiotropy. One such gene is the foraging gene of Drosophila melanogaster which encodes a cGMP dependent protein kinase (PKG). foraging has four promoters, 21 transcripts, and nine open reading frames (Allen, Anreiter, Neville, & Sokolowski, Citation2017; Kalderon & Rubin, Citation1989) all of which share a common protein kinase domain. This pleiotropic complex gene is known to play a role in multiple larval and adult behavioral phenotypes (Reaume & Sokolowski, Citation2011). The best studied of these are the larval feeding-related traits: larval foraging path length, triglyceride levels, and food intake (Allen et al., Citation2017; Kaun et al., Citation2007; Osborne et al., Citation1997). These phenotypes reflect the larva’s ability to navigate its environment, ingest food, and store the resources for times of need, all of which are important for larval survival to adulthood.
There are many ways that molecularly complex genes can accomplish their pleiotropic effects (Hodgkin, Citation1998; Pyeritz, Citation1989). Below are examples of how pleiotropy can be accomplished at the molecular level. These examples are not mutually exclusive. In the first example, the multiple transcripts that produce distinct protein products differ in their downstream targets. In the case of foraging, all of its 21 transcripts code for the same kinase domain but they differ in their regulatory domains (Allen et al., Citation2017; Kalderon & Rubin, Citation1989; Osborne et al., Citation1997). foraging's mammalian orthologue, cGKI, produces multiple isoforms with differing expression, biochemical activity, and interacting partners and substrates (Hofmann, Bernhard, Lukowski, & Weinmeister, Citation2009; Schlossmann & Desch, Citation2009; Smith, Francis, Walsh, Kumar, & Corbin, Citation1996). In the second example, the cellular environment as well as the spatial and temporal expression pattern can affect post-transcriptional regulation. foraging is known to be expressed in many different tissue systems (Chintapalli, Wang, & Dow, Citation2007; Graveley et al., Citation2011). In the third example, a gene’s multiple promoters are regulated independently; they drive gene products during different times in development, in different tissues and/or in response to distinctive environmental stimuli. This likely arises from differences in the transcription factor binding sites found in each of the promoter specific sequences (Anreiter, Kramer, & Sokolowski, Citation2017; Anreiter & Sokolowski, Citation2018). As with the D. melanogaster foraging gene, the use of alternative promoters that result in mRNA transcripts with different 5′-untranslated regions is a regularly used mechanism in eukaryotes to ensure the proper level of expression, timing, and cell specificity of a gene (Ayoubi & Van De Ven, Citation1996). Variations within cis-regulatory elements, the regions of DNA bound by transcription factors, can also affect a subset of the spatial- or temporal-expression of the gene. These regulatory differences are known to be important for morphological, physiological, and behavioral evolution between lineages (Andersson & Georges, Citation2004; Carroll, Citation2000; Hofmann, Citation2003).
Allen et al. (Citation2017) experimentally defined foraging’s transcription start sites, termination sites, and splicing patterns utilizing rapid amplification of cDNA ends (RACE) and full-length cDNA sequencing. As mentioned above, this uncovered four independent promoters pr1–4, that produce 21 transcripts with nine distinct open reading frames. The authors postulated that the use of alternative promoters and splicing at this locus can generate diversity and flexibility in the regulation of gene expression and function. They also generated a null allele (for0) using homologous recombination to precisely delete foraging; recombineering was used to reintegrate a full genomic copy into the genome in increasing doses of the gene to rescue the (for0) phenotypes. They found that a total loss of foraging expression in larvae resulted in reduced larval foraging path length, reduced food intake, and an increase in triglyceride levels (Allen et al., Citation2017). Their results proved that these larval phenotypes were influenced by foraging and suggested that they may be independently regulated from within the locus (Allen et al., Citation2017).
The independent roles of foraging’s promoters in regulating behavior were recently demonstrated in a study on the ‘rover’, forR and ‘sitter’, fors foraging allelic variants, which differ in a variety of foraging-related traits (Anreiter et al., Citation2017). Sitter adults have lower foraging scores, finding and feeding on fewer food drops than rovers. This difference in adult feeding behavior was mediated by the histone methyl transferase G9a, which methylates the foraging promoters (Anreiter et al., Citation2017). Sitters had lower G9a-mediated methylation at promoter 4 and higher expression of promoter 4 transcripts. Decreasing promoter 4 expression in sitters with a transcript-specific RNAi transformed sitter feeding behavior into a rover (Anreiter et al., Citation2017). These findings further supported the hypothesis that the four promoters of foraging are independently regulated to affect distinct phenotypes.
Here, we propose that foraging achieves its pleiotropy through its complex molecular structure and that separate regulatory regions along the locus drive expression of the promoters in a tissue-specific manner. We begin with a promoter analysis approach, employing the Gal4/UAS system (Brand & Perrimon, Citation1993). This approach was successfully used to identify a gene’s regulatory regions and deduce expression and function (Arredondo et al., Citation2001; Billeter & Goodwin, Citation2004; Brenner et al Citation1996; Lehman et al., Citation1999; Okada et al., Citation2001; Park et al., Citation2000; Thomas, Wang, Brenner, & Atkinson, Citation1997). We generated four promoter-Gal4 fusions (forpr-Gal4) 5′ to each of the four foraging transcription start sites and then characterized their expression patterns in larvae using a green fluorescent protein (GFP) reporter (Lee & Luo, Citation1999; Ormö et al., Citation1996). To rescue the effects of the for0 null mutant allele on larval path length behavior, triglyceride levels, and food intake, we drove a UAS-forcDNA with each of the newly generated four forpr-Gal4s in a for0 background and measured the effects on these larval phenotypes. We found that: (1) each forpr-Gal4 expressed in many tissue systems, including the nervous system, gastric system, as well as other various tissues including fat body and muscle and, (2) expression from different foraging promoters rescued distinct larval phenotypes of foraging null larvae. We concluded that foraging’s complex modular structure allows for independent regulation and expression of foraging’s larval phenotypes.
Materials and methods
Strains and rearing
Strains were kept in 40 ml vials containing 10 ml of cornmeal/molasses fly food (described in Allen et al., Citation2017) or 170 ml bottles with 40 ml of the same fly food. Flies were reared at 25 ± 1 °C with a 12L:12D photocycle with lights on at 0800 h. Third instar larvae were developmentally synchronization as in Anreiter, Vasquez, Allen, and Sokolowski (Citation2016). Briefly, 5- to 7-day-old adults laid eggs on a grape juice and agar media. After 20 h, early hatched larvae were removed and discarded. The plates were incubated for 4 h and newly hatched larvae were placed into Petri dishes containing fly food. Larvae were incubated for 3 days until they reached mid third instar (72 ± 2 h post-hatch).
The UAS foraging cDNA (also called UAS-T1 in Belay et al., Citation2007) was made from cDNA encoded by the gene’s RNA transcript A (RA; see Allen et al., Citation2017). It is shown in and was previously generated in the laboratory of M. B. Sokolowski (University of Toronto). UAS-Stinger (Barolo, Carver, & Posakony, Citation2000) was obtained from J. D. Levine (University of Toronto). UAS-mCD8::GFP was from the Bloomington Drosophila Stock Center. The for0 allele is described in Allen et al. (Citation2017). All behavioral and metabolic phenotypes were conducted on strains that were backcrossed for nine generations into the fors genetic background. The more recently isogenized fors and forR strains described in Anreiter et al. (Citation2017) were used as additional controls for the phenotyping experiments. The rover strain, isogenized in the late 1990's, and described in Kaun et al., (Citation2007) was used to generate the forpr-Gal4 transgenes.
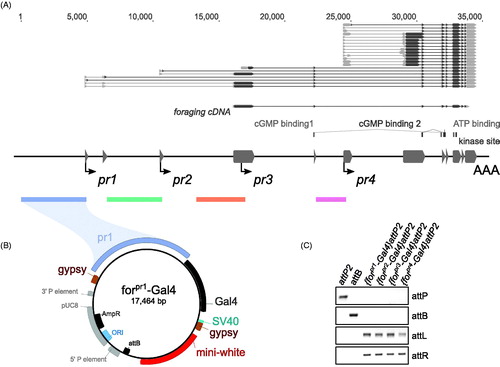
Figure 1. Cloning of forpr-Gal4s. (A) Schematic of the foraging locus (dark grey – exons), its transcripts above the locus (grey – UTR, black – ORF), transcription start sites (arrows) and the cloned regions (colored bars below locus) used in the promoter analysis. The regions up to 5 kb upstream of and 300 bp downstream of the TSS for the four identified minimal promoters were cloned into a gypsy insulated Gal4 vector. The ORF used in the UAS-forcDNA is annotated below the transcripts and is a derivative of the RNA transcript A (RA) and codes for the protein isoform A (PA). (B) Example of one of the cloned forpr1-Gal4 constructs. The forpr1-Gal4 segment is flanked by gypsy insulator sequences. An attB site-specific recombination sequence from φC31 was added to the vector. (C) PCR confirmation of the four forpr-Gal4 integrations. There was a positive integration event in all lines.
Promoter-Gal4s
Bioinformatics were conducted with the Geneious software package (Kearse et al., Citation2012). An attB sequence was amplified with PCR from the pUAST-attB vector (Bischof, Maeda, Hediger, Karch, & Basler, Citation2007).
(attB-F: ATGCATGTCTGGATCCACTAGTGTCG,
attB-R: ATGCATGCTGGCTAGAACTAGTGTCG).
NsiI sites were added to the primers. The NsiI fragment was then cloned into the pStinger vector (Barolo et al., Citation2000). Regions of the foraging gene were amplified with PCR and cloned into pGEM-Teasy vector (Promega, Madison, WI, USA).
(forpr1Gal4-F: GAGCTCTCCGCAGTCCCTATTCTTCCC,
forpr1Gal4-R: GGTACCACAAGTCGATGAAAAACCGCC,
forpr2Gal4-F: GAGCTCGTAAGCTCCATTTTAATATGC,
forpr2Gal4-R: GGTACCCCAAAACCAAGTGTAACACAC,
forpr3Gal4-F: GAGCTCAAGGATGCAAGATGTCTG,
forpr3Gal4-R: GGTACCGGGATCCTGGTTCAATTGCTG,
forpr4Gal4-F: GAGCTCGTGAGTTGAAGCTCCAAGC,
forpr4Gal4-R: GGTACCCGAATTGAAAATCACGATACG).
Each region included its respective transcription-start-site and extended 5′ to varying lengths. The total fragment sizes were; pr1–4.9 kb, pr2–4.2 kb, pr3–3.7 kb, pr4–2.3 kb. SacI sites were added to the forward primers and KpnI sites were added to the reverse primers (underlined). The SacI/KpnI fragments were digested out of pGEM and inserted into the Gal4 containing pMARTINI-Gal4 vector (Billeter & Goodwin, Citation2004). The NotI pr-Gal4 fragments were then inserted into the pStinger-attB vector, replacing the eGFP sequence. The resulting vector contained a pr-Gal4 sequence between two gypsy insulators with an attB sequence. All forpr-Gal4 constructs were injected into the P{CaryP}attP2 landing site (Groth, Fish, Nusse, & Calos, Citation2004) by Genetic Services Inc. Successful integration was confirmed with PCR. The P{CaryP}attP2 integration site was chosen for its high levels of inducible expression and low levels of leaky expression from position effects (Groth et al., Citation2004; Markstein, Pitsouli, Villalta, Celniker, & Perrimon, Citation2008). The cloning of the four forpr-Gal4 lines is shown in along with a schematic of the foraging gene.
Whole-mount immunofluorescence
Dissected samples were fixed in 4% paraformaldehyde in 1× PBS for 1 h. The fixed samples were rinsed twice in 0.5% Triton X in one time PBS (PBT) and then washed four times for 30 min each in PBT. The samples were blocked in 10% normal goat serum (NGS, Jackson ImmunoResearch Laboratories, West Grove, Pennsylvania, USA) and 0.1% BSA (Sigma, St. Louis, MO, USA) in PBT for 2 h at room temperature. Primary antibody incubations (Rabbit anti-GFP, 1:600, Thermo Fisher, Waltham, MA, USA, cat#A-11122) were conducted in blocking solution and incubated overnight at 4 °C. After primary incubation the samples were rinsed twice and then washed four times for 30 min each in PBT. Secondary antibody (Alexa Fluor 488, goat anti-Rabbit IgG, 1:2000, Thermo Fisher cat#A-11034) was incubated in PBT at room temperature for 2 h. Washing was conducted as described above for the primary antibody. Tissues were mounted on slides in Vectashield (Vector Labs, Burlingame, CA, USA). Samples were imaged using a Zeiss LSM 510 and Leica SP5 confocal microscopes. Images were analysed using Fiji software package (Schindelin et al., Citation2012). Dissection was done under a GFP dissection scope so that the entire larva could be examined for GFP expression. Subsequently, the CNS, guts, fat bodies, salivary glands, and carcasses were stained and mounted on slides and imaged on the confocal. The expression reported here represents what was consistent between endogenous fluorescence and antibody staining for both an mCD8::GFP and a nls::GFP. Imaging was performed on fly strains with both the original genetic backgrounds, post injection, as well as on strains backcrossed for 9 generations into the fors background; no genetic background effects were found.
Path length
The larval path length protocol is detailed in Anreiter et al. (Citation2016). Briefly, mid-third instar larvae (72 ± 2 h post-hatch) were removed from food plates and rinsed in water. A yeast paste solution (2:1 w/w) was spread across the wells of custom black rectangular Plexiglas plates, creating a thin even layer of yeast paste in each well. Larvae were placed in each well and covered with a Petri dish lid. After 5 min the path lengths left in the yeast paste were traced onto the Petri dish lid. Path lengths were digitized using Fiji (Schindelin et al., Citation2012). Because of the extent of the larval path length assays, rescue experiments for the pr-Gal4 lines had to be tested on different days. Consequently, additional forR and fors controls were run for the path length experiments. Data are shown in Figure S2.
Food intake
Larval food intake assays were performed as described in Allen et al. (Citation2017). Briefly, larvae were place in tissue culture dishes with liquid food contained 0.5% fluorescein, 5% sucrose, and 5% yeast extract. Larvae were left to feed for 10 min, washed three times in water, and placed into a 1.5 ml tube and frozen. Groups of 10 larvae were homogenized in 1× PBS and then centrifuged. The supernatant was analyzed with a fluorometer. Larvae that were fed food without fluorescein were homogenized and used as a blank.
Triglyceride analysis
Triglyceride analysis was performed as described in Allen et al. (Citation2017). Briefly, groups of 10 larvae were homogenized in 200 μl of 0.1% Tween 20 in 1× PBS. Homogenates were incubated at 70 °C for 5 min and then incubated on ice for 2 min prior to centrifugation. A small aliquot of the supernatant was analyzed with Infinity TAG Reagent (Thermo Scientific, Waltham, MA, USA, cat# TR22421) following manufacturers specifications. A separate aliquot was analyzed with Pierce BCA Protein Assay Kit (Thermo Scientific, cat# 23227) to quantify protein levels in the samples following manufacturers’ specifications. Triglyceride levels are displayed as µg glycerol/mg protein.
Statistical analysis and data availability
Statistical analysis was performed in R (R Core Team, Citation2013). ANOVA and Tukey HSD post hoc tests were run to compute statistical significances and are summarized in Supplementary Table 1. The boxplots show the mean with the whiskers displaying 1.5 times the interquartile range. For a rescue to be considered significant the UAS/Gal4 treatment had to be significantly different than both of the UAS and the Gal4 controls. Plots were edited with Inkscape. All data are available upon request.
Results
shows a schematic of the foraging gene showing each of its four promoters and the DNA fragments cloned 5′ to each fragment. foraging’s RNA transcripts along with the foraging cDNA used in this study are shown at the top of the figure. shows how the forpr1-Gal4 constructs were cloned and shows that each of the constructs was integrated in all the forpr1-Gal4 lines.
forpr-Gal4 expression
Each of the four forpr-Gal4 lines showed expression in varying cell types in different tissue systems in larvae (, Figure S1). All four promoters expressed in the CNS, each having a distinct, non-overlapping cellular expression pattern (. forpr1-Gal4 and forpr4-Gal4 were expressed in neurons, while forpr2-Gal4 and forpr3-Gal4 were expressed in glia, but not neurons. forpr1-Gal4 expressed in neurons throughout the central brain and VNC (), whereas forpr4-Gal4 expression was restricted primarily to the optic lobes, the eye imaginal discs, and the leg imaginal discs (). forpr2-Gal4 expressed in the midline glia (). forpr3-Gal4 expressed in the surface glia ().
Figure 2. forpr-Gal4s expression in the 3rd instar larval CNS, gastric system, and fat body. Whole-mount immunofluorescence analysis of forpr-Gal4 driving UAS-mCD8::GFP in the larval CNS and stained with anti-GFP. Sample sizes were n ≥ 12 larvae for each of experiment. Representative images are shown. Scale bars = 100 µm. (A) Schematic of the foraging locus with the cloned regions near the transcription start sites highlighted. (B) forpr1-Gal4 expressed in neurons throughout the VNC and brain lobes. (C) forpr2-Gal4 expressed in midline glia in the VNC. (D) forpr3-Gal4 expressed in the perineurial surface glia of the CNS and PNS. (E) forpr4-Gal4 expressed in the optic lobes of the CNS and the eye imaginal discs and the leg imaginal discs. (F) forpr1-Gal4 expressed in enteroendocrine cells in the anterior portion of the larval midgut. (G) forpr2-Gal4 expressed in the adult midgut precursor cells (AMP) throughout the midgut. (H) forpr3-Gal4 expressed in the muscle of the midgut. (I) forpr4-Gal4 expressed in the h5d, h6d, hv, and h7 regions of the larval hindgut. (J) forpr1-Gal4 was not expressed in fat body. (K) forpr2-Gal4 was not expressed in fat body. (L) forpr3-Gal4 was expressed in the fat body. (M) forpr4-Gal4 was not expressed in fat body.
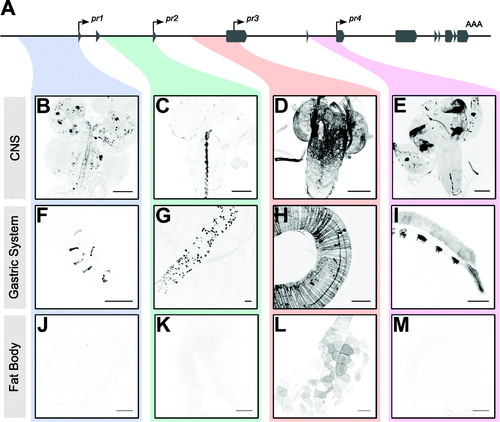
Similarly, all forpr-Gal4s were expressed in the gut but each in a different set of cells (. Expression of forpr1-Gal4 was evident in a few enteroendocrine cells (EEC) in the anterior of the midgut (). forpr2-Gal4 was expressed in the adult midgut precursors (AMPs), which include the intestinal stem cells (, Figure S1(B)). forpr2-Gal4 also expressed in the ureter of the Malpighian tubules (data not shown). forpr3-Gal4 had the broadest expression of the four drivers in the gastric system. forpr3-Gal4 expressed in midgut anterior enterocytes (), the copper cells responsible for acid secretion (Dubreuil, Citation2004), as well as the large flat cells of the middle midgut, important for the secretion and absorption. forpr3-Gal4 also drove expression in the circular and longitudinal muscle of the midgut and hindgut (, Figure S1(E)) necessary for peristaltic contraction in the gastric system. Additionally, forpr3-Gal4 expressed in EEC further down the midgut from forpr1-Gal4 (, Figure S1(F)). Finally, forpr3-Gal4 expressed in the primary cells of the anterior Malpighian tubules (Figure S1(H)). forpr4-Gal4 expressed exclusively in the hindgut (). The larval hindgut is separated into many distinct sections, each with differing functions. forpr4-Gal4 expressed in the h3 (peristaltic contractions), h5d and h6d (ion and water transport), hv (absorption), and h7 (contractions for fecal waste) regions of the hindgut (, Figure S1(O)) (Murakami & Shiotsuki, Citation2001).
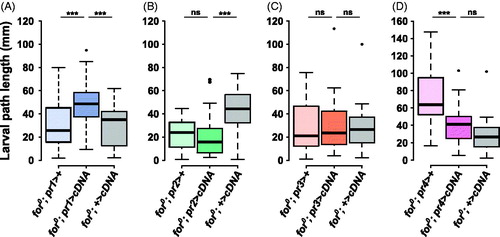
Figure 3. forp1-Gal4 rescues foraging null (for0) larval path length. (A) The pr1 experimental (for0/for0; {forpr1-Gal4}/{UAS-forcDNA}) had significantly longer path lengths than either the Gal4 control (for0/for0; {forpr1-Gal4}/+, p = .00041) and the UAS control (for0/for0; +/{UAS-forcDNA}, p = .0004). (B) The pr2 experimental (for0/for0; {forpr2-Gal4}/{UAS-forcDNA}) did not have significantly longer path lengths than the Gal4 control (for0/for0; {forpr2-Gal4}/+, p = .95). (C) The pr3 experimental (for0/for0; {forpr3-Gal4}/{UAS-forcDNA}) was not significantly different from the Gal4 control (for0/for0; {forpr3-Gal4}/+, p = .93) or the UAS control (for0/for0; +/{UAS-forcDNA}, p = .89). (D) The pr4 experimental (for0/for0; {forpr4-Gal4}/{UAS-forcDNA}) was not significantly different from the UAS control (for0/for0; +/{UAS-forcDNA}, p = .17). Sample size: n = 30 larvae per genotype per plot. The boxplots show the mean with the whiskers displaying 1.5 times the interquartile range. For a rescue to be considered significant the UAS/Gal4 treatment had to be significantly different than both of the UAS and the Gal4 controls.
Finally, both forpr2-Gal4 and forpr4-Gal4 expressed in the salivary gland imaginal ring (Figure S1(C, N)), which develops into the adult salivary duct and gland during metamorphosis. forpr3-Gal4 expressed in the developed larval salivary gland (Figure S1(I)) and extensively in body wall muscle (Figure S1(D)). forpr3-Gal4 expressed in the fat body (). In contrast, forpr1-Gal4, forp2-Gal4, and forp4-Gal4 did not expressed in the fat body (, respectively). forpr4-Gal4 expressed in dorsal denticles (Figure S1(K)), as well as the anterior and posterior spiracles (Figure S1(L,M)). Although the four forpr-Gal4s show broad expression, with forpr3-Gal4 being the broadest, their expression patterns are striking in their cell and tissue specificity.
Modularity of for’s phenotypic effects
Above we show that the fragments cloned 5′ to each of foraging’s promoters drive independent and diverse expression patterns. Next, we determined if expressing UAS-forcDNA in each of the forpr-Gal4s patterns could significantly change the larval path length, triglyceride levels, and food intake of for0 null larvae. As is common practice in Drosophila research, a transgenic rescue was significant when the UAS/Gal4 treatment was significantly different than both of the UAS and the Gal4 controls (). forR and fors data were collected as additional controls for the forpr-Gal4 experiments (Figure S2). Here, we determine whether foraging’s modular structure with its four promoters, explain the pleiotropic effects of foraging on these larval traits.
Figure 4. forp3-Gal4 affects larval triglyceride levels. (A) The pr1 experimental (for0/for0; {forpr1-Gal4}/{UAS-forcDNA}) was not significantly different from the Gal4 control (for0/for0; {forpr1-Gal4}/+, p = .78) or the UAS control (for0/for0; +/{UAS-forcDNA}, p = 0.94). (B) The pr2 experimental (for0/for0; {forpr2-Gal4}/{UAS-forcDNA}) was intermediate between the significantly different Gal4 (for0/for0; {forpr2-Gal4}/+) and UAS (for0/for0; +/{UAS-forcDNA}) controls. (C) There was significant variation in the pr3 triglyceride experiment (F(2,27) = 3.76, p = .036). The pr3 experimental (for0/for0; {forpr3-Gal4}/{UAS-forcDNA}) bordered on being significantly different from the Gal4 control (for0/for0; {forpr3-Gal4}/+, p = .06) and the UAS control (for0/for0; +/{UAS-forcDNA}, p = .06). D) The pr4 experimental (for0/for0; {forpr4-Gal4}/{UAS-forcDNA}) was not significantly different from the Gal4 control (for0/for0; {forpr4-Gal4}/+, p = 1.00). Sample size: n = 10 extracts (of 10 pooled larvae) per genotype per plot. The boxplots show the mean with the whiskers displaying 1.5 times the interquartile range. For a rescue to be considered significant the UAS/Gal4 treatment had to be significantly different than both of the UAS and the Gal4 controls.
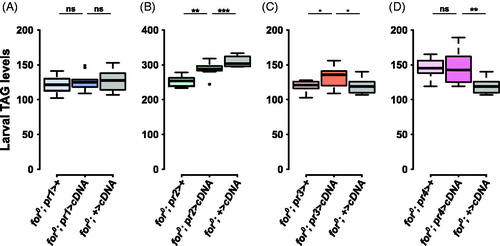
Figure 5. forp4-Gal4 rescues null larval food intake. (A) The pr1 experimental (for0/for0; {forpr1-Gal4}/{UAS-forcDNA}) was not significantly different from the UAS control (for0/for0; +/{UAS-forcDNA}, p = .85). (B) The pr2 experimental (for0/for0; {forpr2-Gal4}/{UAS-forcDNA}) was not significantly different from the Gal4 control (for0/for0; {forpr2-Gal4}/+, p = .87) or the UAS control (for0/for0; +/{UAS-forcDNA}, p = .86). (C) The pr3 experimental (for0/for0; {forpr3-Gal4}/{UAS-forcDNA}) was not significantly different from the Gal4 control (for0/for0; {forpr3-Gal4}/+, p = .18). (D) The pr4 experimental (for0/for0; {forpr4-Gal4}/{UAS-forcDNA}) was significantly different from the Gal4 control (for0/for0; {forpr4-Gal4}/+, p = .00005) and the UAS control (for0/for0; +/{UAS-forcDNA}, p = .006). Sample size: n = 10 extracts (of 10 pooled larvae) per genotype per plot. The boxplots show the mean with the whiskers displaying 1.5 times the interquartile range. For a rescue to be considered significant the UAS/Gal4 treatment had to be significantly different than both of the UAS and the Gal4 controls.
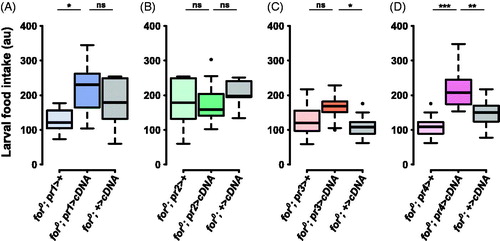
pr1 > cDNA increases for0 path length behavior
When foraging cDNA was expressed using forpr1-Gal4 the path length of for0 larvae was significantly higher than the UAS or Gal4 controls (F(2,87) = 10.7, p = 7.2e − 05; treatment compared to Gal4 control, p < .001 and UAS control, p < .001; ). This rescue was specific to the forpr1-Gal4, as the other three forpr-Gal4s did not rescue the path length phenotype (; Table S1). This shows that the forpr1-Gal4 pattern of expression was specifically needed for altering for0 larval path length.
pr3 > cDNA increases for0 triglyceride levels
When a foraging cDNA was expressed using forpr3-Gal4 the triglyceride levels of for0 larvae bordered on being significantly higher than the controls (F(2,27) = 3.76, p = .036; treatment compared to Gal4 control, p < .06 and UAS control, p < .06; ). This border line triglyceride rescue was specific to forpr3-Gal4 and not the other three forpr-Gal4s (, B, D); Table S1). This suggests that the forpr3-Gal4 pattern of expression was likely needed for altering for0 larval triglyceride levels.
pr4 > cDNA increases for0 food intake behavior
When a foraging cDNA was expressed using forpr4-Gal4 the food intake of for0 larvae was significantly higher than the controls (F(2,27) = 13.9, p = 7.1e − 05; treatment compared to Gal4 control, p < .0001 and UAS control, p < .01; ). This rescue was specific to the forpr4-Gal4 as the other three forpr-Gal4s did not rescue the food intake phenotype (; Table S1). This suggests that the forpr4-Gal4 pattern of expression was specifically needed for altering for0 larval food intake.
Discussion
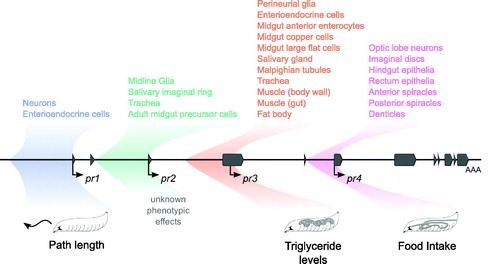
Our findings support the hypothesis that foraging’s modular molecular structure contributes to its pleiotropy (). To address this hypothesis, we cloned four regions upstream of the four independent transcription start sites (called pr1–4) in the foraging gene. We used a GFP reporter to drive the expression of each fragment using Gal4 and found that each of these clone regions drove independent diverse expression in multiple tissue systems of the larva. foraging cDNA expressed using each of the pr-Gal4 drivers individually rescued foraging path length, triglyceride levels, and food intake of foraging null mutant larvae.forpr1-Gal4 expression was sufficient to rescue the for0 path length phenotype. forpr1-Gal4 was found in neurons in the central brain VNC, PNS, and a few enteroendocrine cells in the anterior of the midgut. The release of endocrine molecules from EECs plays a role in maintaining gut homeostasis by sending hormonal cues to the enterocytes to regulate digestion and absorption (Veenstra, Citation2009). Future research will identify which of these cells in the nervous system and or gut are important for larval foraging path length. forpr2-Gal4 expression did not rescue any of the larval phenotypes. In the nervous system it was expressed in midline glia which are crucial for midline axon guidance and nervous system morphogenesis (Jacobs, Citation2000). forpr2-Gal4 also expressed in the adult midgut precursors (AMPs) known to contain the intestinal stem cells and other support cells; during preparation for pupal development, these cells begin to increase in number to repopulate the midgut with adult cells (Jiang & Edgar, Citation2009). forpr3-Gal4 which bordered on significance to effect altered larval triglycerides had the widest expression pattern including the larval fat body, muscle, enterocytes, and the surface glia. The surface glia, made up of perineural and subperineurial glia, are important for blood–brain barrier activities (Edwards & Meinertzhagen, Citation2010). forpr3-Gal4 glial cells may be perineurial glia due to the size and number of cells (Stork, Bernardos, & Freeman, Citation2012). Interestingly, fat body, muscle, and enterocytes tissue systems have previously been shown to affect triglyceride levels (Lee, Bassel-Duby, & Olson, Citation2014; Song, Veenstra, & Perrimon, Citation2014). Allen et al.’s (Citation2017) previous finding of increased triglyceride levels in foraging null larvae appears to contradict the findings of the present study where we found that foraging cDNA expressed using forpr3-Gal4 also increased triglyceride levels. One explanation for this discrepancy is that foraging functions antagonistically in different tissues to affect fat levels. This can be examined in the future by manipulating foraging using fat body, muscle or gut tissue specific drivers and measuring differences in larval triglyceride levels that arise from these manipulations. forpr4-Gal4 expression was sufficient to rescue larval food intake. It was restricted primarily to the optic lobes and discs, hindgut epithelia, and the spiracles. Relative to the other promoter driven Gal4s forpr1-Gal4 and forpr4-Gal4 were expressed in a restricted number of cells. This will facilitate future mapping of the specific cells responsible for each of the path length and food intake phenotype using intersectional methods such as by Gal80 (Suster, Seugnet, Bate, & Sokolowski, Citation2004) and Flp-out (Bischof & Basler, Citation2008).
Figure 6. Summary of expression and phenotypic effects. A schematic of the foraging gene in the center with exons in grey and transcription start sites marked with arrows. The regions cloned in the forpr-Gal4s are colored and shaded. The expression patterns seen in the forpr-Gal4s are summarized above the locus. Depictions of the rescued phenotypes are shown below the locus.
Recently, it was shown that products from pr4 were responsible for affecting adult fly food intake and foraging behavior (Anreiter et al., Citation2017). This suggests that larval and adult food intake may be regulated by the same foraging promoter across development. However, when comparing the results of Anreiter et al. (Citation2017) to the present study, it becomes clear that larval foraging path length behavior and adult foraging behavior are likely controlled by different parts of the foraging gene, since forpr1-Gal4 and not forpr4-Gal4 rescued larval foraging behavior. Future experiments will determine which of these tissues or combination of tissues result in these larval and adult phenotypes (for further discussion see Anreiter & Sokolowski, 2018).
It is unlikely that the cloned fragments of foraging used in the present study to generate the forpr-Gal4s encompass all of the DNA that regulates foraging. Significantly, however, these DNA fragments were sufficient for promoter specific rescues of the three larval phenotypes investigated here. The forpr-Gal4s expression patterns reported in the present study direct us to the potential subsets of cells, and also to the DNA sequences that are important for each larval phenotype. These DNA regions also serve as pivotal regions of interest when looking for allelic differences in the foraging gene strains, such as in the rover and sitter allelic variants, as shown in Anreiter et al. (Citation2017).
Overall, this work represents a significant advance in how the foraging gene elicits its phenotypic effects in the larva. The expression patterns reported here can be used to generate new hypotheses about where foraging is required for other of its pleiotropic phenotypes. For example, foraging has previously been implicated in nutrient absorption in larvae (Kaun, Chakaborty-Chatterjee, & Sokolowski, Citation2008) and gut function in adults (Urquhart-Cronish & Sokolowski, Citation2014). The enterocytes and enteroendocrine cells reported here are important for absorption and digestion of ingested nutrients and visceral muscle may affect peristalsis of nutrients through the gut. foraging’s orthologue in mice is known to function in smooth muscle (Hofmann, Feil, Kleppisch, & Schlossmann, Citation2006; Hofmann et al., Citation2009; Lohmann, Vaandrager, Smolenski, Walter, & De Jonge, Citation1997) and it also affects gut passage time (Weber et al., Citation2007). The forpr3-Gal4 also drove expression in the Malpighian tubules. The tubules are vital for ion balance in the hemolymph, and foraging has been previously characterized for influencing adult Malpighian tubule secretion rate (MacPherson et al., Citation2004a, Citation2004b).
We successfully rescued the foraging null phenotypes of larval foraging path length, triglyceride levels (bordered on significance) and food intake by driving expression of foraging cDNA using individual promoters. This suggests that the expression captured by the Gal4s from the promoter fragments we cloned is likely representative of the expression of the foraging gene. An outstanding issue is whether the forpr-Gal4s recapitulate native foraging expression. An antibody against foraging protein was previously published for immuno-histochemistry in the adult CNS (Belay et al., Citation2007). Unfortunately, this antibody was unable to detect differences in staining between wild-type and for0 null mutant larvae. We were therefore unable to evaluate these forprGal4s with our anti-FOR antibody. Microarrays on dissected tissue, RNA-seq on dissected tissue, and RNA-seq on sorted cells (from sources such as FlyAtlas, FlyAtlas2, modENCODE, and Flygut-seq) support our finding of foraging expression in multiple tissues including the CNS, fat body, salivary glands, trachea, and the gut (Chintapalli et al., Citation2007; Dutta et al., Citation2015; Graveley et al., Citation2011; Leader et al., Citation2018). Future use of novel translation dependent protein trap techniques (Diao et al., Citation2015; Venken et al., Citation2011) may provide further transgenic methods for identifying the foraging gene’s expression.
Conclusion
foraging’s complex molecular structure contributes to the pleiotropy in larval feeding-related phenotypes. We rescued the larval path length, food intake, and triglyceride levels (bordered on significance) of the for0 null larvae by driving expression of a UAS-forcDNA using individual forpr-Gal4s. Each of the forpr-Gal4s we generated had discrete, restricted expression patterns throughout the larva. The modularity of foraging’s molecular structure was also apparent in the phenotypic rescues. Our data support the hypothesis that foraging’s pleiotropy results from the individual contributions of its four foraging promoters. These results refine the spatial expression and the sub-regions of the gene responsible for foraging’s associated larval phenotypes. This study provides a road map for investigating other aspects of foraging’s pleiotropic effects in the larval and adult fly. This modular nature of foraging’s promoters and their different functions may have interesting implications for the evolutionary pressures acting on the locus. This differential regulation may serve as an adaptive escape from the constraints of pleiotropy (Des Marais & Rausher, Citation2008).
Supplemental Material
Download PDF (240.4 KB)Acknowledgements
We would like to thank Jean-Christophe Billeter, and Joel Levine for guidance and advice as well as the Sokolowski Lab for helpful discussions. Megan Neville and Deniz Erezyilmaz for comments on the manuscript and two anonymous reviewers of this journal for helpful suggestions. Stocks obtained from the Bloomington Drosophila Stock Center (NIH P40OD018537) were used in this study.
Disclosure statement
No potential conflict of interest was reported by the authors.
Additional information
Funding
References
- Allen, A.M., Anreiter, I., Neville, M.C., & Sokolowski, M.B. (2017). Feeding-related traits are affected by dosage of the foraging gene in Drosophila melanogaster. Genetics, 205, 761–773. doi:10.1534/genetics.116.197939
- Andersson, L., & Georges, M. (2004). Domestic-animal genomics: Deciphering the genetics of complex traits. Nature Reviews Genetics, 5, 202–212. doi:10.1038/nrg1294
- Anreiter, I., Vasquez, O.E., Allen, A.M., & Sokolowski, M.B. (2016). Foraging path-length protocol for Drosophila melanogaster larvae. Journal of Visualized Experiments, 110, e53980. doi:10.3791/53980
- Anreiter, I., Kramer, J.M., & Sokolowski, M.B. (2017). Epigenetic mechanisms modulate differences in Drosophila foraging behavior. Proceedings of the National Academy of Sciences USA, 114, 12518–12523. doi:10.1073/pnas.1710770114
- Anreiter, I., & Sokolowski, M.B. (2018). Deciphering pleiotropy: How complex genes regulate behavior. Communicative & Integrative Biology, e1447743. doi:10.1080/19420889.2018.1447743
- Arredondo, J.J., Marco Ferreres, R., Maroto, M., Cripps, R.M., Marco, R., Bernstein, S.I., & Cervera, M. (2001). Control of Drosophila paramyosin/miniparamyosin gene expression. Differential regulatory mechanisms for muscle-specific transcription. Journal of Biological Chemistry, 276, 8278–8287. doi:10.1074/jbc.M009302200
- Ayoubi, T.A., & Van De Ven, W.J. (1996). Regulation of gene expression by alternative promoters. FASEB Journal, 10, 453–460. doi:10.1096/fasebj.10.4.8647344
- Barolo, S., Carver, L.A., & Posakony, J.W. (2000). GFP and β-galactosidase transformation vectors for promoter/enhancer analysis in Drosophila. BioTechniques, 29, 726–732.
- Belay, A.T., Scheiner, R., So, A. K.-C., Douglas, S.J., Chakaborty-Chatterjee, M., Levine, J.D., & Sokolowski, M.B. (2007). The foraging gene of Drosophila melanogaster: Spatial-expression analysis and sucrose responsiveness. The Journal of Comparative Neurology, 504, 570–582. doi:10.1002/cne.21466
- Billeter, J.-C., & Goodwin, S.F. (2004). Characterization of Drosophila fruitless-gal4 transgenes reveals expression in male-specific fruitless neurons and innervation of male reproductive structures. The Journal of Comparative Neurology, 475, 270–287. doi:10.1002/cne.20177
- Bischof, J., & Basler, K. (2008). Recombinases and their use in gene activation, gene inactivation, and transgenesis. Methods in Molecular Biology (Clifton, N.J.), 420, 175–195. doi:10.1007/978-1-59745-583-1
- Bischof, J., Maeda, R.K., Hediger, M., Karch, F., & Basler, K. (2007). An optimized transgenesis system for Drosophila using germ-line-specific phiC31 integrases. Proceedings of the National Academy of Sciences USA, 104, 3312–3317. doi:10.1073/pnas.0611511104
- Brand, A.H., & Perrimon, N. (1993). Targeted gene expression as a means of altering cell fates and generating dominant phenotypes. Development, 118, 401–415.
- Brenner, R., Thomas, T.O., Becker, M.N., & Atkinson, N.S. (1996). Tissue-specific expression of a Ca(2+)-activated K + channel is controlled by multiple upstream regulatory elements. The Journal of Neuroscience, 16, 1827–1835. doi:10.1523/JNEUROSCI.16-05-01827.1996
- Carroll, S.B. (2000). Endless forms: the evolution of gene regulation and morphological diversity. Cell, 101, 577–580. doi:10.1016/S0092-8674(00)80868-5
- Chintapalli, V.R., Wang, J., & Dow, J.A.T. (2007). Using FlyAtlas to identify better Drosophila melanogaster models of human disease. Nature Genetics, 39, 715–720. doi:10.1038/ng2049
- Des Marais, D.L., & Rausher, M.D. (2008). Escape from adaptive conflict after duplication in an anthocyanin pathway gene. Nature, 454, 762–765. doi:10.1038/nature07092
- Diao, F., Ironfield, H., Luan, H., Diao, F., Shropshire, W.C., Ewer, J., … White, B.H. (2015). Plug-and-play genetic access to Drosophila cell types using exchangeable exon cassettes. Cell Reports, 10, 1410–1421. doi:10.1016/j.celrep.2015.01.059
- Dubreuil, R.R. (2004). Copper cells and stomach acid secretion in the Drosophila midgut. The International Journal of Biochemistry & Cell Biology, 36, 745–752.
- Dutta, D., Dobson, A. J., Houtz, P. L., Gläβer, C., Revah, J., Korzelius, J., Patel, P. H., Edgar, B. A., Buchon, N. (2015). Regional cell-specific transcriptome mapping reveals regulatory complexity in the adult Drosophila midgut. Cell Rep. 12, 346–358.
- Edwards, T.N., & Meinertzhagen, I.A. (2010). The functional organisation of glia in the adult brain of Drosophila and other insects. Progress in Neurobiology, 90, 471–497. doi:10.1016/j.pneurobio.2010.01.001
- Graveley, B.R., Brooks, A.N., Carlson, J.W., Duff, M.O., Landolin, J.M., Yang, L., … Celniker, S.E. (2011). The developmental transcriptome of Drosophila melanogaster. Nature, 471, 473–479. doi:10.1038/nature09715
- Groth, A.C., Fish, M., Nusse, R., & Calos, M.P. (2004). Construction of transgenic Drosophila by using the site-specific integrase from phage φC31. Genetics, 166, 1775–1782. doi:10.1534/genetics.166.4.1775
- Hodgkin, J. (1998). Seven types of pleiotropy. International Journal of Developmental Biology, 42, 501–505.
- Hofmann, F., Bernhard, D., Lukowski, R., & Weinmeister, P. (2009). cGMP regulated protein kinases (cGK). cGMP: Generators, effectors and therapeutic implications (pp. 137–162). Berlin, Heidelberg: Springer Berlin Heidelberg.
- Hofmann, F., Feil, R., Kleppisch, T., & Schlossmann, J. (2006). Function of cGMP-dependent protein kinases as revealed by gene deletion. Physiological Reviews, 86, 1–23. doi:10.1152/physrev.00015.2005
- Hofmann, H.A. (2003). Functional genomics of neural and behavioral plasticity. Journal of Neurobiology, 54, 272–282. doi:10.1002/neu.10172
- Jacobs, J.R. (2000). The midline glia of Drosophila: A molecular genetic model for the developmental functions of glia. Prog. Neurobiol. 62, 475–508.
- Jiang, H., & Edgar, B.A. (2009). EGFR signalling regulates the proliferation of Drosophila adult midgut progenitors. Development, 136, 483–493. doi:10.1242/dev.026955
- Kalderon, D., & Rubin, G.M. (1989). cGMP-dependent protein kinase genes in Drosophila. The Journal of Biological Chemistry, 264, 10738–10748.
- Kaun, K.R., Chakaborty-Chatterjee, M., & Sokolowski, M.B. (2008). Natural variation in plasticity of glucose homeostasis and food intake. The Journal of Experimental Biology, 211, 3160–3166. doi:10.1242/jeb.010124
- Kaun, K.R., Riedl, C.A.L., Chakaborty-Chatterjee, M., Belay, A.T., Douglas, S.J., Gibbs, A.G., & Sokolowski, M.B. (2007). Natural variation in food acquisition mediated via a Drosophila cGMP-dependent protein kinase. The Journal of Experimental Biology, 210, 3547–3558. doi:10.1242/jeb.006924
- Kearse, M., Moir, R., Wilson, A., Stones-Havas, S., Cheung, M., Sturrock, S., … Drummond, A. (2012). Geneious basic: An integrated and extendable desktop software platform for the organization and analysis of sequence data. Bioinformatics, 28, 1647–1649. doi:10.1093/bioinformatics/bts199
- Leader, D. P., Krause, S. A., Pandit, A., Davies, S. A., Dow, J. A. T. (2018). FlyAtlas 2: A new version of the Drosophila melanogaster expression atlas with RNA-Seq, miRNA-Seq and sex-specific data. Nucleic Acids Res. 46, D809–D815.
- Lee, J.-H., Bassel-Duby, R., & Olson, E.N. (2014). Heart- and muscle-derived signaling system dependent on MED13 and Wingless controls obesity in Drosophila. Proceedings of the National Academy of Sciences USA, 111, 9491–9496. doi:10.1073/pnas.1409427111
- Lee, T., & Luo, L. (1999). Mosaic analysis with a repressible cell marker for studies of gene function in neuronal morphogenesis. Neuron, 22, 451–461. doi:10.1016/S0896-6273(00)80701-1
- Lehman, D.A., Patterson, B., Johnston, L.A., Balzer, T., Britton, J.S., Saint, R., & Edgar, B.A. (1999). Cis-regulatory elements of the mitotic regulator, string/Cdc25. Development, 126, 1793–1803.
- Lohmann, S.M., Vaandrager, A.B., Smolenski, A., Walter, U., & De Jonge, H.R. (1997). Distinct and specific functions of cGMP-dependent protein kinases. Trends in Biochemical Sciences, 22, 307–312. doi:10.1016/S0968-0004(97)01086-4
- MacPherson, M.R., Broderick, K.E., Graham, S., Day, J.P., Houslay, M.D., Dow, J.A.T., & Davies, S.A. (2004a). The dg2 (for) gene confers a renal phenotype in Drosophila by modulation of cGMP-specific phosphodiesterase. J. Exp. Biol. 207, 2769–2776.
- MacPherson, M.R., Lohmann, S.M., and Davies, S.-A. (2004b). Analysis of Drosophila cGMP-dependent protein kinases and assessment of their in vivo roles by targeted expression in a renal transporting epithelium. J. Biol. Chem. 279, 40026–40034.
- Markstein, M., Pitsouli, C., Villalta, C., Celniker, S.E., & Perrimon, N. (2008). Exploiting position effects and the gypsy retrovirus insulator to engineer precisely expressed transgenes. Nature Genetics, 40, 476–483. doi:10.1038/ng.101
- Murakami, R., & Shiotsuki, Y. (2001). Ultrastructure of the hindgut of Drosophila larvae, with special reference to the domains identified by specific gene expression patterns. Journal of Morphology, 248, 144–150. doi:10.1002/jmor.1025
- Okada, T., Sakai, T., Murata, T., Kako, K., Sakamoto, K., Ohtomi, M., … Ishida, N. (2001). Promoter analysis for daily expression of Drosophila timeless gene. Biochemical and Biophysical Research Communications, 283, 577–582. doi:10.1006/bbrc.2001.4793
- Ormö, M., Cubitt, A.B., Kallio, K., Gross, L.A., Tsien, R.Y., & Remington, S.J. (1996). Crystal structure of the Aequorea victoria green fluorescent protein. Science, 273, 1392–1395. doi:10.1126/science.273.5280.1392
- Osborne, K.A., Robichon, A., Burgess, E., Butland, S., Shaw, R.A., Coulthard, A., & Pereira, H.S. (1997). Natural behavior polymorphism due to a cGMP-dependent protein kinase of Drosophila. Science, 277, 834–836. doi:10.1126/science.277.5327.834
- Park, J.H., Helfrich-Förster, C., Lee, G., Liu, L., Rosbash, M., & Hall, J.C. (2000). Differential regulation of circadian pacemaker output by separate clock genes in Drosophila. Proceedings of the National Academy of Science USA, 97, 3608–3613. doi:10.1073/pnas.97.7.3608
- Pyeritz, R.E. (1989). Pleiotropy revisited: Molecular explanations of a classic concept. American Journal of Medical Genetics, 34, 124–134. doi:10.1002/ajmg.1320340120
- R Core Team (2018). R: A language and environment for statistical computing. R Foundation for Statistical Computing, Vienna, Austria. https://www.R-project.org/
- Reaume, C.J., & Sokolowski, M.B. (2011). Conservation of gene function in behaviour. Philosophical Transactions of the Royal Society of London B: Biological Sciences, 366, 2100. doi:10.1098/rstb.2011.0028
- Schindelin, J., Arganda-Carreras, I., Frise, E., Kaynig, V., Longair, M., Pietzsch, T., … Cardona, A. (2012). Fiji: An open-source platform for biological-image analysis. Nature Methods, 9, 676–682. doi:10.1038/nmeth.2019
- Schlossmann, J., & Desch, M. (2009). cGK substrates. cGMP: Generators, effectors and therapeutic implications (pp. 163–193). Berlin, Heidelberg: Springer Berlin Heidelberg.
- Smith, J.A., Francis, S.H., Walsh, K.A., Kumar, S., & Corbin, J.D. (1996). Autophosphorylation of type Ibeta cGMP-dependent protein kinase increases basal catalytic activity and enhances allosteric activation by cGMP or cAMP. The Journal of Biological Chemistry, 271, 20756–20762. doi:10.1074/jbc.271.34.20756
- Song, W., Veenstra, J.A., & Perrimon, N. (2014). Control of lipid metabolism by tachykinin in Drosophila. Cell Reports, 9, 40–47. doi:10.1016/j.celrep.2014.08.060
- Stork, T., Bernardos, R., & Freeman, M.R. (2012). Analysis of glial cell development and function in Drosophila. Cold Spring Harbor Protocols, 2012, 1–17.
- Suster, M.L., Seugnet, L., Bate, M., & Sokolowski, M.B. (2004). Refining GAL4-driven transgene expression in Drosophila with a GAL80 enhancer-trap. Genesis, 39, 240–245. doi:10.1002/gene.20051
- Thomas, T., Wang, B., Brenner, R., & Atkinson, N.S. (1997). Novel embryonic regulation of Ca(2+)-activated K + channel expression in Drosophila. Invertebrate Neuroscience, 2, 283–291. doi:10.1007/BF02211941
- Urquhart-Cronish, M., & Sokolowski, M.B. (2014). Gene-environment interplay in Drosophila melanogaster: Chronic nutritional deprivation in larval life affects adult fecal output. Journal of Insect Physiology, 69, 95–100. doi:10.1016/j.jinsphys.2014.06.001
- Veenstra, J.A. (2009). Peptidergic paracrine and endocrine cells in the midgut of the fruit fly maggot. Cell and Tissue Research, 336, 309–323. doi:10.1007/s00441-009-0769-y
- Venken, K.J.T., Schulze, K.L., Haelterman, N.A., Pan, H., He, Y., Evans-Holm, M., … Bellen, H.J. (2011). MiMIC: A highly versatile transposon insertion resource for engineering Drosophila melanogaster genes. Nature Methods, 8, 737–743. doi:10.1038/nmeth.1662
- Weber, S., Bernhard, D., Lukowski, R., Weinmeister, P., Worner, R., Wegener, J.W., … Feil, R. (2007). Rescue of cGMP kinase I knockout mice by smooth muscle specific expression of either isozyme. Circulation Research, 101, 1096–1103. doi:10.1161/CIRCRESAHA.107.154351