
Abstract
Purpose
Chronic obstructive pulmonary disease (COPD) patients experience hypoxemia and lung tissue hypoxia, causing vasoconstriction, and at its most severe Cor pulmonale. However, minimal attention has been given to the effects of hypoxia at the cellular level. We hypothesize that a persistent progenitor cell population undergoes an aberrant differentiation process, influenced by changes in oxygen.
Methods
Distal lung progenitor cells from two emphysematous donors were cultured in 21% and 2% oxygen. Proliferation was determined on collagen-coated plastic and in 3T3-J2 co-culture. Epithelial (E-cadherin, pan-cytokeratin) and progenitor (TP63, cytokeratin 5) marker expressions were examined. Cells were differentiated at air–liquid interface, and ciliated, mucus-producing, and club cell populations identified by immunofluorescence. MUC5AC, MUC5B, CC10, and TP63 expression were determined using qRT-PCR, mucin5AC, and mucin5B protein levels by ELISA, and secreted mucin by periodic acid biotin hydrazide assay.
Results
Cells were positive for epithelial and progenitor markers at isolation and passage 5. Passage 5 cells in hypoxia increased the proportion of TP63 by 10% from 51.6 ± 1.2% to 62.6 ± 2.3% (p ≤ 0.01). Proliferative capacity was greater on 3T3J2 cells and in 2% oxygen, supporting the emergence of a proliferation unrestricted population with limited differentiation capacity. Differentiation resulted in βIV tubulin positive-ciliated cells, mucin5AC, mucin5B, and CC10 positive secretory cells. Epithelial barrier formation was reduced (p ≤ 0.0001) in hypoxia-expanded cells. qRT-PCR showed higher mucin expression in 2% cells, significantly so with MUC5B (p ≤ 0.05). Although overall mucin5AC and mucin5B content was greater in 21% cells, normalization of secreted mucin to DNA showed a trend for increased mucin by low oxygen cells.
Conclusions
These results demonstrate that hypoxia promotes a proliferative phenotype while affecting subsequent progenitor cell differentiation capacity. Furthermore, the retained differentiation potential becomes skewed to a more secretory phenotype, demonstrating that hypoxia may be contributing to disease symptoms and severity in COPD patients.
Introduction
Chronic obstructive pulmonary disease (COPD) is the most common chronic respiratory condition, affects around 12% of the global population, and is the third leading cause of death worldwide.Citation1–3 It is associated with considerable morbidity for affected individuals and thus presents a significant economic burden.Citation4,Citation5 Therapeutic options remain severely limited, with the management of symptoms and treatment of disease exacerbations as they arise continuing to be the norm. Development of COPD is strongly associated with smoking, with prevalence in smokers more than twice as high as in never-smokers.Citation1 Nevertheless, the details of disease initiation, progression, and the reasons for such a diverse presentation, are not yet well defined.Citation6
At the cellular level, typical changes in the airway are also diverse with loss and dysfunction of cilia, basal cell hyperplasia, mucous gland hypertrophy, pockets of secretory cell bronchiolar metaplasia and bronchial hyperplasia, along with squamous cell metaplasia being common features.Citation7,Citation8 It is likely that changes to progenitor cell populations, responsible for epithelial tissue homeostasis, are contributing to these disease-associated alterations.
Oxygen is a key biological signaling molecule; a large number of transcriptional changes can be controlled by the surrounding oxygen tension, mediated by the levels of stabilized hypoxia inducible factors (HIFs).Citation9 Hypoxia is rare in healthy adult lung tissue but more common during fetal development and in diseased states, where hypoxia may be present in pockets of diseased tissue in the lungs, depending on disease severity.Citation10 The lungs exhibit a unique response to hypoxia; typically, hypoxic tissue events result in vasodilation to increase blood flow, in the lungs poor ventilation leads to vasoconstriction to redirect blood flow to prevent hypoxemia. This ventilation/perfusion (V/Q) mismatch response will further exacerbate local tissue hypoxia. COPD patients also experience hypoxemia with significant drops in arterial oxygen pressure (PaO2) from approximately 100 mmHg in healthy individuals to below 40 mmHg during COPD exacerbations,Citation11 with a consequential decrease in oxygen saturation.
Unsurprisingly then, hypoxia-associated changes have been detected in COPD patients including the upregulation of HIF-1α in bronchial tissue undergoing COPD-associated airway remodeling and associated with goblet cell hyperplasia.Citation12 Despite the presence of global hypoxemia, localized hypoxia, and the presence of HIF in affected lung tissue, there persists a paucity of data regarding the direct effect of hypoxia on lung cell behavior. Limited evidence has demonstrated a number of changes in animal and cell-line models including increased oxidative stress, increased pro- and reduced anti-inflammatory mediators, increased expression of pro-apoptotic genes, and reduced surfactant proteins.Citation13–15
Having previously seen alterations in porcine airway cell proliferation and differentiation in response to reduced oxygen levels,Citation16 we hypothesized that the hypoxia and hypoxemia present in COPD patients may be contributing to changes seen at the cell and tissue level in the small airways. To address our hypothesis, we aimed to use a patient-derived in vitro differentiation model to determine whether human distal airway stem cells (hDASCs) exhibited altered proliferation characteristics and differentiation fate following low oxygen (2% O2) cell culture. In agreement with our porcine data, reduced oxygen culture enhanced hDASC proliferation, but concomitantly impaired subsequent differentiation capacity. Further, secretory cell differentiation was retained temporally beyond that of ciliated cell differentiation, supporting a model of a hypoxia-driven impairment of cellular homeostasis of the mucociliary escalator. Such an impairment could contribute significantly to the mucus accumulation and subsequent consequences suffered by COPD patients.
Materials and methods
Cell culture
Human distal lung tissue was obtained from 2 tissue donors: donor 1, a male, emphysematous donor (FEV1 44% of predicted, FVC 48% of predicted, FEV1/FVC 29%), and donor 2, a female emphysematous donor (FEV1 92% of predicted, FVC 115% of predicted, FEV1/FVC 62%) undergoing surgical lung resection at the Royal Stoke University Hospital, with fully informed written consent and full Health Research Authority (HRA) ethical approval (16/WM/0447). Tissue was reviewed upon excision by an experienced Consultant Histopathologist to confirm the absence of unexpected gross abnormalities prior to same-day transfer to the cell culture laboratory on ice. Upon examination, no cartilaginous airways were seen to be present in the tissues.
Tissue was washed in three changes of 500 μg/mL gentamicin sulfate (Thermo Scientific Alfa Aesar, UK), 100 μg/mL ciprofloxacin (Thermo Scientific, UK), 1000 IU/mL penicillin, 1 mg/mL streptomycin, and 2.5 μg/mL amphotericin B in Hank’s balanced salt solution (HBSS) (Lonza, UK). It was then finely minced and digested overnight on a rocker at 4 °C in 1 mg/mL protease XIV (Sigma-Aldrich, UK), 0.005% trypsin (Lonza, UK), and 10 ng/mL DNAse I (Sigma-Aldrich, UK) in F12: DMEM (1: 1) (Lonza, UK). Following digestion, the suspension was passed through sterile gauze and a 70 µm cell strainer before centrifugation at 350 g for 10 min, red blood cells (RBCs) were lysed with RBC lysis buffer (Sigma-Aldrich, UK), and the cells counted with trypan blue (Sigma-Aldrich, UK) for dead cell discrimination. Cells were then seeded on tissue culture plastic pre-coated with a 10 μg/cm2 type 1 rat tail collagen solution (Corning, UK). Cells were incubated in cFAD + RI16 (DMEM: F12 (75: 25), 10% (v/v) fetal bovine serum (FBS) (Biosera, UK), 1% (v/v) non-essential amino acids (NEAA), 2 mM L-glutamine (Lonza, UK), 24 μg/mL adenine, 5 μg/mL transferrin, 5 μg/mL insulin, 0.4 μg/mL hydrocortisone, 0.13 μg/mL triiodothyronine (all Sigma-Aldrich, UK), and 10 ng/mL epidermal growth factor (EGF) (Peprotech, UK), 10 µM Y-27632 dihydrochloride Rho-kinase inhibitor (Selleck Chemicals, UK) in either standard tissue culture incubators (21% O2 (air), 5% CO2, 5% humidity, 37 °C) or tri-gas incubators (2% O2, 5% CO2, 73% N2, 95% humidity, 37 °C) as indicated throughout. During routine culture media changes were performed twice weekly; when necessary, cells were subcultured enzymatically using 0.1% (w/v) trypsin/0.04% (w/v) ethylenediaminetetraacetic acid (EDTA) (5 g/L trypsin and 2 g/L EDTA diluted 1 in 5 in calcium- and magnesium-free phosphate-buffered saline (PBS)) (Lonza, UK).
To produce feeder layers for co-culture, 3T3-J2 cells (Kerafast, US) were expanded (maximum of 12 additional passages from receipt) in 4.5 g/L DMEM supplemented with 10% iron-supplemented bovine calf serum (Seradigm, US), (1% (v/v) NEAA, 2 mM L-glutamine (Lonza, UK), 100 IU/mL penicillin,100μg/mL streptomycin, and 0.25 μg/mL amphotericin B. Media was changed twice per week and cells were passaged enzymatically as necessary with 0.05% (w/v) trypsin/0.02% (w/v) EDTA. Cells were inactivated by culture in the presence of 10 μg/mL of mitomycin C (Tocris, UK) in culture media for 2 h, followed by 3 PBS washes, trypsinization, and cryopreservation until required. Cells were recovered from cryopreservation at a density of 1.5 x 10⁴ cells/cm2 approximately 16–24 h before being needed.
Cell proliferation
For donor 1, early passage cell population doublings were estimated based on the split ratio used at the passage; for donor 2 and later passage donor 1, the population doublings were determined by cell counting and the use of the formula n = 3.32 (log UCY - log l, where n = the number of PD, UCY = the cell yield, l = the starting cell number.
Flow cytometry
Flow cytometry was used to determine the forward scatter (FSC) and side scatter (SSC) of the cultured cells across passages/population doublings and TP63 expression at passage 5. For FSC and SSC analysis, cells were trypsinized, washed with PBS (Lonza, UK), re-suspended in 400 µL of PBS, and data were obtained immediately on a Cytoflex flow cytometer (Beckman Coulter Life Sciences). For TP63 analysis cells were trypsinized and washed with PBS before fixation in 2% (w/v) chilled paraformaldehyde (PFA) in PBS for 10 min. PFA was removed and cells permeabilized with 0.1% Triton-X (Sigma-Aldrich, UK) in PBS for 15 min and blocked with 5% bovine serum albumin (BSA) (Thermo Scientific, UK) for 15 min. Directly conjugated (Alexa Fluor® 647) primary TP63 antibody (Abcam, ab246728, UK) and isotype control antibody (Cell Signaling Technology, 3452S, UK) were diluted as per the primary antibody manufacturer’s recommendation for flow cytometry to 0.08 µg/mL in 0.05% Triton-X in PBS. Cells were re-suspended in 100 µL of antibody or isotype control solution for 30 min before washing with PBS and re-suspending in flow cytometry buffer (0.5% (w/v) BSA, 2 mM EDTA (Lonza, UK) in PBS) for analysis, unstained cells were also included. Fluorescence data was collected on the APC-A channel and for all analyses a gating strategy was employed whereby firstly debris and dead cells were gated out of the data, followed by doublet exclusion using the FSC-height and FSC-area parameters. All other events were included in the analyses. Data were analyzed using Cytexpert software (Beckman Coulter).
Air–liquid interface cultures
To induce differentiation, cells were cultured at the air–liquid interface on ThinCert cell culture inserts (0.34 μm area, 0.45 μm pore size) (Greiner Bio-one, UK) in sterile 24-well plates. Cells were seeded at 2 × 10⁵ cells/cm2 in cFAD + RI medium and cultured for 3 days, then the medium changed to 1:1 cFAD + RI:Pneumacult ALI (Stemcell Technologies, UK) for 2 days to ensure monolayers were 100% confluent. The culture medium was then replaced with a complete PneumaCult ALI medium in the basal compartment only. All differentiation was performed at 21% O2. The medium was changed twice per week for 21–28 days.
Transepithelial electrical resistance (TEER)
TEER was determined for differentiating ALI cultures using a Millicell ERS2 epithelial volt-ohm meter. To measure TEER, the medium was removed from culture inserts (apical and basal at day 0 and basal only at days 7, 14, and 21) and replaced with HBSS with calcium and magnesium, and the barrier resistance was determined by inserting the probe across the apical and basal compartments. The HBSS was then aspirated from both compartments and the Pneumacult ALI medium returned to the basal compartments of cultures only, to restore ALI. TEER was calculated by subtracting the resistance measurement of HBSS and insert only (acellular control) from ALI resistance measurements and multiplying by the insert culture area to give an Ω·cm2 value.
Immunocytochemistry
Cells were fixed in either 95% (w/v) chilled methanol (Thermo Fisher, UK) or 4% (w/v) paraformaldehyde (Sigma-Aldrich, UK) and stored under PBS at 4 °C until staining. Cells were permeabilized with 0.1% (w/v) Triton X for 10 min and then incubated with 5% (w/v) BSA for 1 h at room temperature before overnight incubation with primary antibody diluted in PBS at 4° C (vimentin, 1 in 500 (ab92547); pan-cytokeratin, 1 in 100 (ab86734); alpha-smooth muscle actin, 1 in 100 (ab5694); E-cadherin, 1 in 50 (ab15148); P63, 1 in 300 (ab124762); cytokeratin 5, 1 in 100 (ab52635); mucin 5AC, 1 in 200 (ab3649); β IV tubulin, 1 in 500 (ab179509); mucin 5AC (Abcam, UK); mucin 5B, 1 in 50 (sc-21768) (Santa Cruz Biotechnology, US). Primary antibody was then removed, and cells were washed in 3 changes of PBS prior to incubation with secondary antibody (DyLight 488 anti-rabbit IgG (ab96881) or DyLight 594 anti-mouse IgG (ab96881) (Abcam, UK)) for 1 h at room temperature in the dark. The secondary antibody was then removed, and cells were washed in 2 changes of PBS before incubation with DAPI (Sigma-Aldrich, UK) for 5 min. Cells were then washed once, covered with PBS, and imaged on a Nikon Eclipse T1 fluorescence microscope with a Photometrix Prime Mono camera or an Olympus FV1200 confocal microscope.
Alcian Blue-Periodic acid Schiff (AB-PAS) staining
PBS was removed from basal and apical chambers of fixed ALI cultures, and the samples were covered with 1% Alcian blue in 3% aqueous acetic acid for 30 min, washed with distilled water until water remained clear followed by 0.5% periodic acid solution for 5 min, washed with distilled water, and covered with Schiff reagent (all Sigma-Aldrich, UK) for 20 min. Schiff reagent was removed, and the samples were washed with lukewarm tap water for 5 min. Culture inserts were imaged submerged in distilled water.
Mucin5AC and Mucin5B ELISA
To collect samples for mucin quantification ALI cultures were established as described for 28 days. Cell samples were taken at days 0, 21, and 28 by lysis with RIPA buffer. At days 7, 14, 21, and 28 the apical surfaces of cultures were washed with 50 μL of HBSS for 15 min to collect secreted mucins. Apical washes were combined for analysis over the full culture period. Lysates and apical washes were stored at −80 °C prior to analysis.
To prepare lysates for analysis they were first treated with DNase I at 1 μg/mL for 30 min on ice and centrifuged for 20 min at 1000 g at 4 °C to remove insoluble impurities. Mucin5AC and mucin5B sandwich ELISAs (FineTest, China)) were carried out in accordance with the manufacturer’s directions.
Gene expression analysis
Samples were lysed, and total RNA was extracted using a Qiagen RNeasy Mini Kit. RLT lysis buffer supplemented with 10 µL/mL β-mercaptoethanol (Sigma-Aldrich, UK) was pipetted onto the samples, and the cells were disrupted by pipetting before transfer to a microcentrifuge tube and storage at −80 °C until extraction. RNA was extracted using the kit as per the manufacturer’s protocol. Eluted RNA was quantified with a NanoDrop 2000 spectrophotometer (Thermo Scientific, UK) and stored at −80 °C until required.
Relative gene expression in undifferentiated cells and 21-day ALI differentiated monolayers was assessed using quantitative reverse transcription–polymerase chain reaction (qRT-PCR) with the SuperScript III Platinum SYBRGreen One-Step qRT-PCR Kit (Life Technologies, UK) and an AriaMX real-time thermal cycler (Agilent, UK). 5 ng of RNA was used per reaction and samples’ relative expression levels of MUC5AC, MUC5B, CC10, and TP63 were normalized to GAPDH expression, with expression in differentiated cells expressed relative to undifferentiated cells (−ΔΔCT).
Periodic acid biotin hydrazide (PABH) mucin assay
Secreted proteoglycans (predominantly mucin from differentiated cultures) were collected from ALI differentiated cultures from cells isolated from donor 2. Cultures were overlaid with HBSS, triturated, incubated for 15 min, triturated again, and the samples were frozen at −80 °C until analysis by PABH assay.Citation17 To determine the relative mucin content samples were diluted (typically 1 in 500 to 1 in 1000) in sterile 0.9% saline, duplicate 50 μL aliquots transferred to High Binding, 96 well microplates (Greiner Bio-one, UK) and incubated at 4 °C overnight. Plates were washed 4 times with PBS with 0.05% tween 20 (PBST) and incubated with 1 mM periodic acid diluted in sodium acetate buffer (100 mM sodium acetate, 5 mM EDTA (Sigma-Aldrich, UK), pH 5.5) for 10 min in the dark. Immediately prior to use 50 mM biotin hydrazide (Cayman chemical, UK) in DMSO was diluted 1 in 300 in acetate buffer, 50 μL was then added to each well, pipette mixed, and incubated at room temperature for 45 min at room temperature. Plates were then washed 4 times with PBST for 5 min per wash, incubated for 20 min with 100 μL streptavidin-horse radish peroxidase (HRP) (Thermo Scientific, UK) diluted 1 in 10000 in PBST and then washed 4 times with PBST. Plates were developed with 100 μL of 3,3′,5,5′-tetramethylbenzidine (TMB Easy (Thermo Scientific, UK)) HRP substrate for 10–15 min before the reaction was stopped with 100 μL of 1 M hydrochloric acid. Absorbance was read at 450 nm, and relative concentration was determined against a standard curve prepared from bovine maxillary mucin (MP Biomedcals, UK).
PicoGreen DNA quantification
To allow normalization of mucin quantified by PABH cultures were lysed with RIPA buffer before DNA content was determined by PicoGreen assay (Thermo Fisher, UK). Samples were diluted with tris-EDTA (TE) buffer before being mixed in a 1:1 ratio with PicoGreen solution diluted 1 in 200 in TE. After a 5 min incubation fluorescence was excited at 480 nm and emission read at 520 nm. DNA concentration was determined against a lambda DNA standard curve.
Statistical analysis
All statistical analyses were carried out using GraphPad Prism, version 8.0.2 for Windows. Two-way ANOVA with Sidak’s multiple comparisons was used to analyze flow cytometry data of FSC, TEER data (repeated measures analysis), and qRT-PCR data (-ΔΔCt) of differentiated versus undifferentiated cells. Day 21 2% versus 21% gene expression, flow cytometry percent positive TP63, DNA content, and PABH-determined mucin content were compared using an unpaired, two-tailed student’s T-test. Mucin ELISA data was compared using unpaired, two-tailed, Student’s T-test adjusted for multiple comparisons using the Holm-Sidak method.
Results
Cell isolation and expansion
Cell expansion characteristics were determined for collagen-cultured cells isolated from donor 1 in both standard, air oxygen, 21% O2 culture conditions and in reduced, 2% O2 conditions. Cells with a predominantly epithelial morphology were obtained from the culture in either condition (). Upon continuous passaging, cells in 2% O2 displayed a more uniform morphology while in 21% O2 cells tended to stratify into two distinct populations: higher density epithelial cell colonies (outlined in upper) surrounded by more loosely organized cells. Flow cytometry quantification of the FSC-A characteristic confirmed that 21% cultures consistently had a higher mean FSC-A than 2% cultures (14.5–25.6% higher, statistically significant at all passages measured) () indicating a larger cell size; FSC increased as expected as cells approached growth arrest.
Figure 1. Reduced oxygen culture conditions increased total cell proliferation capacity and promoted a more uniform cell phenotype. (A) Phase contrast images at passages 1, 5, and 10, and at of growth arrest in 2% (upper) or 21% (lower) O2 conditions, population doublings at passage are also indicated on the image. Scale bar: 500 µm. (B) Mean flow cytometry FSC-A comparing relative size at the passage numbers indicated. Data are mean ± standard deviation, n = 3 technical replicates. (C) Cell recovery in 2% or 21% O2 at the passage numbers indicated. Data are mean ± standard deviation, n = 4 technical replicates. (D & E) Cumulative population doublings of cells from donor 1 (D) and donor 2 (E) cultured in 2% or 21% O2 on surfaces coated with type I collagen or with inactivated 3T3J2 feeder cells. ***p ≤ 0.001 ****p ≤ 0.0001.
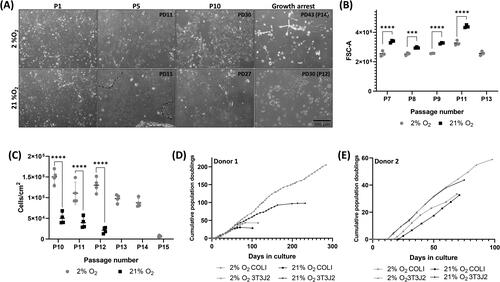
Cell counting at later passages confirmed that significantly higher cell numbers could consistently be recovered from 2% cultures than 21% cultures (). Total proliferative capacity of the cells was assessed by estimating cumulative population doublings (PDs) (), with donor 1 cells cultured in 21% achieving 30 PDs in 14 passages, in comparison 2% cultures were 43% higher, with 43 PDs from 14 passages. Unlike our previous porcine cultures,Citation16 neither condition supported unlimited proliferation.
Donor 1 cells were recovered and expanded on inactivated 3T3-J2 feeder cells and demonstrated increased proliferation in both oxygen conditions, with 21% cultured cells reaching 97 PDs in 200 days before growth arrest. In contrast, 2% cultured cells reached 206 PDs in 284 days with no sign of growth arrest (). In all conditions cells from donor 1 had a longer proliferative lifespan than those from donor 2. Despite a much lower total proliferative capacity, similar growth trends were observed with cells from donor 2, with 3T3 2% > 3T3 21% > COLI 2% > COLI 21%.
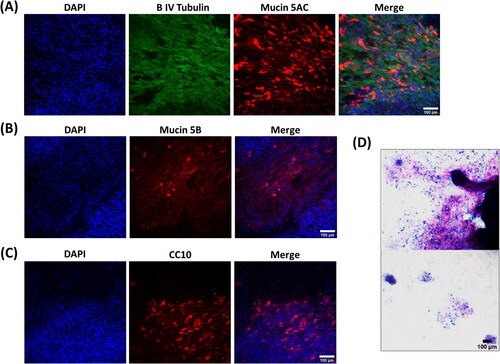
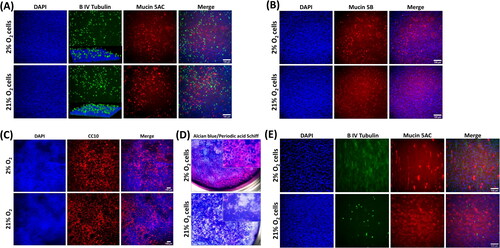
Initial attempts to differentiate donor 1 highly expanded cells resulted in very poor monolayers (). The monolayers had only patchy cell coverage, as indicated by broken regions of DAPI staining ( left panel), a complete absence of ciliation, with any β IV tubulin staining being localized cytoplasmically (). Notably, despite this there was still significant staining for mucin5AC (), mucin5B () and CC10 (), the presence of mucin secretion was further confirmed by positive AB-PAS staining, where cells were present, frequent mucin-positive staining was observed (). As a result of this poor differentiation, the subsequent differentiation data presented herein is focused on early passage cells expanded on collagen-coated tissue culture surfaces.
Figure 2. Lung progenitor cells highly expanded in hypoxia in the presence of 3T3J2 feeder cells differentiate poorly, lack cilia, and favor a pro-secretory phenotype when differentiated at ALI. (A) Immunofluorescence images of cells demonstrating cytoplasmic localization of β IV tubulin, and positive immunofluorescence staining for mucin5AC and (B) mucin5B. (C) Cells also exhibited positive expression of the club cell marker CC10. (D) Alcian blue and periodic acid Schiff histological staining of mucins. Scale bar: 100 µm. Immunofluorescence images are counterstained with DAPI to identify nuclei.
Cell characterization during recovery and expansion
Donor 1 isolated cells at passage 0 were stained for the epithelial cell markers pan-cytokeratin and E-cadherin (), and vimentin and smooth muscle actin () to establish whether initial cultures were predominantly epithelial or were contaminated with fibroblasts or smooth muscle cells. Cells stained positively with Pan cytokeratin and E-cadherin confirming their epithelial origin, positive staining with vimentin and smooth muscle actin was rare in either oxygen condition confirming high epithelial cell selection with our growth conditions.
Figure 3. Recovered cells were characteristic of epithelial progenitor cells. Immunofluorescence images of donor 1 cells at recovery (P0). Cells had a widespread expression of the epithelial markers pan-cytokeratin (A) and E-cadherin (B) and minimal expression of vimentin (A) or smooth muscle actin (C). Cells were also frequently, but not universally, positive for the basal cell marker TP63 (D). Scale bar: 100 µm. Immunofluorescence images are counterstained with DAPI to identify nuclei. (E) Quantification of TP63 expression via image analysis.
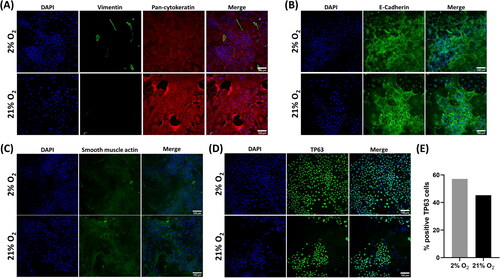
Cultures were then further stained with a TP63 antibody to confirm a progenitor/stem cell identity.Citation18 Positive reactivity was seen throughout the cultures with nuclear localization, except where cells were dividing. As too few cells were available at recovery to perform quantitative analysis via flow cytometry, TP63 expression in recovered cells was semi-quantified via image analysis using the Fiji distribution of ImageJCitation19 to determine the percentage of positive TP63 cells (). As cultures were unevenly distributed across the wells, the whole-well field was imaged as 4 quadrant regions to avoid bias. In the 2% culture, 57% of 2.04x10⁴ cells were TP63 positive compared to 45% of 5.48x10³ cells in the 21% O2 culture.
Expression of epithelial, fibroblastic, and stem cell markers were further assessed in expanded cells at passage 5 (). Widespread expression of pan-cytokeratin () and E-cadherin () was retained. Vimentin expression became more widespread () than at recovery but was concomitant with continued epithelial marker expression and the maintenance of an epithelial morphology, confirming that epithelial cells were expressing vimentin, rather than the presence of contaminating fibroblasts within the culture. TP63 expression () remained widespread, and as with passage 0, tended to be found within colonies of TP63 expressing cells. Along with TP63 expression we also confirmed positive expression of the progenitor cell-associated marker cytokeratin 5Citation20 ().
Figure 4. Culture-expanded cells continue to express characteristic epithelial, basal cell markers. Immunofluorescence images of cells expanded to passage 5. Cells expressed the epithelial markers Pan-cytokeratin (A), vimentin (B), and E-cadherin (C), and basal cell markers TP63 (D) and cytokeratin 5 (E). Scale bar: 100 µm. Immunofluorescence images are counterstained with DAPI to identify nuclei. (D) TP63 expression was quantified using flow cytometry. Data are mean ± standard deviation, n = 3 technical replicates, **p ≤ 0.01.
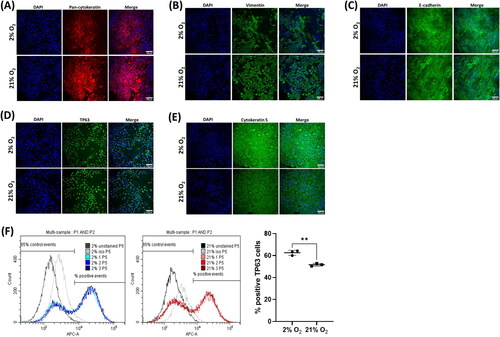
As TP63 expression at P0 appeared to vary between the 2% and 21% conditions, expression was further quantified by flow cytometry, this demonstrated a clear distinction between negative and positive TP63 expressing populations in both oxygen conditions ( left and middle panels). There was significantly different TP63 expression between the oxygen levels at 62.6 ± 2.3% positive in 2% O2 compared to 51.6 ± 1.2% positive in 21% O2 (P ≤ 0.01) ( right panel), similar levels to those determined from image analysis at P0.
Cell differentiation
Cells from both donors were differentiated at ALI with a commercial differentiation medium for 21 days in a 21% O2 environment. In well-differentiated cultures, motile cilia developed on the surface and were visible using light microscopy. Immunocytochemistry confirmed mucociliary differentiation with expression of βIV tubulin (cilia) apically, mucin5AC () and mucin5B () for donor 1 cells. Widespread staining was also present for the club cell marker CC10 (). Histological staining with AB-PAS confirmed extensive mucus production across the culture surface (). Donor 2 cells () exhibited reduced differentiation capacity in both conditions; however, monolayers were less densely packed and ciliation was completely absent in cells expanded in 2% oxygen. In contrast, cilia were sparse but present in 21% expanded cultures. Mucin5AC staining was strongly positive in both culture conditions.
Figure 5. Donor 1 cells expanded in either O2 condition and underwent mucociliary differentiation when cultured in 21% O2 at an air–liquid interface. (A) Immunofluorescence demonstrating positivity for β IV tubulin localized apically (inset is a three-dimensional confocal microscope image), Mucin5AC, and (B) Mucin5B. (C) Cells also had a widespread expression of the club cell marker CC10 in both O2 conditions. (D) Alcian blue and Periodic acid Schiff histological staining that confirmed large amounts of mucin were produced in both culture conditions. (E) β IV tubulin and Mucin5AC immunostaining of differentiated donor 2 cultures. Scale bar: 100 µm. Immunofluorescence images are counterstained with DAPI to identify nuclei.
The levels of differentiation markers MUC5AC, MUC5B, and CC10 were quantitatively examined at the gene expression level, along with TP63 expression, in donor 1 cells. Expression of the cilia marker β IV tubulin was not included as we have commonly observed its widespread expression in the cytoplasm of cells in poorly differentiated cultures (), therefore an increase in a message cannot be correlated with successful differentiation. Both mucins were significantly upregulated in comparison to their undifferentiated counterparts () with higher expression in 2% expanded cells compared to 21% which reached statistical significance (P ≤ 0.05) for MUC5B. Similarly, the club cell marker CC10 was also significantly upregulated by differentiation (). Interestingly, expression of the progenitor cell marker TP63 () was not seen to decrease as a result of the differentiation process. 21% O2 expanded cells had a small and insignificant increase over expression levels in undifferentiated cells following differentiation at 21%, but 2% expanded cell cultures had a moderate and statistically significant (p ≤ 0.001) upregulation in expression compared to their undifferentiated counterparts. This, therefore, resulted in a significant difference between the 2% and 21% expanded cell groups following differentiation (P ≤ 0.05).
Figure 6. Cells expanded in 2% O2 conditions upregulate TP63 expression and demonstrate reduced differentiation with reduced mucous production and lower trans-epithelial electrical resistance (TEER). (A-D) qRT-PCR gene expression analysis for MUC5AC, MUC5B, CC10 and TP63. Graphs show upregulation (-ΔΔCt) normalized to GAPDH expression and expressed relative to matched, undifferentiated cells. Significance indicators above are relative to undifferentiated cells, significance indicated below shows differences at day 21 between oxygen conditions. (E) Mucin 5AC protein produced during ALI differentiation was determined by ELISA. (F) Mucin5B protein produced during ALI differentiation over 28 days was determined by ELISA. (G) TEER of differentiating cells at days 0, 7, 14, and 21. Data are mean ± standard deviation, n = 3 technical replicates for qRT-PCR and Mucin ELISA n = 6 for TEER, *p ≤ 0.05 **p ≤ 0.01 ***p ≤ 0.001 ****≤0.0001.
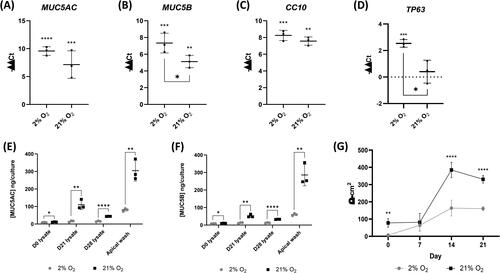
As we had observed differential expression of mucins at the gene level, we quantified secreted and cell-associated mucin protein by ELISA. In contrast to the gene-level data, we found that levels of both mucin 5AC () and mucin 5B () whether secreted and measured by apical wash or determined in the cell lysate, were significantly higher at all-time points in 21% expanded cells than in 2% expanded cells following differentiation at 21% of O2.
We determined the establishment of the barrier function of the monolayers by measuring the TEER every 7 days during the differentiation process (). Monolayers expanded in 21% O2 developed a significantly higher TEER during differentiation than 2% O2 expanded cell monolayers (P ≤ 0.0001), at more than double the Ω·cm2 value at day 14 (2% 163.5 ± 45.7 Ω·cm2, 21% 384.7 ± 44.3 Ω·cm2) and day 21 (2% 160.6 ± 11.1 Ω·cm2, 21% 330.4 ± 22.5 Ω·cm2).
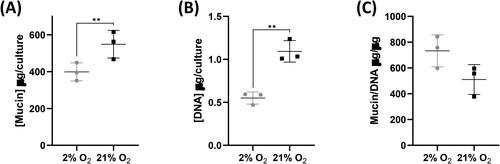
Differentiation, of donor 2 cells in particular, highlighted the variability in cell number in monolayers in different conditions. We, therefore, sought to determine whether normalizing mucin data to DNA content allowed us to better separate the influence of oxygen level on the overall differentiation, from that specifically on mucin level. As with mucin ELISA on donor 1 cells, total mucin was significantly higher in apical washes of 21% cultures (P ≤ 0.01) (); however, as expected, the DNA content of these was also significantly higher (P ≤ 0.01) (). Normalization of mucin to DNA showed a trend for higher normalized mucin production by 2% cells than by 21% cells ().
Figure 7. Normalized mucin production is greater in 2% O2 cells. (A) Total mucin content of apical washes of cultures at day 21 of differentiation. (B) Total DNA content of cultures at day 21 of differentiation. (C) Apical wash mucin content normalized to DNA content (μg/μg). Data are mean ± standard deviation, n = 3 technical replicates, **p ≤ 0.01.
Discussion
Over the past two decades, there has been a stepwise improvement in the knowledge that has supported the development of biologically relevant in vitro lung models to the point where these can now be considered representative of both healthy and diseased tissue. Here we have described a technique to isolate and culture-expand TP63/cytokeratin 5 positive progenitor cells from COPD donor lung tissue. We have compared the proliferation and in vitro differentiation capacity of the cells following expansion in standard culture conditions (21% O2 ambient air incubator) and reduced oxygen culture conditions (2% O2 tri-gas controlled incubator), better reflecting a disease-associated pathological environment. Overall, we noted an increased proliferative capacity in cells expanded in reduced oxygen, with culture in 2% O2, supplementation with Y-27632 and growth on 3T3-J2 mitotically inactivated feeders that could result in immortalization. However, we concomitantly saw an altered differentiation capacity where 2% O2 expansion of cells prior to differentiation in ALI conditions at 21% O2 resulted in reduced differentiation, with markedly reduced cilia, mucin production, and barrier function. Overall, our results suggest that hypoxia exposure promotes a proliferative phenotype and concurrently impaired differentiation in these cells.
Cells are highly oxygen-sensitive, reduced oxygen can lead to both pro- and anti-proliferative responses dictated by cell type and circumstance.Citation9 Stem cell proliferation and maintenance of the undifferentiated state is reliant upon multiple signals from the stem cell niche, often including those generated by reduced oxygen conditions.Citation21–24 Similarly, the impact on differentiation of hypoxia-related signaling is widespread and variable. Mouse embryonic stem cell differentiation toward respiratory lineage cells can be promoted by hypoxia but is sensitive to both extent and duration,Citation25 and both human and mouse lung and airway progenitor cell fate is influenced by hypoxia with both potentially protective and pathological changes.Citation26,Citation27
The in vitro growth of cells from the lungs is reliant on the expansion of a progenitor cell population; in vivo these populations are responsible for tissue repair, cellular homeostasis, and thus function. Typically, respiratory progenitor cells are TP63 and cytokeratin 5 positive, identifying progenitor cell types from both the proximal (basal cells) and more distal airways with further variation occurring in sub-populations of these cells.Citation28,Citation29 We observed culture heterogeneity with widespread cytokeratin 5 positivity but more limited TP63 expression, with the TP63 positive cell fraction larger, both at isolation and following expansion in 2% O2. Zhao et al have described a cytokeratin 5 positive/TP63 negative population arising from double positive cells following engraftment in a bleomycin-injured mouse lung model,Citation30 suggesting that reduced oxygen may be inhibiting lineage progression in our cultures. Inhibition of the differentiation of cytokeratin 5 progenitors consequently impairs alveolar epithelial barrier formation,Citation30 something that we also observed, with reduced ALI TEER in 2% cultured cells.
Despite its use as a marker of epithelial stem cells the role of TP63 in lung homeostasis has yet to be well defined. Two principal variants exist: transactivating domain, or TA isoforms (1, 3, 5, 7, 9, 11) and ΔN (2, 4, 6, 8, 10, 12) isoforms lacking the N-terminal transactivating domain. There are reports that ΔN is the dominant variant in the lung;Citation31 however, in agreement with others, we saw the widespread expression of the TA variant in our cells.Citation32,Citation33 In mouse studies of DASCs the Tap63α isoform has been undetectable until 7 days post-infection with influenza virus, rapidly becoming more numerous in areas of damaged lung and decreasing following disease resolution suggesting that it is associated with a damage resolution response.Citation34 Interestingly, we also observed an upregulation of TP63 in reduced oxygen suggesting a similar response in our human lung progenitors. However; subsequent differentiation of these cells at restored ambient oxygen remained poor in comparison to cells cultured in standard oxygen conditions, with sustained upregulation of TP63, suggestive of an unresolved response to the hypoxic insult.
While there is increasing evidence that a TP63+/KRT5+ cell population contributes to the healing response of the damaged lung,Citation20,Citation35–39 the presence of aberrant progenitor populations and altered differentiation in these damage-responsive cells may also be contributing significantly to changes associated with COPD. Rao et al describe a clone-dependent variation in the differentiation behavior of cells from COPD and normal lung. COPD lung yields greater total numbers of TP63+/KRT5+ proliferative clones with a much greater tendency toward aberrant differentiation, including goblet cell metaplasia, squamous cell metaplasia, and pro-inflammatory squamous cell metaplasia; all typical changes seen in COPD lungs.Citation40 Many of these changes likely result in hypersecretion, changes in mucous mucin content, and altered mucus hydration, altering the biophysical properties of mucus and contributing, alongside altered ciliation and ciliary beat frequency, to impaired mucociliary clearance efficiency.Citation41 This has particular relevance in chronic bronchitis patients who experience greater morbidity and mortality.Citation42,Citation43 The role of hypoxia in these changes has received little interrogation despite its prevalence in lung disorders, including COPD. Typically in the healthy lung mucin5B is the predominant mucin at approximately 10 times higher levels than mucin5AC.Citation44 Mucin5AC, while remaining the lesser mucin, proportionally increases in quantity with progression from the distal to more proximal airways.Citation45 In COPD patients the concentration of both mucins can be elevated, with the increase in mucin5AC being disproportionately higher.Citation46 Interestingly, despite our ALI differentiation being induced in 21% oxygen, at the gene level we observed a trend for increased expression of MUC5AC and a significant increase in MUC5B in cells previously expanded in reduced oxygen. It has been observed in cell line-based studies that in keeping with the presence of a hypoxia response element (HRE), hypoxia can directly induce MUC5AC via HIF signaling;Citation47,Citation48 our results, where we see a sustained impact of hypoxia on later normoxic differentiation, suggest that an additional mechanism, perhaps involving epigenetic changes, may be contributing to sustained alterations in differentiation capacity.
Club cells, as identified herein by robust CC10 expression, were common in both 2% and 21% differentiated cultures and are largely absent in proximal airways,Citation49 confirming that we have retained a distal, bronchiolar airway phenotype during expansion and differentiation. Interestingly co-expression of mucins and CC10 has been observed in airways, again more common distally, these cells would have the potential to further contribute to a secretory disease phenotype.Citation49
It is important to note that our observations at this stage are limited by the use of only two donors, both with emphysematous lung disease. However, we saw similar responses in our previous porcine work indicating potential cross-species responses.Citation16 Work is ongoing to extend our analyses to further samples across healthy, bronchitic, and emphysematic patients in order to allow for increased statistical power to detect more subtle changes, in the context of a model that is frequently highly variable.
In conclusion, while hypoxia increased the proliferative capacity of our cells, it also impaired their subsequent differentiation capacity. After extensive expansion in hypoxia aberrant differentiation was observed, where ciliation could be lost completely, while differentiation down secretory pathways with CC10, mucin5AC, and mucin5B positive cells was disproportionally retained, leading to an imbalance favoring excessive secretions. The effect of this imbalance has significant implications for epithelial repair and mucociliary clearance efficiency, and therefore the biological alterations and symptoms seen in COPD patients.
Acknowledgements
The authors would like to acknowledge the support of the UHNM theatre staff, Dr. Sana Iftikhar and Dr. Daniel Gey van Pittius for their assistance in acquiring participant lung tissue.
Disclosure statement
The authors declare no conflict of interest.
Additional information
Funding
References
- Varmaghani M, Dehghani M, Heidari E, Sharifi F, Moghaddam SS, Farzadfar F. Global prevalence of chronic obstructive pulmonary disease: systematic review and meta-analysis. East Mediterr Health J. 2019;25(1):47–57. doi:10.26719/emhj.18.014.
- Soriano JB, Kendrick PJ, Paulson KR, et al. Prevalence and attributable health burden of chronic respiratory diseases, 1990–2017: a systematic analysis for the Global Burden of Disease Study 2017. Lancet Respir Med. 2020;8(6):585–596. doi:10.1016/S2213-2600(20)30105-3.
- World Health Organisation. (2020, November 9). The top 10 causes of death. https://www.who.int/news-room/fact-sheets/detail/the-top-10-causes-of-death.
- Quaderi SA, Hurst JR. The unmet global burden of COPD. Glob Health Epidemiol Genomics. 2018;3:e4 doi:10.1017/gheg.2018.1.
- Ehteshami-Afshar S, FitzGerald JM, Doyle-Waters MM, Sadatsafavi M. The global economic burden of asthma and chronic obstructive pulmonary disease. Int J Tuberc Lung Dis. 2016;20(1):11–23. doi:10.5588/ijtld.15.0472.
- Soriano JB. An epidemiological overview of chronic obstructive pulmonary disease: what can real-life data tell us about disease management? COPD. 2017;14(sup1):S3–S7. doi:10.1080/15412555.2017.1286165.
- Ghosh M, Miller YE, Nakachi I, et al. Exhaustion of airway basal progenitor cells in early and established chronic obstructive pulmonary disease. Am J Respir Crit Care Med. 2018;197(7):885–896. doi:10.1164/rccm.201704-0667OC.
- Randell SH. Airway epithelial stem cells and the pathophysiology of chronic obstructive pulmonary disease. Proc Am Thorac Soc. 2006;3(8):718–725. doi:10.1513/pats.200605-117SF.
- Torres-Capelli M, Marsboom G, Li QOY, et al. Role of Hif2α oxygen sensing pathway in bronchial epithelial club cell proliferation. Sci Rep. 2016;6(1):25357. doi:10.1038/srep25357.
- Schumacker PT. Lung cell hypoxia. Proc Am Thorac Soc. 2011;8(6):477–484. doi:10.1513/pats.201103-032MW.
- Barbera JA, Roca J, Ferrer A, et al. Mechanisms of worsening gas exchange during acute exacerbations of chronic obstructive pulmonary disease. Eur Respir J. 1997;10(6):1285–1291. doi:10.1183/09031936.97.10061285.
- Page LK, Staples KJ, Spalluto CM, Watson A, Wilkinson TMA. Influence of hypoxia on the epithelial-pathogen interactions in the lung: implications for respiratory disease. Front Immunol. 2021;12:653969. doi:10.3389/fimmu.2021.653969.
- Yang YY, Lin CJ, Wang CC, Chen CM, Kao WJ, Chen YH. Consecutive hypoxia decreases expression of NOTCH3, HEY1, CC10, and FOXJ1 via NKX2-1 downregulation and intermittent hypoxia-reoxygenation increases expression of BMP4, NOTCH1, MKI67, OCT4, and MUC5AC via HIF1A upregulation in human bronchial epithelial cells. Front Cell Dev Biol. 2020;8:572276. doi:10.3389/fcell.2020.572276.
- Rus A, Peinado MÁ, Castro L, Del Moral ML. Lung eNOS and iNOS are reoxygenation time-dependent upregulated after acute hypoxia. Anat Rec (Hoboken). 2010;293(6):1089–1098. doi:10.1002/ar.21141.
- Shen CY, Lee JF, Su CL, Wang D, Chen CF. Hypoxia and reoxygenation of the lung tissues induced mRNA expressions of superoxide dismutase and catalase and interventions from different antioxidants. Transplant Proc. 2008;40(7):2182–2184. doi:10.1016/j.transproceed.2008.07.080.
- Dale TP, Borg D’anastasi E, Haris M, Forsyth NR. Rock inhibitor Y-27632 enables feeder-free, unlimited expansion of Sus scrofa domesticus Swine Airway stem cells to facilitate respiratory research. Stem Cells Int. 2019;2019:3010656. doi:10.1155/2019/3010656.
- Abdullah LH, Wolber C, Kesimer M, Sheehan JK, Davis CW. Studying mucin secretion from human bronchial epithelial cell primary cultures. Methods Mol Biol Clifton NJ. 2012;842:259–277. doi:10.1007/978-1-61779-513-8_16.
- Yang Y, Riccio P, Schotsaert M, et al. Spatial-temporal lineage restrictions of embryonic p63+ progenitors establish distinct stem cell pools in adult airways. Dev Cell. 2018;44(6):752–761.e4. doi:10.1016/j.devcel.2018.03.001.
- Schindelin J, Arganda-Carreras I, Frise E, et al. Fiji: an open-source platform for biological-image analysis. Nat Methods. 2012;9(7):676–682. doi:10.1038/nmeth.2019.
- Zuo W, Zhang T, Wu DZ, et al. p63(+)Krt5(+) distal airway stem cells are essential for lung regeneration. Nature. 2015;517(7536):616–620. doi:10.1038/nature13903.
- Hubbi ME, Semenza GL. Regulation of cell proliferation by hypoxia-inducible factors. Am J Physiol Cell Physiol. 2015;309(12):C775–C782. doi:10.1152/ajpcell.00279.2015.
- Forsyth NR, Musio A, Vezzoni P, Simpson AHRW, Noble BS, McWhir J. Physiologic oxygen enhances human embryonic stem cell clonal recovery and reduces chromosomal abnormalities. Cloning Stem Cells. 2006;8(1):16–23. doi:10.1089/clo.2006.8.16.
- Grayson WL, Zhao F, Bunnell B, Ma T. Hypoxia enhances proliferation and tissue formation of human mesenchymal stem cells. Biochem Biophys Res Commun. 2007;358(3):948–953. doi:10.1016/j.bbrc.2007.05.054.
- Kay AG, Dale TP, Akram KM, et al. BMP2 repression and optimized culture conditions promote human bone marrow-derived mesenchymal stem cell isolation. Regen Med. 2015;10(2):109–125. doi:10.2217/rme.14.67.
- Pimton P, Lecht S, Stabler CT, Johannes G, Schulman ES, Lelkes PI. Hypoxia enhances differentiation of mouse embryonic stem cells into definitive endoderm and distal lung cells. Stem Cells Dev. 2015;24(5):663–676. doi:10.1089/scd.2014.0343.
- Shivaraju M, Chitta UK, Grange RMH, et al. Airway stem cells sense hypoxia and differentiate into protective solitary neuroendocrine cells. Science. Published Online. 2021;371(6524):52–57. doi:10.1126/science.aba0629.
- Xi Y, Kim T, Brumwell AN, et al. Local lung hypoxia determines epithelial fate decisions during alveolar regeneration. Nat Cell Biol. 2017;19(8):904–914. doi:10.1038/ncb3580.
- Schilders KAA, Eenjes E, van Riet S, et al. Regeneration of the lung: lung stem cells and the development of lung mimicking devices. Respir Res. 2016;17(1):44. doi:10.1186/s12931-016-0358-z.
- Smirnova NF, Schamberger AC, Nayakanti S, Hatz R, Behr J, Eickelberg O. Detection and quantification of epithelial progenitor cell populations in human healthy and IPF lungs. Respir Res. 2016;17(1):83. doi:10.1186/s12931-016-0404-x.
- Zhao Z, Zhao Y, Zhou Y, Wang X, Zhang T, Zuo W. Single-cell analysis identified lung progenitor cells in COVID-19 patients. Cell Prolif. 2020;53(12):e12931. doi:10.1111/cpr.12931.
- Warner SMB, Hackett TL, Shaheen F, et al. Transcription factor p63 regulates key genes and wound repair in human airway epithelial basal cells. Am J Respir Cell Mol Biol. 2013;49(6):978–988. doi:10.1165/rcmb.2012-0447OC.
- Chilosi M, Poletti V, Murer B, et al. Abnormal re-epithelialization and lung remodeling in idiopathic pulmonary fibrosis: the role of ΔN-p63. Lab Invest. 2002;82(10):1335–1345. doi:10.1097/01.LAB.0000032380.82232.67.
- Li J, Pan C, Tang C, Tan W, Zhang W, Guan J. miR-184 targets TP63 to block idiopathic pulmonary fibrosis by inhibiting proliferation and epithelial–mesenchymal transition of airway epithelial cells. Lab Invest. 2021;101(2):142–154. doi:10.1038/s41374-020-00487-0.
- Tan, Ler, Gunaratne, et al. Insights into early recovery from influenza pneumonia by spatial and temporal quantification of putative lung regenerating cells and by lung proteomics. Cells. 2019;8(9):975. doi:10.3390/cells8090975.
- Zhou Y, Qing Shi Y, Yang L, et al. Genetically engineered distal airway stem cell transplantation protects mice from pulmonary infection. EMBO Mol Med. 2020;12(1):e10233. doi:10.15252/emmm.201810233.
- Shi Y, Dong M, Zhou Y, et al. Distal airway stem cells ameliorate bleomycin-induced pulmonary fibrosis in mice. Stem Cell Res Ther. 2019;10(1):161. doi:10.1186/s13287-019-1257-2.
- Wang Y, Lu Y, Wu Y, et al. Alveolar differentiation potency of human distal airway stem cells is associated with pulmonary pathological conditions. Stem Cells Int. 2019;2019:7123078. doi:10.1155/2019/7123078.
- Kumar PA, Hu Y, Yamamoto Y, et al. Distal airway stem cells render alveoli in vitro and during lung regeneration following H1N1 influenza infection. Cell. 2011;147(3):525–538. doi:10.1016/j.cell.2011.10.001.
- Wang X, Zhao Y, Li D, et al. Intrapulmonary distal airway stem cell transplantation repairs lung injury in chronic obstructive pulmonary disease. Cell Prolif. 2021;54(6):e13046. doi:10.1111/cpr.13046.
- Rao W, Wang S, Duleba M, et al. Regenerative metaplastic clones in COPD lung drive inflammation and fibrosis. Cell. 2020;181(4):848–864.e18. doi:10.1016/j.cell.2020.03.047.
- Tarran R, Sabater JR, Clarke TC, et al. Nonantibiotic macrolides prevent human neutrophil elastase-induced mucus stasis and airway surface liquid volume depletion. Am J Physiol Lung Cell Mol Physiol. 2013;304(11):L746–L756. doi:10.1152/ajplung.00292.2012.
- Kim V, Criner GJ. Chronic bronchitis and chronic obstructive pulmonary disease. Am J Respir Crit Care Med. 2013;187(3):228–237. doi:10.1164/rccm.201210-1843CI.
- Kim V, Sternberg AL, Washko G, National Emphysema Treatment Trial Research Group, et al. Severe chronic bronchitis in advanced emphysema increases mortality and hospitalizations. COPD. 2013;10(6):667–678. doi:10.3109/15412555.2013.827166.
- Kesimer M, Ford AA, Ceppe A, et al. Airway mucin concentration as a marker of chronic bronchitis. N Engl J Med. 2017;377(10):911–922. doi:10.1056/NEJMoa1701632.
- Denneny E, Sahota J, Beatson R, Thornton D, Burchell J, Porter J. Mucins and their receptors in chronic lung disease. Clin Transl Immunology. 2020;9(3):e01120. doi:10.1002/cti2.1120.
- Radicioni G, Ceppe A, Ford AA, et al. Airway mucin MUC5AC and MUC5B concentrations and the initiation and progression of chronic obstructive pulmonary disease: an analysis of the SPIROMICS cohort. Lancet Respir Med. 2021;9(11):1241–1254. doi:10.1016/S2213-2600(21)00079-5.
- Zhou X, Tu J, Li Q, Kolosov VP, Perelman JM. Hypoxia induces mucin expression and secretion in human bronchial epithelial cells. Transl Res. 2012;160(6):419–427. doi:10.1016/j.trsl.2012.08.001.
- Kim YJ, Cho HJ, Shin WC, Song HA, Yoon JH, Kim CH. Hypoxia-mediated mechanism of MUC5AC production in human nasal epithelia and its implication in rhinosinusitis. PLoS One. 2014;9(5):e98136. doi:10.1371/journal.pone.0098136.
- Boers JE, Ambergen AW, Thunnissen FB. Number and proliferation of clara cells in normal human airway epithelium. Am J Respir Crit Care Med. 1999;159(5 Pt 1):1585–1591. doi:10.1164/ajrccm.159.5.9806044.