
Abstract
Aim
To determine the degree of stability in the Gross Motor Function Classification System (GMFCS) for children with cerebral pares (CP) and to analyze factors associated with changes of the over time, in Stockholm between the year 2000 and 2019.
Method
A register study on 768 children with at least two GMFCS ratings, linear regression analysis was used to study factors associated to a change in GMFCS level.
Results
72% of the children kept the same GMFCS level. A change in GMFCS level was most common for children in GMFCS level II (68%). The first change in GMFCS level happened most commonly between the ages 2 and 4. Initial GMFCS level (Beta 0.127; p < 0.001) and one or more intensive training periods with a physiotherapist (Beta 0.097; p = 0.018) were associated with a change in GMFCS level.
Interpretation
Most children with CP remain stable in their GMFCS level, but for those classified in level II, a change occurs for almost seven out of ten. Classifications made before the child turns four are less certain than those made later. Further studies are needed to clarify if occurrence of intensive training is the cause or result of the change in GMFCS level.
Cerebral palsy (CP) is the collective term for a disability caused by a brain injury occurring before the age of two. In Sweden, approximately 115,000–120,000 children are born each year, of whom about 200 are diagnosed with CP (Socialstyrelsen, Citation2019). There are many different causes for CP and the degree of disability varies from those who have almost normal function to others who have a significant disability. People with CP often have spasticity (increased tendon reflex activity) in some muscles while other muscles may be weakened (Himmelmann & Uvebrant, Citation2014; Rosenbaum et al., Citation2007).
The Gross Motor Function Classification System (GMFCS) is a 5-level classification system that describes gross motor function in children and adolescents with cerebral palsy based on their self-initiated movements (Palisano et al., Citation2008). Differences between levels are based on functional abilities, the need for supportive technology including hand-held moving aids (crutches, sticks or rollers) or wheel-borne movement and, to a much lesser extent, movement quality. GMFCS contains five age ranges which are prior to the 2nd birthday, between 2nd and 4th birthdays, between 4th and 6th birthdays, between 6th and 12th birthdays and between the 12th and 18th birthdays. The focus of GMFSC is to determine which level best represents the child's or youth's current abilities and limitations of gross motor function (Palisano et al., Citation2008). This classification has been used previously in studies of CP when describing patterns for gross motor development for children (Rosenbaum et al., Citation2002). This is an ordinal scale, where the distance between levels should not be considered as meaning equal (Palisano et al., Citation2008).
Several previous studies have established the reliability and validity of the GMFCS (Godwin et al., Citation2009; Gray et al., Citation2010; Palisano et al., Citation2008). Studies found that the intra- and inter-reliability is almost excellent with high ICC’s together with low SEM’s across all levels (I-V) (e.g. Ko & Kim, Citation2013). This indicates that the system can be used in clinical settings (Palisano et al., Citation1997) and in research (Wood & Rosenbaum, Citation2000, Bodkin et al., Citation2003). Interestingly, GMFCS shows almost perfect kappa agreement between different raters, and also excellent agreement with previous assigned GMFCS scores using previous video tapes, indicating that conduction of longitudinal research is possible (Mayson et al., Citation2013). In theory, the GMFCS is thought to be stable over time and could therefore be used for the prognosis of the child’s functional level and the allocation of resources on a system level over time, but studies have shown that the GMFCS is not as stable over time as initially expected. For example, Palisano et al. (Citation2006) examined the stability of GMFCS level over time for 610 children in Canada and found that 73% of the children remained in the same GMFCS level through the whole follow-up period. In the southern region of Sweden (Skåne and Blekinge) Alriksson-Schmidt et. al (2017) examined the stability of GMFCS level for 736 children and showed that 56% of the children were considered to maintain the same GMFCS level in all their follow-ups during childhood. The other 44% changed GMFCS level at least once, with a range of between one and eight changes. 74% of the participants received the same GMFCS level at their first and their last registered follow-up which means that 133 of the 324 children who changed GMFCS levels at some time had shifted back to their original level at the end of the study. This discrepancy in the results of studies highlights the need for further studies into the stability of GMFCS levels over time and to explore the factors which are associated with changes in GMFCS. For this purpose, it is important to study these factors continuously during the child’s development.
Palisano et al. (Citation2006) showed that children at initial GMFCS level I and V had the least probability of changing in their GMFCS levels. They also saw a tendency that among the children who had a change in level before the age of 6, these often changed to a higher level, i.e. a lower level of function. Wood and Rosenbaum (Citation2000) found that children generally stayed at the same GMFCS level from 1–2 years up to 6–12 years of age. Rutz et al. (Citation2012) found it stabile after single-event multilevel surgery and showed that although gait function partly was improved GMFCS remained stable for 95% of the children. These discrepancies regarding associated factors such as initial GMFCS level and age show again that there is a need for new data. Thus, besides these personal factors it is important also to investigate the effects of other factors such as medical and physiotherapeutic interventions on GMFCS levels. Therefore, the aim of the present study, was to determine the stability in the GMFCS for children with cerebral palsy (CP) in Stockholm and to analyze factors associated with change in level over time, between the years 2000 and 2019.
Methods
Design
The study is a retrospective analysis of data in The Cerebral Palsy follow-up program (CPUP) from the Stockholm region. The CPUP database is a Swedish national quality register that started 1994 (CPUP, Citation2019a, Citation2019b). Assessments according to a standardized template in CPUP are performed by a physiotherapist and an occupational therapist who examine passive range of motion, function, current treatment, and GMFCS once or twice a year (CPUP, Citation2019a). Ethical approval was obtained from the Regional Ethical Review Board in Lund, Sweden (LU-443-99).
Participants
875 children were identified in the database for Stockholm County from January 2000–February 2019. Inclusion criteria were the diagnosis of CP and at least two GMFCS ratings in the CPUP database. The final sample for analysis included 768 children. The average child’s data time frame in the CPUP was 6 years with a range of 1 to 12 years (See flow-chart in ). The children included in this study were born between the years 2000 and 2017, with the majority being born between 2003 and 2012 (). The number of assessments per child ranged between 2–15 ratings, with the largest group of children having 7 assessments (12.5%), followed by the group of children with 9 assessments (11.5%), (). The number of assessments per child was not associated to GMFCS level but dependent on the age of the child, since the assessments were performed on about a yearly basis, i.e. the older the child, the higher the number of assessments.
Figure 1. Flowchart for inclusion, in numbers
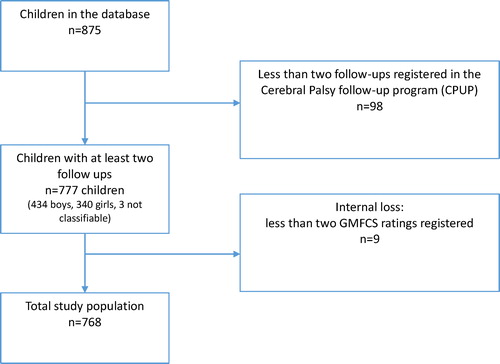
Table 1. Children’s year of birth.
Table 2. Number of GMFCS ratings per child.
Assessors
In the total database (875 children), 196 registered physiotherapists performed 5932 classifications. The vast majority (84%) of these classifications were performed by one assessor, the remaining 16% were performed by two assessors. The mean of number of classifications per assessor was 30 assessments (median 25; range 1–196). This shows that many of the assessors were clinically active over a long period of time. Only 25 assessors had performed less than 2 assessments.
Data Analysis
In the first step, we calculated the proportion of children with a change in GMFCS level for the total group, for each GMFCS level separately and for the different ages. The difference in GMFCS level was counted as the number of levels the child shifted up or down, by taking the level from the last assessment minus the level of the first assessment that was available in the database. Moreover, we calculated the mean GMFCS-SD (and standard deviation (SD)) for each GMFCS level and since GMFCS-SD was not normally distributed, both the median (25–75 percentile) and the mean (SD).
In the second step we analyzed the factors associated with change of GMFCS level. The following factors were tested: 1) Personal factors: Date of birth (month/year) and date of assessment (month/year) for calculating the child’s age at first and last assessment, the assessor, and initial GMFCS level. 2) Ongoing or newly instituted medical interventions since the previous assessment: Surgery that affect tonus (spasticity - for example scoliosis operation, shunt operation or PEG), botoulinumtoxin injections, spasticity reducing medicine, selective dorsal rhizotomy (SDR)-operation, serial casting, fractures, use of orthosis) (yes/no), and physiotherapy interventions since the previous assessment: 3) Intensive training periods) (yes/no) (CPUP, Citation2019a). Intensive training periods was defined as a higher frequency than usual for a limited time period, e.g. individual strength training, aqua- or hippo therapy.
Finally, according to the methods described by Palisano et al. (Citation2006), linear regression analyses were performed to investigate if these factors were associated with a change in the GMFCS level (GMFCS-SD). The dependent variable was the standard deviation (SD) for each child which is a measure of stability, where a low SD indicates high stability (Palisano et al., Citation2006). In the univariate analysis, the variables that tended to be associated with GMFCS-SD (p-value < 0.157), were included in an initial multivariate model if not correlated with each other (Heinze & Dunkler, Citation2017). If two variables had a correlation value of ≥ 0.6 (Walker & Almond, Citation2010), the variable with the higher explanatory value (R2) was chosen. Significant variables from the initial model were analyzed again in a final regression model (Hosmer et al., Citation2013). Here, the significance level was set at a p-value ≤ 0.05.
Results
Stability of GMFCS
The distribution between the GMFCS levels at the first follow-up was 49.5% in level I, 12.2% level II, 8.5% level III, 13.2% level IV and 16.7% in level V (). The total number of GMFCS ratings in the study was 5,152 with the average of 6.7 ratings per child. Of the 768 children, 551 (71.7%) remained at the same GMFCS level throughout the follow-up period (). Initial GMFCS level II was the most common level in which a change occurred during the follow-up period (68%), and the second most common was level IV. A total of 616 children (80%) were rated at the same level in the first and last assessments (). There could have been a change in GMFCS level during the follow-up period, but these were rated at the same level in the first and most recent registered CPUP assessments. It was most common that a change in GMFCS level occurred between 2–4 years of age. 12.9% of all changes during the follow-up period occurred at two years of age, 19.4% at three years of age and 15.7% at four years of age. 50% of all changes occurred before the age of 5. Only 12 children (1.6%) changed more than 1 level ().
Table 3. Absolute number and percentage of children without change of GMFCS level and those with change, divided by level at first assessment, number (n) and percentage (% and median, mean and SD of the standard deviation of change of GMFCS level expressed against initial GMFCS level.
Table 4. Cross-tabulation of GMFCS level at first and last assessment, in absolute numbers. Numbers in bold indicate the total amount of children with similar GMFCS level at first and last assessment.
Factors Associated with Change in GMFCS Level
In the univariate analysis there were seven variables associated with a change in GMFCS level (p-value <0.157) (). Based on the seven initial significant variables, a first model for multiple regression analysis was built, including five variables (). The use of orthosis and physiotherapeutic interventions variables was excluded because these were significantly correlated with the number of GMFCS ratings (r = 0.78 and 0.84, respectively). Physiotherapeutic interventions also correlated significantly with intensive training period (r = 0.60). In the final model (), three variables were included but only two remained positively associated with a change in GMFCS level. Those were: 1) the initial GMFCS level that a child was classified in (Beta 0.127; p < 0.001) and 2) one or more intensive training periods with a physiotherapist (Beta 0.097; p = 0.018). The R2 reached 0.048 and 0.047 for the initial and final models, respectively.
Table 5. Linear regression. Univariate analysis for the association with GMFCS-SD (dependent variable) and personal and treatment-related factors. Number of children in the analysis (n), median, minimum and maximum (min - max), for those who had changed and those who did not change GMFCS level during the follow-up period). The standardized regression coefficient (beta), 95% confidence interval (95%CI) for beta and p-value.
Table 6. Multiple regression analysis for the relationship between significant personal and treatment-related variables from the initial model and GMFCS-SD (dependent variable). The regression coefficient (beta), 95% confidence interval for beta and p-value in initial and final model.
Discussion
The purpose of this study was to determine the stability in the GMFCS for children with cerebral palsy in Stockholm and to analyze factors associated with changes in level of gross motor function over time between the years 2000 and 2019. In our study, 72% of the children were classified at the same GMFCS level throughout the follow-up time, indicating that the GMFCS is useful in clinical work and this finding was similar to the study of Palisano et al. (Citation2006). However, Alriksson-Schmidt et al. (Citation2017) found a lower proportion with stable GMFCS level (56%) than in our study. This is interesting, since it was a study from the same database but from another area in Sweden. The median value for the number of changes was 2 in the study of Alriksson-Schmidt et al. (Citation2017) (minimum 1, maximum 8) compared to the median value of 1 change per child (minimum 1, maximum 7) in our study. The reason for these differences remains unknown, but besides regional differences, one reason could be that, in their study, the birth cohort ranged from 1990 until 2007, while our study is based on more recent data (Alriksson-Schmidt et al., Citation2017). In their cohort, only 40% (317/791) were at level I initially compared 49% in our study (380/768) and, as our regression analyses showed, children in level I were less likely to change GMFCS level compared to other levels. The difference in initial level could be due to the increased use of successful health care practices and new treatments, such as cooling therapy (Westbom & Hagglund, Citation2018).
Our findings indicate that it was most common that a change occurred for children initially classified as GMFCS level II, and the first change in GMFCS level most often occurred between the ages of 2–4, which also was found previously (Palisano et al., Citation2006). The need for reclassification has also been seen in a previous study (Gorter et al., Citation2009). These results are not surprising, since a child’s development is large during these years and confirmation of the diagnosis can be difficult before the age of 5 (Cans et al., Citation2007). Palisano et al. (Citation2006) discuss that it is more likely that children's changes in gross motor function are reflected within the classification levels in GMFCS rather than between levels, and therefore GMFCS can be considered stable and useful in standardized clinical follow-ups.
Another important factor was that one or more intensive training periods with a physiotherapist was positively correlated with changes in GMFCS level. However, the results from the logistic regression analyses should not be interpreted as that there exists a causal relationship between intensive training periods and a change in GMFCS level. The low R2 values indicate that there several other factors excist, factors that were not included in the CPUP that are associated with a change in GMFCS. The GMFCS-SD indicates a change in GMFCS, but one cannot draw any conclusions on the direction of the change, if there was an improvement or a deterioration. The change in GMFCS could have been the reason for or the result of an intensive training period. It remains unclear whether it possible to improve function sufficiently with physical training to get an improvement in level. Further studies are needed in this area.
Another important aspect that could be related to a change in GMFCS level is a concurrent diagnosis. If successful treatment for such additional medical condition is provided, the child’s functional level could be increased, whereas a progressive comorbidity could lead to a deterioration in function. The presence of concurrent diagnosis is currently not provided in the register and therefore it was not possible to include this in the analyses (CPUP, Citation2019a, Citation2019b).
Our findings support the use of continued ratings with GMFCS. When talking to parents, for example, users should keep in mind that stability does vary depending on the above-mentioned factors and that this information should be communicated.
Methodological Considerations
This large database covers a 17-year period, which could be seen as a major strength. The study sample consists of children in a wide range of age living in the area of Stockholm, Sweden, and could be considered representative for children with CP diagnosis. However, because of the long time-period, many children will not have had the same assessor the whole time, which could have influenced the results. On the other hand, our data showed that a change in the therapist who performed the assessment had no correlation with change in GMFCS level in this study (; p = 0.432), nor did it in others (Alriksson-Schmidt et al., Citation2017; Palisano et al., Citation2018; Wood & Rosenbaum, Citation2000) and in 2013, Mayson et al found the inter- and intra-reliability of the GMFCS to be sufficient for longitudinal analyses (Mayson et al., Citation2013).
The present study used GMFCS-SD to measure changes of the child’s classification of function over time. The GMFCS is an ordinal scale and, theoretically, the different levels cover different ranges of motor function. Only children with a change of GMFCS level get a value for SD. Thus, the mean value indicates a measure of change for each GMFCS level independent on the direction of change. In this study a change from level II to level I was most common, that is a difference of walking with or without limitations. Maybe that change is most common because it is hard to predict at an early age what the limitations of walking will be later in life. Children with cerebral palsy have a slower motor development than other children, so learning to walk without a walker may take longer or not seem to be possible at first. The other levels, especially I and V might be easier to differentiate from the start. The use of the standard deviation of the GMFCS (GMFCS-SD) as a measure of change can be seen as a methodological drawback, since the data are not ratio data and was not normally distributed (75% of the children showed a stable GMFCS). On the other hand, Palisano et al. (Citation2006) used also the SD methodology as an indicator of stability and we have replicated this methodology to enhance the comparability of the studies. Moreover, it could be the case that an improvement in function could in one level lead to a change in level, while a similar improvement in function does not lead to a change in another level. This could make it difficult to compare the results of the GMFCS-SD in comparing different GMFCS-levels. On the other hand, the classes of GMFCS-SD are widely different from each other, and every change in level stands for an important change in clinical functioning. Moreover, the use of the standard deviation of the GMFCS (GMFCS-SD) as a measure of change can be seen as a methodological drawback, since the data are not ratio data and was not normally distributed (75% of the children showed a stable GMFCS). On the other hand, Palisano et al. (Citation2006) also used the SD methodology as an indicator of stability and we have replicated this methodology to enhance the comparability of the studies.
Linear regression was chosen to investigate which factors are related to change in the GMFCS level. This may have made it difficult to detect non-linear relationships, but when looking visually at the data, no non-linear relationships were evident. An alternative method of analysis could have been the use of logistic regression analysis, as in Alriksson-Schmidt el al. (2017), when they studied the children from another area of Sweden. The large population in the present study with a mean number of data points of 6.7 for each child made it too time-consuming to study each child's change individually. On the other hand, data analyzed on a dichotomous level is less informative, diluting the results, than data analyzed on a continuous scale. Some variables were correlated with each other (Pearson r > 0.6) and were therefore not included in the subsequent analysis. Analysis with non-parametric statistics (Spearman) showed the same strong correlations as Pearson.
Conclusions
The result of this registry study of 768 children with cerebral palsy living in Stockholm County, from January 2000–February 2019 classified an average of 6.7 times, showed that for almost seven out of ten children the GMFCS level remains stable during childhood, which supports the use of GMFCS for different purposes, e.g. predicting future functioning and health care planning. Children in GMFCS levels II, III, IV are most likely to be re-classified, and for children initially classified in level II, there is almost a 70% probability of a change occurring. Users should also keep in mind that early ratings are less certain than those made after the age of four. Intensive training periods are associated with change in the GMFCS level. However, it is not clear whether the training is the cause of the change or a consequence of it, further studies are warranted to investigate this.
Disclosure statement
No potential conflict of interest was reported by the author(s).
Additional information
Notes on contributors
Emma Nylén
Emma Nylén, Registered Physical Therapist, Master of Science with 9 years of experience working with children and adults with Cerebral Palsy.
Wilhelmus J. A. Grooten
Wilhelmus J. A. Grooten is an Associate Professor (PhD), University Lecturer and Registered Physical Therapist with over 50 peer-reviewed publications in the areas of public health, ergonomics, sports medicine, pain research, and biomechanics.
References
- Alriksson-Schmidt, A., Nordmark, E., Czuba, T., & Westbom, L. (2017). Stability of the Gross Motor Function Classification System in children and adolescents with cerebral palsy: A retrospective cohort registry study. Developmental Medicine and Child Neurology, 59(6), 641–646. https://doi.org/10.1111/dmcn.13385
- Bodkin, A. W., Robinson, C., & Perales, F. P. (2003). Reliability and validity of the gross motor function classification system for cerebral palsy. Pediatric Physical Therapy: The Official Publication of the Section on Pediatrics of the American Physical Therapy Association, 15(4), 247–252. https://doi.org/10.1097/01.PEP.0000096384.19136.02
- Cans, C., Guillem, P., & Baille, F. (2007). Surveillance of cerebral palsy in Europe: a collaboration of cerebral palsy surveys and registers. Developmental Medicine & Child Neurology, 42(12), 816–824. https://doi.org/10.1111/j.1469-8749.2000.tb00695.x
- CPUP. (2019a). CPUP-template. http://cpup.se/wp-content/uploads/2019/04/Nytt_FT-formul%C3%A4r-2019.190206.pdf.pdf
- CPUP. (2019b). What is CPUP? http://cpup.se/in-english/what-is-cpup-in-english/
- Godwin, E. M., Spero, C. R., Nof, L., Rosenthal, R. R., & Echternach, J. L. (2009). The gross motor function classification system for cerebral palsy and single-event multilevel surgery: is there a relationship between level of function and intervention over time? Journal of Pediatric Orthopaedics , 29(8), 910–915. https://doi.org/10.1097/BPO.0b013e3181c0494f
- Gorter, J. W., Ketelaar, M., Rosenbaum, P., Helders, P. J., & Palisano, R. (2009). Use of the GMFCS in infants with CP: the need for reclassification at age 2 years or older. Developmental Medicine and Child Neurology, 51(1), 46–52. https://doi.org/10.1111/j.1469-8749.2008.03117.x
- Gray, L., Ng, H., & Bartlett, D. (2010). The gross motor function classification system: an update on impact and clinical utility. Pediatric Physical Therapy: The Official Publication of the Section on Pediatrics of the American Physical Therapy Association, 22(3), 315–320. https://doi.org/10.1097/PEP.0b013e3181ea8e52
- Heinze, G., & Dunkler, D. (2017). Five myths about variable selection. Transplant International: Official Journal of the European Society for Organ Transplantation, 30(1), 6–10. https://doi.org/10.1111/tri.12895
- Himmelmann, K., & Uvebrant, P. (2014). The panorama of cerebral palsy in Sweden. XI. Changing patterns in the birth-year period 2003-2006. Acta Paediatrica, 103(6), 618–624. https://doi.org/10.1111/apa.12614
- Hosmer, D., Lemeshow, S., & Sturdivant, R. (2013). Applied logistic regression. John Wiley & Sons.
- Ko, J., & Kim, M. (2013). Reliability and responsiveness of the gross motor function measure-88 in children with cerebral palsy. Physical Therapy, 93(3), 393–400. https://doi.org/10.2522/ptj.20110374
- Mayson, T. A., Ward, V., Davies, K. R., Maurer, J., Alvarez, C., Beauchamp, R., & Black, A. (2013). Reliability of retrospective assignment of gross motor function classification system scores. Developmental Neurorehabilitation, 16(3), 207–209. https://doi.org/10.3109/17518423.2012.755575
- Palisano, R. J., Avery, L., Gorter, J. W., Galuppi, B., & McCoy, S. W. (2018). Stability of the gross motor function classification system, manual ability classification system, and communication function classification system. Developmental Medicine and Child Neurology, 60(10), 1026–1032. https://doi.org/10.1111/dmcn.13903
- Palisano, R. J., Cameron, D., Rosenbaum, P. L., Walter, S. D., & Russell, D. (2006). Stability of the gross motor function classification system. Developmental Medicine & Child Neurology, 48(06), 424–428. https://doi.org/10.1017/S0012162206000934
- Palisano, R. J., Rosenbaum, P., Bartlett, D., & Livingston, M. H. (2008). Content validity of the expanded and revised Gross Motor Function Classification System. Developmental Medicine and Child Neurology, 50(10), 744–750. https://doi.org/10.1111/j.1469-8749.2008.03089.x
- Palisano, R. J., Rosenbaum, P., Walter, S., Russell, D., Wood, E., & Galuppi, B. (1997). Development and reliability of a system to classify gross motor function in children with cerebral palsy. Developmental Medicine and Child Neurology, 39(4), 214–223. https://doi.org/10.1111/j.1469-8749.1997.tb07414.x
- Rosenbaum, P., Paneth, N., Leviton, A., Goldstein, M., Bax, M., Damiano, D., Dan, B., & Jacobsson, B. (2007). A report: The definition and classification of cerebral palsy April 2006. Developmental Medicine and Child Neurology. Supplement, 109, 8–14.
- Rosenbaum, P. L., Walter, S. D., Hanna, S. E., Palisano, R. J., Russell, D. J., Raina, P., Wood, E., Bartlett, D. J., & Galuppi, B. E. (2002). Prognosis for gross motor function in cerebral palsy: creation of motor development curves. JAMA, 288(11), 1357–1363. https://doi.org/10.1001/jama.288.11.1357
- Rutz, E., Tirosh, O., Thomason, P., Barg, A., & Graham, H. K. (2012). Stability of the Gross Motor Function Classification System after single-event multilevel surgery in children with cerebral palsy. Developmental Medicine and Child Neurology, 54(12), 1109–1113. https://doi.org/10.1111/dmcn.12011
- Socialstyrelsen. (2019). Statics on pregnancy, deliveries and newborns [in Swedish: Statistik om graviditeter, förlossningar och nyfödda]. https://www.socialstyrelsen.se/statistik-och-data/statistik/statistikamnen/graviditeter-forlossningar-och-nyfodda/
- Walker, J., & Almond, P. (2010). Interpreting statistical findings: a guide for health professionals and students. McGraw-Hill/Open University Press.
- Westbom, L., & Hagglund, G. (2018). [in Swedish: Therapeutic cooling is associated with better function in children with cerebral palsy due to birth asphyxia according to the national health care quality registry CPUP]. Lakartidningen, 115.
- Wood, E., & Rosenbaum, P. (2000). The gross motor function classification system for cerebral palsy: a study of reliability and stability over time. Developmental Medicine & Child Neurology, 42(5), 292–296. https://doi.org/10.1017/S0012162200000529