Abstract
The optimal feed parameters of the generators for a complex-phased hyperthermia array system consisting of 4, 8 or even more applicators cannot be found using only the expertise of the treatment staff or using the limited amount of field and temperature data obtained during treatment. A number of strategies have been proposed to help us with the task to optimise the hyperthermia treatment, including several strategies specifically addressing the occurrence of hot spots. Each of the latter strategies strongly relies on the specification of the potential hot spots. This specification is either based on anatomy or the selection of an arbitrary number of potential hot spots. Therefore it is not guaranteed that all potential hot spots are included. This paper introduces a procedure for the delineation and visualisation of potential (SAR) hot spots. The potential hot spots are delineated by selecting those points for which the maximal SAR exceeds a specific SAR selection level. This SAR selection level is defined relative to the highest achievable SAR in the target volume for a certain fixed heating power. A larger number of potential hot spots and hot spots of larger size are delineated if the selection level is decreased. Although the procedure still includes an arbitrary selection criterion, i.e. the selection level, the selection is solely based on calculated EM-field data. As a result all potential hot spots can be delineated a priori. Three different objective functions are applied to maximise the SAR in the target. The first only maximises the SAR in the target volume for a given system power output. The other two intrinsically set a constraint on the set of potential hot spots as a whole. Additionally the SAR in each delineated potential hot spot separately can be constrained. In two patient cases the SAR in potential hot spots can be kept below the selection value applied for delineation of the potential hot spots. If assessed in terms of constraining the SAR value below the selection level while maximising target heating efficiency the combination of an objective function only maximising the SAR in the target with a separate constraint on each potential hot spots appears to be the most efficient.
Introduction
During hyperthermia treatments using a phased array the aim and challenge is to set the feed parameters of the generators in such a way that the treatment is optimal. In the clinical practice, the adjustment of the feed parameters and the assessment whether the treatment is optimal is based on data gathered by one electric field probe or a limited number of temperature sensors. Consequently the optimal treatment is defined by efficient target heating as indicated by the available sensor data, without discomfort by hot spots indicated by the patient. A technique applying MRI is evolving towards a tool to evaluate the heating pattern in the complete heated area (Wlodarczyk et al. 1998). Temperature data is needed for treatment analyses, however these data is not practical for finding the optimal feed parameters. Practical ways of finding the optimal feed parameters depend on a known mathematical relation of the feed parameters of the generators and the heating pattern obtained in the patient. This relation can be determined numerically by calculation of the electromagnetic field (EM) generated by each applicator in the patient. Subsequently the optimal feed parameters can be found by applying an optimisation strategy yielding an optimal heating pattern. A number of strategies, including strategies specifically addressing the occurrence of hot spots, have been proposed to optimise the hyperthermia treatment Citation[1–6]. The group of Wust et al. Citation[7] proposed to maximise the fraction of the power deposited in the target area to the total power deposited in a set of selected potential hot spots. However, the number of these hot spots is selected arbitrary, i.e. 10, and the selection criteria are not defined. A similar optimisation strategy explicitly including potential hot spots was proposed by Das et al. Citation[6]. The highest power density points per antenna are selected as potential hot spots in this study. The group of Bardati et al. Citation[8] suggested a strategy applying amplitude and phase synthesis. The optimisation results in a trade-off of the “best” feed for the target and the “best” feeds for a number of organs to be protected.
Each of the strategies mentioned earlier strongly relies on the specification of the potential hot spots. This specification is either based on anatomy or the selection of an arbitrary number of potential hot spots. Therefore it is not guaranteed that all potential hot spots are included.
Both the specific absorption rate (SAR) and the invoked temperature increase are applied for optimisation purposes. In the context of the specification of potential hot spots it is relevant to realise that a temperature hot spot is a manifestation of a SAR hot spot. Although in this manifestation perfusion and cooling of the patient skin, e.g. by a waterbolus, plays an important role the specification of potential hot spots using SAR values as a first indicator is reasonable.
In this article we will introduce the approach of delineating potential hot spots by defining them as volumes having a SAR above a certain selection level. Since the objective of treatment planning optimisation is to efficiently heat the target this selection level is coupled to the SAR in the target volume. The delineation procedure utilises the interference principle for the EM fields generated in the patient by each separate applicator. These EM fields are determined numerically. As a result all potential hot spots can be delineated a priori. For two patient cases the delineation method is applied to specify potential hot spots in fat tissue and muscle tissue separately. These potential hot spots will be included in the maximisation of three different objective functions. The first only maximises the SAR in the target volume for a given system power output. The other maximise the ratio between the SAR in the target and the weighed sum of the SAR in sub-volumes of the body and thus intrinsically set a constraint on the set of potential hot spots as a whole. Additionally the SAR in each delineated potential hot spot separately can be constrained.
Theory
Delineating potential “hot spots”
In this subsection a method by which potential hot spots can be delineated is explained. The delineation is based on numerically calculated EM-field data giving the EM-field generated by the individual applicators of the hyperthermia treatment apparatus. These individual EM-fields can be superposed to determine the EM-field and SAR distribution in the patient for any amplitude and phase setting. The optimal SAR distribution can be determined by maximising an appropriate object function. Additionally, to reduce the occurrence of hot spots, volumes that potentially can exhibit an unacceptable high SAR value must be accounted for. These potential hot spots can be searched for in the following three steps:
At each grid point determine the maximal SAR for a given constant total power output of the generators; i.e. maximise heating efficiency. In general the amplitude and phase settings resulting in the maximal SAR are different for each grid point.
Select a SAR level at which over-heating is expected.
For the selected SAR level determine which grid points exceed this level. Gather the spatially connected grid points to treat these grid points as a single volume.
Determining the maximal SAR at a grid point
The definition of this problem has already been presented by several authors (e.g. Citation[6], Citation[8]), but will be repeated briefly here. In this section first the equations specifying the SAR at a grid point will be given and subsequently the solution of maximising the heating efficiency will be elaborated.
Specification of the SAR
The SAR at location generated by the N applicators of a hyperthermia system (phased array) radiating with strength A1, … , AN and having a phase delay φ1, … , φN is given by
with
the conductivity in [S/m],
the density of mass in [kg/m3],
the local field strength in [ V/m] and the asterisk denoting the complex conjugation. The local field strength
is the superposition of the separate fields generated by the N applicators, which is mathematically expressed by Equation 2.
In Equation 2,
is the E-field contributed by the i-th applicator if radiating at unitary amplitude (Ai = 1) and zero phase (φi = 0) and
represents the dimensionless applicator feed. The maximal SAR deposited at location
for a certain total power output of the applicators of the hyperthermia system can be found by maximising Equation 1 with the amplitudes Ai and the phases φi as parameters.
Maximising heating efficiency
The maximal heating efficiency can be found by stating the optimisation problem as an eigenvalue problem. Substitution of Equation 2 in Equation 1 results in:with
the complex conjugate transpose of
and
a N × N Hermitian or self-adjoint matrix having N real and positive eigenvalues λ1, … , λN and N eigenvectors
. Both eigenvalues and eigenvectors can be determined by diagonalisation of
which can be done efficiently using Jacobi transformations (Numerical Recipes in C, The Art of Scientific Computing, 2nd ed. Cambridge University Press, Section 11.1, pp. 463–469). The eigenvector
represents the feed vector for which the SAR at location
is λi. The SAR at location
for the N applicators driven with an arbitrary feed vector
now can be expressed by
Also the average SAR in a volume can be expressed in the same form as the SAR at a certain location and can be given by an eigenvalue problem with altered elements in matrix M Citation[9].
From Equation 5 it is deduced that for a normalised feed vector the maximal SAR at a certain location (or volume) is equal to the maximal eigenvalue λi (or λi’) if
is equal to the corresponding eigenvector
, i.e.
This normalised feed vector (Equation 6) determines the SAR per unit of system power output
For the optimisation procedure it is advantageous to compose a volume for which the average SAR is determined (Equation 5b). This is only useful if there is no large difference between the eigenvector of this volume and the eigenvectors of each grid point in this volume defined by Equation 5(a). Only in this case the maximal average SAR of the volume represents the average of the maximum SAR of each grid point of this volume. The validity of this assumption can be argued as follows. The normalised feed vector for which the SAR at a certain grid point is maximal, is determined by the E-field contribution of each applicator at this grid point. To maximise the interference at the grid point specified, the phases of the applicators must be such that the E-fields are in phase, thus determining the feed vector phases φi. The normalised feed vector amplitudes Ai for which the interference is maximal depends on the relative amplitude of the E-field contributed by each applicator at the grid point. For example the normalised feed vector for which the SAR at a certain location is maximal will have the largest amplitude Ai for the i-th applicator contributing the largest E-field. At other grid points in the volume the normalised feed vector for which the SAR is maximal will change moderately if the change in the phases and the relative amplitudes of the E-fields is moderate as well. Thus, for small homogeneous volumes or homogeneous volumes where the SAR is dictated by a single applicator only a small variation of the feed vector can be expected. However, large volumes might exhibit a large variation in the normalised feed vector for which grid points in the volume reach their maximal SAR. In these cases it is not justified to assemble a set of grid points to specify the SAR of a volume. Insight in this problem can be obtained through analyses of the fraction of the maximal SAR found for a volume using the Equation 5(b) and the average maximal SAR of the individual grid points constituting the volume. This fraction offers an indication of the homogeneity of the normalised feed vector, i.e. the amplitude and phase setting, at which the separate grid points of a volume reach their maximal SAR. Therefore this fraction is further defined as the feed vector homogeneity index.
Material and methods
Delineating the potential hot spots
The EM-field in the patient generated by the four (N = 4) individual applicators of the hyperthermia treatment apparatus at our institute is calculated by the CGFFT method Citation[10]. This method has been described elsewh Citation[11], Citation[12]. The EM-field is determined in four steps. (1) A CT data set of the patient is acquired; (2) from this data set fat, muscle and bone tissue are segmented and dielectric properties are assigned to these segmented tissues; (3) the data set is downscaled to 1 × 1 × 1 cm3 grid points and is merged with a description of the hyperthermia treatment apparatus and (4) the EM-field is determined at each grid point of the data set for each applicator radiating at unitary amplitude (Ai = 1) and zero phase (φi = 0). With the obtained EM-field data, the maximum SAR is determined for each grid point by determining the maximal eigenvalue of the matrix defined in Equation 4(b) using Jacobi transformations. In this way, a 3D data set is obtained with at each grid point the maximal SAR that can be reached for a fixed heating power, i.e. a normalised feed vector (Equation 6) is applied. From this 3D data set those grid points are selected with a SAR value equal or larger than a selection level. Based on the argument that a multiple of the SAR in the target needed for a therapeutic temperature of 43°C will in general result in a temperature higher than 43°C this selection level is defined relative to the SAR level in the target. Because the exact SAR in the target is not known at the moment the grid points are selected its value has to be estimated. Since the optimisation functions presented in the next paragraph all aim for efficient target heating, i.e. the highest possible SAR in the target considering a fixed heating power, a first-order estimation is given by the SAR value in the target at maximal heating efficiency. The SAR value in the target volume at maximal heating efficiency is given by the largest eigenvalue of the matrix equation given by Equation 5(b) for this volume. This optimised SAR in the target volume will be abbreviated to OST (Optimised SAR in the Target). Based on initial analyses of the data, selection levels at six, four and three times the OST are applied. For the two patient cases a SAR of six times the OST is close to the maximal SAR that can be reached in the 3D data set. A SAR of three times the OST was found to be the lowest SAR achievable for constrained optimisation. Note that the selection level is relative and a level of three times the OST indicates that in the clinical setting the absolute SAR value in the target is limited by the absolute SAR value elsewhere, i.e. a treatment limiting hot spots. A decreased OST indicates that this absolute SAR in the target is larger given a constant SAR in the treatment limiting hot spot. For each selection level, differentiating between muscle and fat tissue, the grid points attached to one another are treated as a single potential hot spot. The different potential hot spots present in fat and muscle tissue are then indexed.
The determined maximum SAR at all grid points is visualised by presenting “maximum SAR projection” (MSP) images in the three major directions; x, y and z. Additionally, the location of each potential hot spot is projected on the MSP images.
Optimisation
Three objective functions are maximised to determine the feed vector resulting in the optimal hyperthermia treatment. An objective function Π1 (Equation 7a) determines the SAR in the target volume. This SAR-related objective function has often been used as an optimisation variable (e.g. Citation[1], Citation[13]). The objective function Π1 has the dimensions of [W/kg] and maximising the function is bound by imposing a fixed heating power, i.e. a normalised feed vector (i.e. Equation 6). Two additional objective functions maximise the ratio between the SAR in the target and the weighed sum of the SAR within each subvolume of the body. In objective function Π2 (Equation 7b), each subvolume identified as potential hot spot this weight = 1 and the remaining body volumes have zero weight. This objective function can be compared to the objective function defined by Wust et al. Citation[7]. In objective function Π3 (Equation 7c) each subvolume identified as potential hot spot has a weight that depends on its volume, i.e. a larger volume has a higher weight. The remaining body volumes have zero weight. Although the later two objective functions explicitly include potential hot spots it is still possible that the sum of the SAR in the selected potential hot spots is decreased by decreasing the SAR of the majority of the potential hot spots while increasing the SAR of a few potential hot spots. Therefore a constraint is introduced that at each potential hot spot limits the SAR. This constraint is given in Equation 7(d) and is defined for a certain feed vector by the fraction of the SAR of a potential hot spot and the SAR in the target volume for this feed vector. This fraction is further referred to as RPHS (Relative Potential Hot spot SAR).with
where Vtg is the volume of the target; Vhs,i the volume of the i-th potential hot spot;
, the volume fraction of the i-th potential hot spot relative to the total hot spot volume
.
For two patient cases the objective functions defined above is maximised with respect to the feed vector and the constraint defined in Equation 7(d). Maximisation is performed in Microsoft Excel using the Solver addin. This Solver addin uses the Generalized Reduced Gradient (GRG2) nonlinear optimization code developed by Leon Lasdon, University of Texas at Austin, and Allen Waren, Cleveland State University. The value of the constraint is stepwise decreased (in whole numbers) from the highest RPHS value found in the situation of unconstrained maximisation to the selection level or to the lowest value at which compliance to the constraint is still possible. At the expense of a lower SAR in the target the constrained maximisation will result in a feed vector for which the fraction of the SAR of each potential hot spot and the SAR in the target volume is below the constraint value. The consequence of applying different selection levels is analysed for both patient cases.
Re-delineating the potential hot spots
The optimisation of the hyperthermia treatment aims for a SAR in the target equal to the OST. As explained previously the potential hot spots are delineated using a SAR threshold specified relative to the OST. However, due to the constraints related to the potential hot spots, optimisation will result in a SAR in the target that is lower than the OST. This implies a lowered potential hot spots selection threshold. With this lowered threshold value it is possible that a grid point, not being part of the potential hot spot already delineated, has a SAR value that is higher than the SAR threshold value. Therefore, as a post-processing step, the actual potential hot spots are re-delineated for the adapted SAR threshold value as a check of the rigidity of the delineation method. Note that the SAR value at each grid point is already specified by the feed vector determined by the optimisation and that therefore step 1 mentioned in section 2.1 is omitted in this re-delineation procedure.
Results
Two patient cases are elaborated, namely (1) the case of a patient treated for a bone metastasis and (2) a patient treated for cervical cancer. Each of the objective functions Π1, Π2 and Π3 defined in the Equations 7(a)–(c) are applied to optimise the SAR distribution. The potential hot spot volumes included in these objective functions or in the constraint specified by Equation 7(d) are delineated at three selection levels, i.e. at six, four and three times the OST.
Delineating the potential hot spots
In this subsection the location of the delineated potential hot spots is indicated by “maximum SAR projection” (MSP) images. For clarity each MSP image is constructed from the data of either muscle or fat tissue. The maximal SAR projection values are given as a percentage of the maximal value present in the projection as given by the colour legend. In MSP images for the muscle tissue are shown. In MSP images for the fat tissue are shown.
Figure 1. Delineated potential hot spots in muscle tissue at a selection level of (a) six, (b) four and (c) three times the OST.
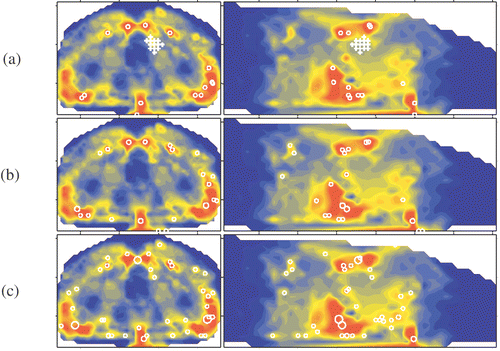
Figure 2. Delineated potential hot spots in fat tissue at a selection level of (a) six, (b) four and (c) three times the OST.
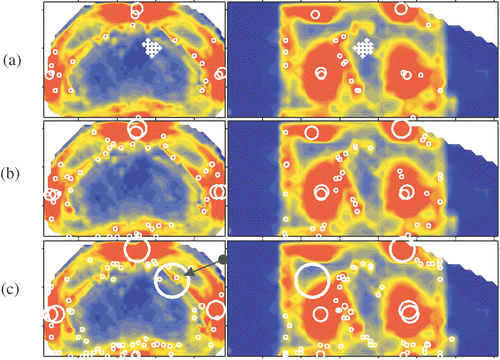
In the and the location of the target volume is indicated by crosses. In each MSP image a circle marks the projection of each potential hot spot. The radius of the circle is representative for the volume of the potential hot spot and the circle location coincides with the centre of the potential hot spot. In the potential hot spots are given for a selection level of six times the OST. In this level is decreased to four and three times the OST, respectively. Comparison of and shows that a lower selection level results in an increase of the size of the volumes and the selection of new volumes. Some volumes merge forming a single larger volume. Close to the skin of the patient, distributed in pairs at the posterior side and the both lateral sides, six larger hot spots appear (). At the lowest selection level, i.e. three times the OST, two of these larger hot spot volumes merge into to a single hot spot volume (in indicated by an arrow). At the anterior side of the patient no comparable hot spots are found. The aforementioned observations are summarised in the .
Table I. Overview of number of delineated potential hot spots per selection level and tissue type.
Optimisation
Patient case 1
The results of maximising the objective functions Π1, Π2 and Π3 are presented in and . Each setup, i.e. each row, in represents the result of maximising one of the objective functions while including the potential hot spot volumes found at a specific selection level. The delineated potential hot spots for this patient case have been presented in and . In the capital in the setup label refers to the selection level, i.e. A refers to six, B to four and C to three times the OST. The following digit refers to the maximised objective function while the last digit is used to specify a certain RPHS constraint specified in the seventh column of the table. According to this coding, setup label A21 refers to the maximisation of objective function Π2 while including the potential hot spots found at six times the OST. No RPHS constraint is applied, i.e. the value of the seventh column is “None”. In a similar way setup label C32 refers to the maximisation of objective function Π3 while including the potential hot spots found at three times the OST. A RPHS constraint of 4 is applied, as given in the seventh column. This indicates that, as a constraint during optimisation, the SAR in each potential hot spot may not exceed 4 times the SAR in the target (Equation 7d). In the fourth, fifth and sixth column the value of the objective functions is given. Note that each of the objective functions is maximal only if it is optimised; Π3 is larger for setup A30 (Π3 = 0.0008157) than for setup A11 (Π3 = 0.0004181), whereas Π1 is larger for setup A11 (Π1 = 0.186) than for setup A21 (Π1 = 0.162). In for each selection level the distribution of the number of the potential hot spots over the RPHS values is plotted.
Table II. Optimisation results for patient case 1.
In , besides the values of the objective functions, the power load applied to the patient is given (third column). This power load is calculated for a feed vector that results in a SAR of 50 W/kg at the target volume. The SAR in the target and the power load to the patient depend on both amplitude and phase as defined by the feed vector but that their exact dependence is different; two different feed vectors may induce an identical SAR in the target although, due to the spatial extent of the applied EM-field and the heterogeneity of the patient tissues, the power load applied to the patient is different for these two different feed vectors. The constraints applied for the RPHS value (Equation 7d) at the potential hot spots displayed in are given in the seventh column of . The distribution of the number of the potential hot spots over the RPHS values is plotted in . The first bin comprises the RPHS value lower than 0.5. The results presented in and the can be summarised as follows:
A large number of potential hot spots are selected. A lower selection level results in an increased number of potential hot spots; The number of potential hot spots is 35, 69 and 110 at a selection level of six, four and three times the OST, respectively (). These numbers are much larger than the number of potential hot spots selected in the studies of Wust et al. Citation[7] and Das et al. Citation[6]. A lower selection level, besides an increased number of potential hot spots also shows an increase of the volume of those potential hot spots delineated at a previous selection level.
As mentioned earlier, at each selection level the RPHS constraint is decreased in steps towards the selection level value. At the lowest selection level of three times the OST a RPHS constraint equal to the selection level value results in a conflicting set of RPHS constraints; i.e. the presence of one or more hot spots with a RPHS value larger than the RPHS constraint value cannot be prevented.
By application of an RPHS constraint the highest RPHS values decrease to the selected RPHS constraint. In most cases only a single hot spot is actively constrained as indicated in by the number of potential hot spots in the highest RPHS bin. At higher RPHS constraints and lower selection levels the number of actively constrained hot spots increases.
On average the number of potential hot spot with a high RPHS value is larger for maximising objective function Π3 (right panel in ) than for maximising the objective functions Π2 and Π1 (left and middle panel in ). This can be explained as a result of an increased weight of the potential hot spots with a large volume and low SAR compared to those with a smaller volume and a high SAR; i.e. increasing the value of Π3 is more worthwhile when decreasing the SAR of a large volume than when decreasing the SAR of a small volume. The effect of minimising the summed SAR while maximising SAR at the target, i.e. maximising objective function Π2, is clearly present at the highest selection level (): the distribution of potential hot spots for objective function Π2 (middle panel in ) drastically shifts towards lower RPHS bins compared to the distribution for objective function Π1 (left panel in ). At lower selection levels this effect is much less apparent or even not present ( and ).
Figure 3. RPHS value distribution of the potential hot spots for the maximised objective functions. Patient case 1, selection level of six times the OST.
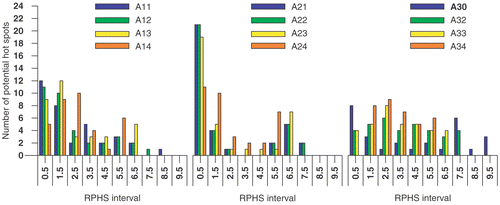
Figure 4. RPHS value distribution of the potential hot spots for the maximised objective functions. Patient case 1, selection level of four times the OST.
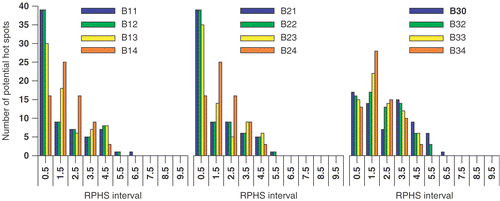
Figure 5. RPHS value distribution of the potential hot spots for the maximised objective functions. Patient case 1, selection level of three times the OST.
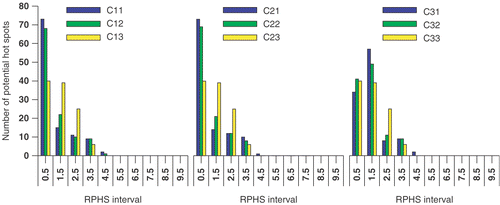
Increasing the RPHS constraint results in a redistribution of the lowest and highest RPHS values towards more intermediate RPHS values. This is independent of objective function or selection level.
Increasing the RPHS constraint, i.e. decreasing the RPHS constraint value in Equation 7(d), results in a less efficient heating for maximising the objective functions Π2 and Π1 and the power load applied to the patient to establish 50 W/kg in the target varies from 800 to 1100 W. For maximising Π3 this is also the case at a selection level of three times the OST. For a selection level of six and four times the OST the efficacy (Π1) is increased and the power load applied to the patient to establish 50 W/kg in the target varies from 1100 to 3000 W. The change in the value of each of the objective functions is substantial if the RPHS constraint is decrease from “None” to the order of the selection level.
At identical selection levels and RPHS constraints the heating efficiency, i.e. Π1, is best after optimising Π1 and worst after optimising Π3. For lower RPHS constraint the results of maximising the three different object functions become similar and in the extreme case are identical (, cases C13, C23 and C33). For these cases also the distribution of the number of potential hot spots over the RPHS bins is identical (, yellow bar). In these cases maximising the objective functions is dictated by the RPHS constraint.
Patient case 2
The result of maximising the objective functions Π1, Π2 and Π3 is presented in and the . Each setup in represents the result of maximising one of the objective functions including the potential hot spot volumes delineated at a specific selection level.
Table III. Optimisation results for patient case 2.
The delineated potential hot spots for this patient case are presented in and . presents MSP images and potential hot spots in the fat tissue at six, four and three times the OST, respectively. presents MSP images and potential hot spots in the muscle tissue at six, four and three times the OST, respectively. The capital in each setup label given in column 1 of refers to the selection level; A refers to six, B to four and C to three times the OST. The following digit refers to the objective function while the last digit is used to specify a certain RPHS constraint specified in the seventh column of . In the the distribution of the RPHS values of the potential hot spots is plotted for each selection level; six, four and three times the OST, respectively.
Figure 6. Delineated potential hot spots in fat tissue at a selection level of (a) six, (b) four and (c) three times the OST.
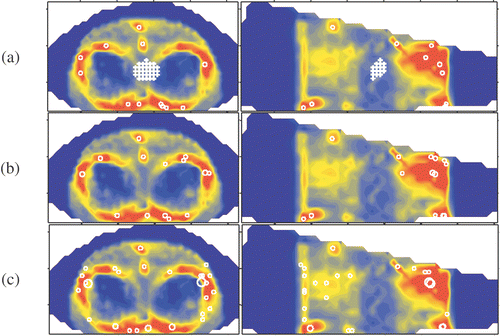
Figure 7. Delineated potential hot spots in muscle tissue at a selection level of (a) six, (b) four and (c) three times the OST.
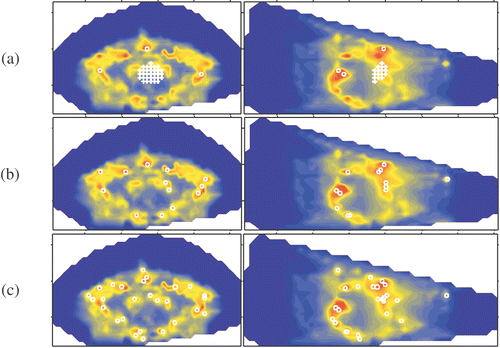
A large number of hot spots is selected, although a smaller number than for patient case 1. A lower selection level results in an increased number of potential hot spots; The number of hot spots is 15, 29 and 54 at a selection level of six, four and three times the OST, respectively. Again these numbers are larger than the number of potential hot spots selected in the studies of Wust et al. Citation[7] and Das et al. Citation[6].
Again the effect of minimising the summed SAR while maximising SAR at the target, i.e. maximising objective function Π2, is present at the highest selection level (): the distribution of potential hot spots for objective function Π2 (middle panel in ) slightly shifts towards lower RPHS bins compared to the distribution for objective function Π1 (left panel in ). At the lower selection levels this effect is much less apparent or even not present ( and ).
Figure 8. RPHS value Distribution of the potential hot spots for the maximised objective functions. Patient case 2, selection level of six times the OST.
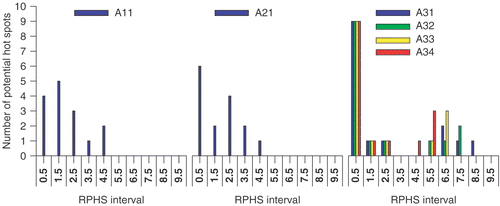
Figure 9. RPHS value Distribution of the potential hot spots for the maximised objective functions. Patient case 2, selection level of four times the OST.
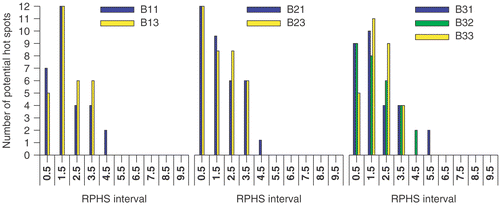
Figure 10. RPHS value Distribution of the potential hot spots for the maximised objective functions. Patient case 2, selection level of three times the OST.
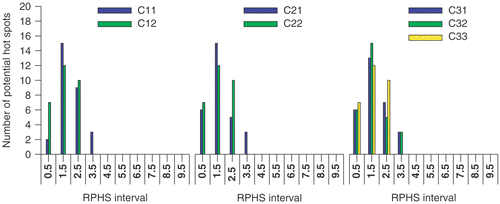
Increasing the RPHS constraint results in a redistribution of mainly the highest RPHS values towards more intermediate RPHS values. This is independent of objective function or selection level.
Increasing the RPHS constraint, i.e. decreasing the RPHS constraint value in Equation 7(d), results in a slightly altered heating efficiency; the power load applied to the patient to establish 50 W/kg in the target varies from 550 to 600 W. The change in the value of each of the objective functions is moderate (<4%) if the RPHS constraint is decreased from “None” to the order of the selection level.
At each selection level the RPHS constraint is decreased in steps towards the selection level value. For each selection level the RPHS constraint value can be decreased to the selection level value. For each objective function a similar setup is determined if the values in and distribution in for the setup labels C12, C22 and C33 are compared.
Discussion
For both tissue types the results of the delineation of the potential hot spot volumes show that the SAR at a large number of these volumes can reach a value that is higher than four to six times the OST value. Also, although the term “potential hot spot” suggests a small volume, large volume potential hot spots in some cases are specified by the delineation procedure. The value chosen to select the potential hot spots volumes, the selection level, clearly has consequences for the number of potential hot spots volumes and the size of these volumes. For the presented selection levels of four and six times the OST, the potential hot spot volumes in the muscle tissue tend to be found roughly at the same locations. In the fat tissue a number of relatively large potential hot spot volumes appear at all selection levels. An explanation for a number of the latter potential hot spot volumes is their proximity to the applicator aperture and the EM-field direction at these locations Citation[14]. Hand Citation[15] argued that cooling of the patients skin only is substantial over a distance of approximately 2 cm from the patient skin. Because SAR is optimised here, cooling effects are not accounted for.
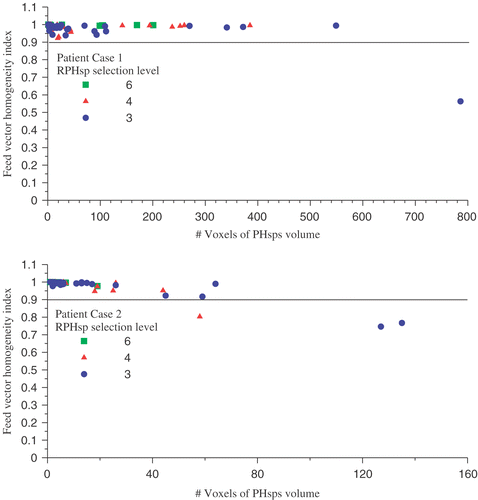
The SAR of potential hot spot volumes is used in both objective functions Π2 and Π3 (Equations 7b and c) and in RPHS constraint (Equation 7d) applied in the optimisation of the objective functions. In the feed vector homogeneity index introduced in Section 2.2.2 is plotted as a function of the potential hot spot size. For the majority of the potential hot spots the feed vector homogeneity index is close to 1 indicating that for the majority of the potential hot spot treating this potential hot spot as a single volume is justified. The potential hot spot volumes with a feed vector homogeneity index below 0.9 are identified as potential hot spot volumes in the fat tissue. In none of the optimisation cases these potential hot spot volumes have a substantial contribution to the value of the objective function or their is SAR value actively constraint.
Figure 11. The feed vector homogeneity index for the potential hot spots found at the different selection levels defined for both patient case 1 and patient case 2.
The potential hot spots are selected using a SAR threshold level. This SAR threshold level specifies a SAR threshold value relative to the SAR value in the target above which potential hot spots are delineated. Since the SAR in the target after maximising each of the objective functions is not known in advance the SAR in the target after maximising is estimated by the OST value. However, due to the constraint related to the potential hot spots, maximising of the objective functions results in a normalised feed vector for which the objective function is maximal however the SAR in the target will be lower than the OST value. As a consequence, the “actual” SAR threshold value applied for the potential hot spot selection also is lowered. Therefore, as a post-processing step, the actual potential hot spots are delineated for the optimised normalised feed vector and the corresponding updated SAR threshold value. Due to the fixed normalised feed vector not all previously delineated potential hot spots will be re-delineated. For patient case 2 this re-delineation step in general only finds grid points that result in a small increase of potential hot spots already delineated in the initial step. For a single setup label an additional potential hot spot is delineated (patient case 2, setup label B21). For patient case 1 optimising object function Π3, besides a small increase of potential hot spots already delineated in the initial step, a large number of additional potential hot spot are delineated by the post processing step. This is especially the case for a selection level of 6 times and 4 times the OST. The number of grid points constituting these additional potential hot spots are given in . In this table it is shown that for setup label A30 an extreme number of additional grid points is selected. Note however that, since the SAR in the target given by Π1 (column 4 of : 0.045) is much lower than the OST value (setup label A11 in : 0.186), the selection level is drastically lowered for this case.
Table IV. Grid points added by the post processing step for patient case 1.
The local SAR and the perfusion of the tumour area predominantly determine the achieved increase of the tumour temperature. In a study by Wust et al. Citation[16], among other determinants for radio frequency hyperthermia, the relation between thermoregulation, local tumour SAR and tumour temperature increase was analysed based on a large number of regional heat treatments. The study of Wust et al. indicates that, in the majority of the treatments the SAR in the tumour is lower than 50 W/kg (mean value 38 W/kg). Furthermore, Wust et al. indicate that to establish a tumour temperature increase larger than 4°C (≈4°C at high perfusion and ≈5°C at low perfusion), a SAR higher than 35 W/kg is necessary in 40% of the treatments while in 40% of the treatments a SAR lower than 35 W/kg only suffices if the perfusion is low (<10 g/100 ml/min). In the remaining 20% of the treatments the high perfusion in combination with a SAR lower than 35 W/kg results in a temperature increase of ≈2°C. Therefore the power load of the patient at a SAR of 50 W/kg in the target, as presented in both and , must be considered as an upper limit.
The number of selected potential hot spots is dependent on the SAR that can be realised in the target volume and thus is dependent on location and size of the target volume. For a certain selection level a large number of potential hot spots will be selected if only a “low” maximal SAR in the target volume can be realised. Or, vice versa, a small number of potential hot spots will be selected if a “high” maximal SAR in the target volume can be realised. Together with the ability to constrain the SAR at the selected potential hot spot and assuming that all necessary heating power is available this in principle is an indication for the possibility to heat the target.
The lowest reached RPHS constraint values for the two patient cases are 3.5 and 3, respectively. This implies that the absolute SAR in the target is limited by the SAR in a treatment limiting hot spot. The severity of the treatment limiting effect in general will be decreased due to the thermal response. This response due to waterbolus cooling will have an extreme effect close to the skin. Outside the cooling range of the waterbolus thermal respons is governed by conduction and perfusion. In this region the large difference of a factor of 3 in SAR in the hot spot and the SAR in the target is too large to be nullified by the thermal response.
This article presents data on potential hot spot suppression in conjunction with maximisation of the SAR in the target. For this purpose three objective functions are defined, one maximising the SAR in the target and two maximising the SAR in the target while minimising the summed SAR in a set of potential hot spots. The SAR in each potential hot spot is limited by a specified SAR constraint value. The impact of this SAR constraint value becomes larger if the constraint value is lowered. For a relatively strong constraint, i.e. a low SAR value, the result of the objective function maximisation is determined by the constraint totally and not by the objective function. Objective function Π1, only maximising the SAR in the target, results in a higher heating efficiency while the two other objective functions show a lower heating efficiency due to minimising the summed SAR in the potential hot spots. Based on the data presented the objective function only maximising the SAR in the target in conjunction with a SAR value constraint to limit the SAR in potential hot spots appears to be a justified candidate for treatment optimisation based on SAR values.
Conclusion
This article introduces a method for the delineation and visualisation of potential (SAR) hot spots. Potential hot spots are delineated by selecting those grid points for which the maximal SAR exceeds some SAR selection level. From the selected grid points sets of connected grid points are assembled. The maximal SAR at a grid point is the highest SAR value that can be reached at the grid point for a normalised feed vector. The selection level is specified relative to the OST value. Although this procedure still includes an arbitrary selection criterion, i.e. the selection level, the selection is solely based on calculated EM-field data. As a result all potential hot spots, including those excluded if the selection criterion is based on anatomy, can be delineated a priori.
Three different objective functions accompanied by constraints are applied to maximise the SAR in the target. The delineated potential hot spots are adopted in the objective function, in the constraint or in both. Each of the objective functions is maximised for a normalised feed vector. This normalised feed vector can be interpreted as a constant system power output. Objective function Π1 maximises the SAR in the target, objective function Π2 maximises the fraction of the SAR in the target over the summed SAR in the potential hot spots and the third objective function Π3 maximises the SAR in the target over the weighed sum of the SAR in the potential hot spots. Objective function Π1 does not address any potential hot spots while Π2 and Π3 address the potential hot spots, but as a set and not individually. Therefore an additional constraint on the maximal SAR of the potential hot spots is added to prohibit the possibility of a high SAR in any hot spot. Both the delineation of potential hot spots and maximising of the three objective functions is performed for two different patient cases.
Although the objective functions Π2 and Π3 implicitly restrict the sum of the SAR resp. weighed sum of the SAR of all selected potential hot spots, still actual hot spots occur. Therefore an additional constraint on each potential hot spot is necessary. However, in this case potential hot spots are constrained in two ways; in the objective function and by the additional constraint. This seems excessive and results in situations where the heating efficiency is not optimal. The combination of an objective functions only maximising the SAR in the target, Π1 with a separate constraint on all potential hot spots appears to be the most efficient.
Acknowledgements
This investigation has been supported by the Dutch Cancer Society and the (Dutch) National Computing Facilities Society (NCF).
References
- Boag A, Leviatan Y. Optimal excitation of multiapplicator systems for deep regional hyperthermia. IEEE Trans Microwave Theory Tech 1988; MTT-S: 307–310
- van Maarseveen RA, Van Dijk JDP, Wiersma J. Computational study of EM-interference optimisation, C Franconi, G Arcangeli, R Cavaliere, 1996; 498–500, Conference Proceeding
- Wust P, Nadobny J, Felix R, Deuflhard P, Louis A, John W. Strategies for optimized application of annular-phased-array systems in clinical hyperthermia. Int J Hyperther 1991; 7: 157–173
- Paulsen KD, Geimer S, Tang J, Boyse WE. Optimization of pelvic heating rate distributions with electromagnetic phased arrays. Int J Hyperther 1999; 15: 157–186
- Das SK, Clegg ST, Samulski TV. Computational techniques for fast hyperthermia temperature optimization. Med Phys 1999; 26: 319–328
- Das SK, Clegg ST, Samulski TV. Electromagnetic thermal therapy power optimization for multiple source applicators. Int J Hyperther 1999b; 15: 291–308
- Wust P, Seebass M, Nadobny J, Deuflhard P, Monich G, Felix R. Radiofrequency hyperthermia, Hyperthermia treatment planning, and Annular-phased-array applicator. Simulation studies promote technological development of radiofrequency phased array hyperthermia. Int J Hyperther 1996; 12: 477–494
- Bardati F, Borrani A, Gerardino A, Lovisolo GA. SAR Optimization in a phased array radiofrequency hyperthermia system. IEEE Trans Biomed Eng 1995; 42: 1201–1207
- Wiersma J, van Maarseveen RA, Van Dijk JDP. A flexible optimization tool for hyperthermia treatments with RF phased array systems. Int J Hyperther 2002; 18: 73–85
- Wiersma J, van Dijk JD. RF hyperthermia array modelling; validation by means of measured EM-field distributions. Int J Hyperther 2001; 17: 63–81
- Zwamborn APM, Van den Berg PM, Koenis FTC. Computation of the electromagnetic field distribution inside 3D biological tissue using the weak form of the Conjugate Gradient FFT method. COMAC-BME Hyperther Bull 1991; 7: 30–37
- Zwamborn APM, Van den Berg PM, Mooibroek J, Koenis FTC. Computation of three-dimensional electromagnetic-field distributions in a human body using the weak form of the CGFFT method. Appl Comput Electromagn Soc 1992; 7: 26–42
- Niederst C, Van Dijk JDP, van Maarseveen RA, Alletti P, Marchal C. SAR optimization applied on a patient treatment plan, C Franconi, G Arcangeli, R(Tor Vergata) Cavaliere, 1996; Vol. II: 541–543, Conference Proceeding
- Wiersma J, Sijbrands J, Van Dijk JDP. The AMC-4 waveguide phased array: the incident field in the sagittal midplane, C Franconi, G Arcangeli, R(Tor Vergata) Cavaliere, 1996; Vol. II: 88–490, Hyperthermic oncology, Conference Proceeding
- Hand JW. Biophysics and technology of electromagnetic hyperthermia. Methods of external hyperthermic heating clinical thermology subseries thermotherapy, M Gautherie. Springer-Verlag, Berlin, Heidelberg 1989
- Wust P, Stahl H, Loffel J, Seebass M, Riess H, Felix R. Clinical, physiological and anatomical determinants for radiofreqnency hyperthermia. Int J Hyperther 1995; 11: 151–167
