Abstract
In magnetic nanoparticle hyperthermia in cancer treatment, the local blood perfusion rate and the amount of nanofluid delivered to the target region are important factors determining the temperature distribution in tissue. In this study, we evaluate the effects of these factors on the heating pattern and temperature elevations in the muscle tissue of rat hind limbs induced by intramuscular injections of magnetic nanoparticles during in vivo experiments. Temperature distribution in the vicinity of the injection site is measured inside the rat limb after the nanoparticle hyperthermia. The measured temperature elevations at the injection site are 3.5° ± 1.8°C and 6.02° ± 0.8°C above the measured body temperature, when the injection amount is 0.1 cc and 0.2 cc, respectively. The full width of half maximum (FWHM) of the temperature elevation, an index of heat transfer in the radial direction from the injection site is found to be approximately 31 mm for both injection amounts. The temperature measurements, together with the measured blood perfusion rate, ambient air temperature, and limb geometry, are used as inputs into an inverse heat transfer analysis for evaluation of the specific absorption rate (SAR) by the nanoparticles. It has been shown that the nanoparticles are more concentrated in the vicinity of the injection site when the injection amount is bigger. The current in vivo experimental studies have demonstrated the feasibility of elevating the tissue temperature above 43°C under the experimental protocol and equipment used in this study.
Introduction
Within the past two decades, hyperthermia has been widely used in a variety of therapeutic cancer treatment procedures, either as a singular therapy or as an adjuvant therapy with radiation and drugs. Both the direct cell-killing effects of heat and the sensitization of other agents by heat are phenomena strongly dependent on the achieved distribution of the temperature elevation and heating duration. Among various heating approaches, magnetic nanoparticle hyperthermia has a potential to achieve optimal therapeutic results due to its ability to deliver adequate heating power to irregular and/or deep-seated tumor at low magnetic field and small frequency Citation[1]. Iron oxides magnetite Fe3O4 and maghemite γ–Fe2O3 nanoparticles are the most studied to date Citation[2] due to their biocompatibility Citation[3] when injected in the human tissue. The heat generated by the particles subject to an external alternating magnetic field is mainly due to the Néel relaxation mechanism and/or Brownian motion of the particles Citation[4],Citation[5]. The superparamagnetic particles (10–40 nm) are recommended in clinical application as they are able to generate substantial heat within low magnetic field strength and frequency Citation[6]. This approach has been used to treat tumors in liver Citation[7] and breast Citation[2],Citation[8]. An advantage of this method is that multiple-site injections can be exploited to cover the entire target region in the case of an irregularly shaped tumor. The success of this approach relies on its ability to elevate temperatures above 43°C in the entire tumor with minimal thermal damage to the surrounding healthy tissue. Due to their small size, the nanoparticles experience no blood coagulation on their surface but they are more likely to be consumed through phagocytosis Citation[9]. However, the blood vessels in tumors are leaky; therefore the lymphatic drainage of the nanoparticles is decreased because of their affinity to tumor cells and to the diminished endothelial barriers. This is known as the ‘enhanced permeability and retention’ and it is enhanced through coating the nanoparticles with a protein layer Citation[10]. On the other hand, Kawai et al. Citation[11] reported that repeated hyperthermia kills cancer cells through not only heating but also inducing anti-cancer immune response.
Previous investigations have demonstrated that particle size, particle coating, and magnetic field strength and frequency determine its heating capacity defined as the specific loss power (SLP) Citation[4–6],Citation[12]. However, once the nanoparticles are manufactured, the spatial distribution of the particles dispersed in tissue dominates the spatial temperature elevation. Previous experimental data have suggested that the particle concentration is not uniform after the injection Citation[13]. The obtained values of the specific absorption rate by previous investigators are summarized in . Most of those investigations gave the value of the SAR in term of W/kg obtained from either in vivo or in vitro experiments on tissue. The reported magnetic frequency varied from 63 kHz to 700 kHz, while the lower and upper limits of the magnetic field strength were 3 and 24.8 kA/m. Particle sizes used are all smaller than 15 nm in diameter. The wide range of the reported SAR measurements (28 ∼ 467 W/kg) may be mainly due to the variation of magnetic field strength and frequency, nanoparticle concentration, as well as the injection amount. It may imply that the coating on the nanoparticle also plays an important role in determining the values of the SAR.
Table I. Summary of the SAR values found in the literature.
A recent experimental study in a tissue-equivalent agarose gel by our group has shown that the particles were confined in the vicinity of the injection site and particle deposition was greatly affected by the injection rate and amount Citation[13]. Experimental studies have been performed to measure the temperature rises in tissue and to evaluate the feasibility of the approach. The in vivo experimental investigation by Hilger et al. Citation[2],Citation[8],Citation[16] showed that temperatures up to 71°C could be obtained at the center of a tumor in a mouse model. In the same study, the temperature elevation in dry breast tissues was measured and found to increase as a function of the amount of nanofluid injected and depend on the magnetic field strength. The clinical study by Johannsen and Jordan Citation[24–26] focused on testing the magnetic fluid hyperthermia on prostate cancer. The histological analysis of the cancerous tissues showed a partial necrosis of the cells after the treatment. These experiments have demonstrated the feasibility of elevating the tumor temperature to a desired level; however, in some tumor regions, usually at the tumor periphery, underdosage of heating (temperature increase lower than critical value) was observed. In those studies of the heating pattern using animal models, temperature was measured at only one location in tissue. The actual spatial distribution of the magnetic particles after being injected into the tumor and the resulting temperature fields remain unknown in the animal and clinical studies.
Recently, in vivo experiments of magnetic nanoparticle thermotherapy combined with external radiation were performed on rats by Johanssen et al. Citation[28]. This combined treatment was found to reduce the tumor growth by about 88% with a maximum and a minimum temperature of 58°C and 42°C, respectively. Although the temperatures were measured at different places inside the tumor and tissue, no information about the positions of the temperature measurements relative to the tumor size was reported. In another clinical investigation of the human prostate, the SARs were calculated based on the magnetic field strength and the particles distribution measured by computed tomography (CT) Citation[19]. The efficacy of the treatment was found to be dependent on the number of nanoparticle depositions. The SAR distribution induced by the nanoparticles was estimated by the CT density that gives the amount of iron oxide contained in a tissue volume. However, no information concerning the size of the individually examined tissue volume was reported. The accuracy of the CT measurements is limited by its spatial resolution.
The objective of the current study is to evaluate the effects of animal tissue heterogeneity and local blood perfusion rate on the diffusion/convection of a commercially available nanofluid. In vivo experiments were performed on rat limbs to measure the temperature distribution in the tissue after nanoparticle hyperthermia induced by the nanoparticles. The effects of the local blood perfusion rate and the amount of the injected nanofluid on the temperature elevations were investigated in this study. Based on the experimental results, an analytical expression of the SAR was extracted through inverse heat transfer analyses on the measured temperature field.
Methods and materials
Animals
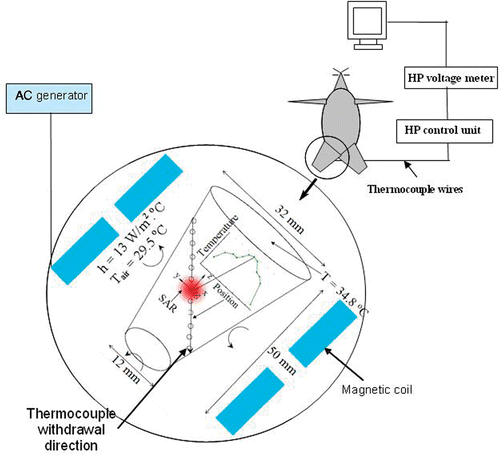
Six male Sprague-Dawley rats (Mean ± SD, 504 ± 21 g) obtained from Charles River Laboratory (Boston, Massachusetts) were used for the experiments. The rats were anesthetized with pentobarbital sodium solution (40 mg/kg) through intraperitoneal injections and covered by a heating pad to keep a normal body core temperature throughout the in vivo experiment. The rectal temperature was monitored with a thermocouple inserted into the rectum. Additional anesthetic was administrated as needed. The experimental protocol was reviewed and approved by the IACUC at University of Maryland Baltimore County. Once each rat was unconscious, iron oxide nanoparticles were infused in the musculus triceps surae muscle Citation[29] such that the needle tip reached the center of the limb. The temperature in the middle of the limb muscle was monitored by a thermocouple during the experiment to assess whether a steady state temperature field was established. The muscle temperatures were measured along a tissue path shown in .
Nanoparticle infusion
Water-based ferrofluid (EMG705 series, Ferrotec Corporation, Nashua, NH) with a concentration of 3.3% by volume and a particle size of 10 nm was used in this study. Based on the density of magnetite (5240 kg/m3) and the given ferrofluid concentration, each 0.1 cc of ferrofluid contains 17.3 mg of solid iron oxide. The ferrofluid was loaded in a 1 cc syringe. The syringe was connected to a 16 gauge teflon tube (Omega Engineering Inc., Stamford, Connecticut) which was connected to a 26 gauge needle having a length approximately equal to half of the limb height so that it reaches the center of the limb after its insertion into the muscle. The needle was marked for injection so that the same length was inside the limb tissue. The syringe was clamped on a syringe pump (Genie Plus, Kent Scientific Inc. Torrington, CT) that allows precise control of the injection rate and amount. Based on our previous experimental study Citation[13], the ferrofluid was injected at a rate of 10 μl/min. In this study, both limbs were used to investigate the effect of the amount of nanofluid on the temperature elevation. The right and left limbs were infused by 0.2 and 0.1 cc, respectively. The temperature measurements were performed in both limbs.
Magnetic field
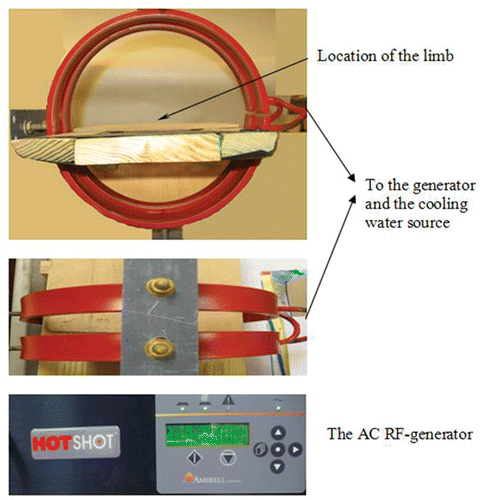
A radio-frequency generator (Hotshot 2, Ameritherm Inc., Rochester, NY) was used to induce an alternating current of 384 A at a frequency of 184 kHz. The current passes through a custom-made two-turn water-cooled coil of 20 cm in diameter and 7 cm in height to generate a magnetic field inside the coil. The rat was placed on a platform inside the coil with the limb being extended from the body and exposed to the surrounding air. Its position was adjusted so that the injection site in the limb was located at the center of the coil where the magnetic field strength reached its maximum value (3 kA/m). The equipment is shown in . Since the magnetic field distribution was axi-symmetric inside the coil and the limb was relatively small, the variation of the magnetic field inside the whole limb can be considered negligible. The electromagnetic field within this coil is not uniform. According to the heating mechanisms of nanoparticle hyperthermia, the induced energy generation rate is approximately proportional to H2. Therefore, heating may not be adequate if the injection site is not placed at the maximum location of the electromagnetic field.
Temperature measurement
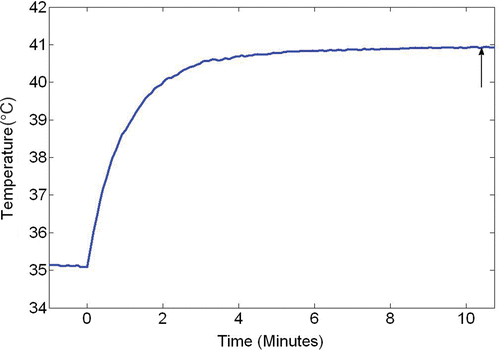
All temperatures were recorded using a LabView® program running on a personal computer. The temperatures monitored by fine thermocouples (copper-constantan, 50 μm diameter) were recorded every two seconds during the entire experiment. In addition to the thermocouples that are used for measuring the air temperature and limb skin temperature, one copper constantan thermocouple (50 μm in diameter) was inserted into the center of the limb muscle to monitor whether the limb temperature field had established a steady state. Once the changes in the voltage given by this thermocouple were less than 0.02 mV (or ±0.05°C), it is assumed that the steady state was established. The time for establishing a steady state ranged from 10 to 15 minutes for all the experiments. This steady state was maintained during the experiment except some small fluctuations that occurred due to the motion of the limb in the coil as shown in .
Figure 3. The temperature change recorded by the thermocouple inserted in the middle of the limb. The vertical arrow represents the time when the steady state was established. After that, temperature measurements along the tissue path were performed.
The temperature at the interface between the limb and the rest of the rat body was also monitored via a thermocouple. This temperature measurement serves as a boundary condition for the inverse heat transfer analysis described later in this section. The temperature distribution in the limb was measured by a thermocouple along the tissue path shown in . The thermocouple was marked every 1 mm along a distance of 40 mm. A gauge 22 needle was inserted in the muscle through the path all the way to the other side of the limb. The thermocouple is then introduced inside the needle from the bottom side of the limb, until it reached the opposite side. The needle was then withdrawn and removed from the coil since the metal needle can be heated in the presence of the magnetic field, and therefore may interfere with the temperature elevations. After a steady state was established, the temperature measurements along the tissue path were performed when one withdrew the thermocouple from its initial position at an increment of 2 mm until it reached the other end of the tissue path (see ). The thermocouple stayed at each tissue location for 20 seconds. This time duration is considered much longer than the characteristic time for the thermocouple to approach the same temperature as the tissue. At each location, the magnetic field was turned off for 3 s and then turned on to estimate thermal interaction between the thermocouple and the magnetic field. If a self-heating of the thermocouple was observed (a sudden increase or decrease in thermocouple voltage when the magnetic field is on or off), the sudden increase or decrease in voltage was subtracted from the thermocouple reading.
Blood flow measurement
After the temperature measurements were performed, a small incision was made on the skin at the medial region of the limb above the thigh. The femoral artery and vein were then exposed and isolated. The blood flow rate of the femoral artery was measured by a T106/T206 Animal Research Flowmeter (Transonic System Inc., Ithaca, NY). Although the flowmeter can be inserted into tissue to continuously monitor the blood flow rate of a blood vessel Citation[30], it cannot be used in this study due to thermal interference with the magnetic field. We assume that the measured blood flow rate represents that of the femoral artery after the steady state. The skin was then closed using tissue glue Citation[31].
Experimental protocol
After the injection of 0.1 cc ferrofluid inside the right limb of the rat and the insertions of the thermocouples, the rat was placed inside the magnetic coil. The rat was allowed to recover for 20 minutes while the magnetic field was off.
The magnetic field was turned on. The steady state of the temperature field in the limb was evaluated by the thermocouple inserted at the center of the limb. After the steady state, the thermocouple originally inserted via the 22 gauge needle was withdrawn to measure the temperature distribution along the tissue path at an increment of 2 mm.
The magnetic field was then turned off. The rat was removed from the stage inside the coil. The blood flow rate of the right femoral artery was measured.
0.2 cc of ferrofluid was injected into the left limb. Steps 2–3 were repeated for the left limb.
At the end of the experiment, the rat was euthanatized by an intraperitoneal injection of pentobarbital sodium solution (150 mg/kg). Both limbs were cut from the rat body and weighed for further analyses.
Statistic analysis
The blood flow rates and temperatures at all positions and other parameters during both trials were analyzed and expressed as mean ± SD. Differences among the mean values of temperatures or blood flow rates were determined by one-way repeated measures ANOVA. The post hoc comparisons between the 0.1 cc and 0.2 cc injection were performed by the student's t-test. Significance was evaluated at the 5% confidence level.
Inverse heat transfer analysis
After obtaining the temperature distribution inside the limbs, an inverse heat transfer analysis was used to determine the heat generation distribution induced by the nanoparticles. The rat limb was modeled as a cone as shown in . The tissue was assumed to be homogenous with a thermal conductivity of 0.5 W/m°C, a density of 1000 kg/m3, and a specific heat of 4180 J/kg°C Citation[23]. The top surface of the cone was assumed to be at a constant temperature equal to that measured by the thermocouple inserted at the interface between the limb and the rest of the rat body. All the other lateral surfaces were assumed to exchange heat by convection with the surrounding air (Tair). The lumped heat transfer coefficient (h) accounting for both natural heat convection and radiation was calculated to be 13 W/m2°C Citation[32].
We used the Pennes bioheat equation Citation[33] to solve for the steady state temperature distribution of the limb during nanoparticle hyperthermia. The Pennes bioheat equation in spherical coordinate system is given by:where k is the tissue thermal conductivity and ρb and Cp,b are the blood density and specific heat, respectively. A Gaussian distribution was proposed for the heat generation distribution,
where r is the radial distance from the injection site, rø is a parameter that determines how far the nanoparticles spread from the injection site, and A represents the maximum strength of the volumetric heat generation rate (W/m3). In Equation 1, ω is the local blood perfusion rate in the limb. In this study, we assume that the blood perfusion was uniform in the limb and was calculated using the following equation,
where ρ is the tissue density, Qa is the blood flow rate of the femoral artery measured in ml/min, and ml is the mass of the limb in grams. Both parameters (ro and A) in the SAR expression were initially guessed based on our previous study Citation[13]. The Pennes bioheat equation was then solved to determine the steady state temperatures at the same positions measured in our experimental study. The least square objective function for estimating the difference between the measured and calculated temperatures
and Ti (A, r0) is given by the following expression,
where N is the number of measured temperature locations along the tissue path. For each injection amount, the measured temperatures from six rats were averaged to obtain the distribution of the mean value of the temperatures, its upper bound and its lower bound. The Nelder-Mead simplex method Citation[34] was then used to minimize the objective function. The computations were conducted using FEMLAB® for finite element simulation of the temperature field and MATLAB® software (R2007b) for inverse problem analyses. The total quadratic tetrahedral elements in the three-dimensional limb are 8716. We have tested the sensitivity of the mesh size by increasing the elements by 400% and found that it resulted in less than 1% global difference in the temperature field. The Nelder-Mead simplex algorithm evaluates the objective function at multiple sets of unknowns A and r0. This numerical method updates the unknowns automatically until convergence. The Nelder-Mead simplex method gives local minima depending on the initial guess. Given that the SAR is a positive entity, we selected multiple values of A ranging from 1 to 2000 kW/m3. We also selected multiple values of r0 ranging from 0.5 mm to 1000 mm. We used the combination of those values as the initial guess to the Nelder-Mead minimization algorithm. Forty-two initial guesses were selected and all the initial guesses resulted in the same solution reported in the results section.
Results
gives the measured blood flow rates and temperatures. The blood flow rate in the femoral artery after the hyperthermia was 1.36 ± 0.18 ml/min for the injection amount of 0.1 cc, which is equivalent to an average blood perfusion rate in the rat limb of 7.16 ml/min/100 g. The blood perfusion rate increased to 7.76 ml/min/100 g (or a flow rate of 1.52 ± 0.25 ml/min) in the limb when 0.2 cc was injected. shows the measured maximum tissue temperature and blood flow rate in the femoral vessel and it further illustrates that a large blood perfusion rate is associated with an increase in tissue temperature. Our results imply that tissue hyperthermia has increased the local blood perfusion rate.
Figure 4. The measured temperature elevations above the core temperature as a function of the measured blood flow rate of the femoral artery.
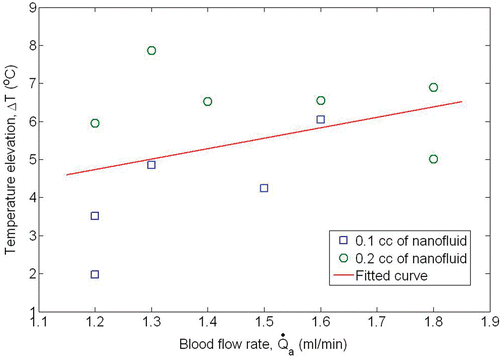
Table II. A summary of the measured variables.
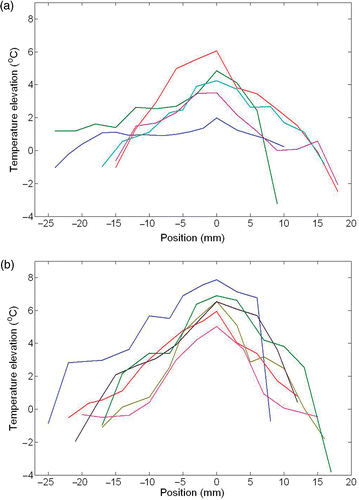
Temperature elevation profiles along the path are shown in for the injection amount of 0.1 cc and 0.2 cc, respectively. The maximum temperature rise (zero position) above the body core temperature occurs close to the injection site. A negative temperature elevation close to the skin surface implies that the skin is colder than the body temperature. Doubling the injection amount increases the temperature elevation by more than 70%, since the total amount of heat generated inside the tissue is directly related to the total number of nanoparticles in the solution. The induced maximum temperature elevations are 3.5 ± 1.8°C and 6.02 ± 0.8°C, respectively. The temperature elevation with the 0.2 cc injection is significantly different from that with 0.1 cc injection (p = 0.0065). Therefore, an injection of at least 0.2 cc ferrofluid would induce a temperature rise to more than 43°C, which is a typical temperature threshold in hyperthermia treatments. On the other hand, 0.1 cc injection would not be sufficient to achieve tissue necrosis.
Figure 5. The measured distribution of the temperature elevations above the core temperature along the tissue path inside the limb when (a) 0.1 cc and (b) 0.2 cc of ferrofluid were injected. Lines represent different rats.
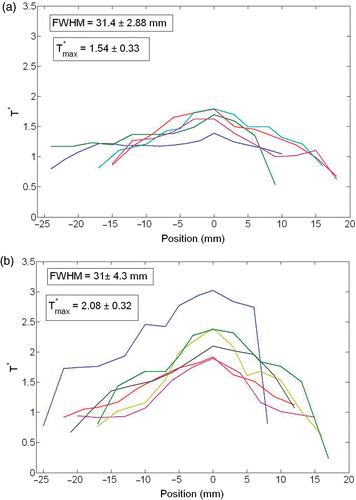
In this study we also examine how the temperature elevation distributes in the targeted tissue region. We investigate the temperature distribution based on the definition of a dimensionless temperature,where T is the temperatures along the tissue path, Tair is the surrounding air temperature and Trect is the recorded rectal temperature. The radial distribution of the dimensionless temperature in the tissue is plotted in . A value larger than unity implies that the measured temperature is higher than the body temperature. The average value of the dimensionless temperature has a maximum of 1.61 and 2.08 for the 0.1 cc and 0.2 cc injection, respectively. The thermally affected region is evaluated by the FWHM (full width of half maximum) of the temperature elevation. It is given by the distance between points on the temperature curve at which the temperature reaches half its maximum value. In this study, the FWHM is 31.0 ± 0.4 mm, which is equivalent to a spherical region of 31 mm in diameter. It is found that different injection amounts lead to a similar FWHM value.
Figure 6. Non-dimensional temperature distribution along the tissue path (T*) for different rats when (a) 0.1 cc and (b) 0.2 cc of ferrofluid were injected.
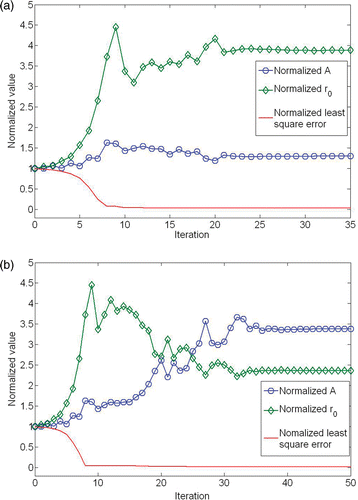
For future theoretical analyses of temperature elevation in tissue, it is convenient to have a determined expression of the volumetric heat generation rate induced by nanoparticles. The measured temperatures at each radial location were first averaged and represented by the error bars in . Displayed in the same figure is the theoretically predicted temperature distribution in the limb. Through curve fitting the theoretically predicted temperatures along the measuring path to the experimental data (the average temperature values), we obtained the adjustable parameters A and r0 in Equation 2. It is a good curve fitting with an R2 value larger than 0.75. The convergence of the estimated parameters using the Nelder-Mead simplex method can be seen in , which illustrate the iterations and the convergence of the objective function. The function tolerance is set as 10–4. The optimization algorithm converges after less than 100 iterations.
Figure 7. Averaged temperature measurements at various tissue site (symbol with error bar) and curve fit (line) using the inverse heat transfer analysis. (a) 0.1 cc and (b) 0.2 cc ferrofluid.
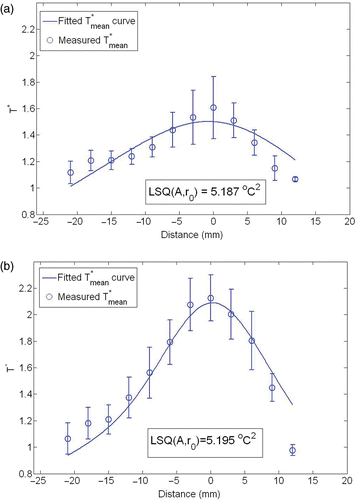
Figure 8. The convergence curves of A, r0 and the least square objection function obtained by the Nelder-Mead Simplex method. A and r0 were normalized by the initial guess of 50 kW/m3 and 3.5 mm respectively. (a) 0.1 cc and (b) 0.2 cc ferrofluid.
The values of the parameters A and r0 are listed in . As expected, the maximum volumetric heat generation rate at the injection site (r = 0) with the 0.2 cc nanofluid injection, A, is approximately twice that with the 0.1 cc injection. Again, the calculation can be interpreted as a result of doubling the nanoparticles in the tissue region. On the other hand, the r0 value is viewed as how the nanoparticles are spreading in tissue during the injection. It seems that the nanoparticles are more concentrated surrounding the injection site with the 0.2 cc injection than the 0.1 cc injection. The obtained curve fitting value of A is smaller than that obtained from our agarose gel experiment Citation[13]. It suggests that the muscle tissue may be sparser than the agarose gel used in the previous experiment and therefore, the nanoparticles are less concentrated in the vicinity of the injection site.
Table III. The calculated values of A and r0 based on the inverse heat transfer problem.
Discussion and conclusion
Although magnetic nanoparticle hyperthermia in cancer treatment holds great potential, it is severely limited by the fact that the anticipated heating distribution is difficult to control, and it leads to uneven and inadequate temperature elevation in tumor tissue. Transport of particles in tissue involves processes including extracellular transport of the carrier solution, transport of particles in the carrier solutions, and interaction between the particles and cell surface. The extracellular transport of nanoparticles in tumors is not well understood. In our previous experimental study of particle distribution in agarose gel, it has been demonstrated that a small injection rate of the nanofluid is crucial in producing a spherically distributed nanoparticle distribution Citation[13]. Based on the previous results, in this study we selected an injection rate of 10 μl/min. The total injection time was 10 and 20 minutes for 0.1 cc and 0.2 cc, respectively. Future clinical study on human subjects should investigate whether the time duration of the injection can be tolerated by patients.
Although the nanoparticle distribution in animal tissue is expected to be nearly spherical based on our gel experiment, many uncertainties existed in the in vivo animal study. The rat hind limb is not as homogeneous as the gel. It is still unknown from the current study whether local blood distribution played any role in the nanofluid transport in the muscle tissue. Although we did our best to select rats of similar sizes, to inject the nanofluid at the same muscle site, and to insert the thermocouple along the same path, the measured temperatures along the tissue path varied from one rat to another. A full understanding of the SAR distribution requires measuring the temperature distribution along multiple directions including the one perpendicular to the tissue path chosen in our experiment. Multiple insertions of the needle in the muscle might lead to the disturbance of the nanoparticles distribution in the tissue and to the destruction of small blood vessels and nerves. A non-invasive imaging technique would be more appropriate to address the limitations of the current study. After each experiment, the rat limb was cut open. The observation suggested that the variability of the nanofluid deposition in the muscle tissue may be the reason behind the temperature variations.
Unlike most of the previous studies that monitored temperature at one location, our experiments measured the temperature elevations at multiple locations and investigated how the injection amount affected the temperature distribution. The extraction of a mathematical expression for the SAR from the experimentally measured temperature distribution in animal models is unique. Such expression is readily applicable to theoretical simulation of the temperature distribution in tissue during magnetic nanoparticle hyperthermia. Most of the previous studies reported either an average value of the SAR or SAR at one tissue location. The only study that measured the distribution of the nanoparticles and the temperature distribution along the tumor was by Wust et al. Citation[19] based on a relationship between iron mass and CT density. Our SAR values evaluated by inverse heat transfer analyses were estimated to vary from 59 to 126 kW/m3 (or W/kg) when 0.1 or 0.2 cc of the nanofluid was injected. These values fall in the range of the findings reported by the previous studies reviewed in the introduction.
Controlling the nanoparticle deposition in tissue as spherical is important in better designing treatment protocol for cancer patients. In heat transfer using nanoparticle heating, even if the nanoparticles are confined in the vicinity of the injecting site, heat can still be transferred via tissue conduction which is less likely affected by the high hydrostatic pressure in tumor. Therefore, unlike drug delivery in cancer treatment that requires overcoming the hydrostatic pressure in tumor and achieving an elevated drug concentration in the entire tumor region, multiple injections of nanoparticle in tumors, especially tumors of irregular shape, can induce a relatively uniform temperature elevation if their locations are designed appropriately. A major difference between agarose gel and living tissue is the existence of the blood perfusion and the heterogeneous nature of the tissue. However, based on our previous experiment on agarose gel and using a smaller injection rate, the spherical shape of the particles distribution is still feasible especially at small blood perfusion rates. First, the injection rate we selected was relatively small and it was based on our previous agarose gel experiment. Secondly, the agarose gel has similar hydraulic properties to tumors as discussed in our previous experiments Citation[13]. Since the tissue is opaque, we cannot verify this without a high-resolution imaging technique to accurately map the spatial concentration. Using the measured temperature elevations to curve fit the Gaussian distribution of the SAR, we have obtained a good agreement between the theory and experimental data. The fact that the curve is not perfectly fitting the experimental data implies that the distribution of the nanoparticles after injection may not be perfectly spherical. Future experiments are needed to address the limitations of this study.
Once the deposition is nearly spherical, it is reasonable to propose a Gaussian distribution of the heating pattern (SAR) surrounding the injection site. Our results have shown a good agreement between the fitted curve and experimental measurements of the tissue temperature. The experimentally obtained SAR expression can be used in future theoretical simulation of the temperature elevation in tumors with a wide range of local blood perfusion rate. The value of r0 is found to be bigger when 0.2 cc of nanofluid are injected. At the beginning of the infusion, the distribution volume of the nanoparticles inside the tissue usually increases linearly with the infused volume. However, as we explained in our recently published paper, the nanoparticles are known to interact and adhere to the solid matrix of the gel/tissue Citation[13]. In other words, the nanoparticles deposition on the solid cellular matrix of the tissue impedes the convection and diffusion mechanism by increasing the tissue hydraulic resistance. Therefore, additional nanoparticles injected later will deposit and accumulate close to the injection site. This will increase the concentration of nanoparticles in the injection site, hence, result in a smaller r0 when more nanofluid is injected in the tissue. This phenomenon was observed by Prabhu et al. Citation[35] studying drug delivery to the brain. It was noticed that the slope of the curve of the distribution volume as a function of the infused volume increases first and then decreases after a threshold of injection amount.
Although magnetite is biocompatible as discussed previously, the amount of iron in living tissue may be harmful to tissue. It was reported by Bacon et al. Citation[36] that an iron concentration above 4 mg/g of wet liver tissue causes acute toxicity in liver. In magnetic nanoparticle applications, this concentration is usually found to be much higher than this threshold. Hilger et al. Citation[2] infused 21 mg of magnetite in 300 mm3 of tissue which is equivalent to 49 mg of iron per gram of tissue. In a recent investigation of magnetic nanoparticle hyperthermia on prostate cancer, Wust et al. Citation[19] used an iron concentration that is estimated to range between 31 and 58.45 mg/g. In our current study, the maximum value of the iron concentration at the injection site is estimated to be 5.9 and 11.8 mg/g when 0.1 and 0.2 cc of nanofluid, respectively, are injected. However, it was found by Johanssen et al. Citation[24] that the uptake of iron by the liver is about 9.74%. It was implied from their study that a higher iron concentration than the threshold can still be safe because of the low uptake. More studies are needed to investigate the uptake of iron by other tissues. In a situation when a high iron concentration is harmful to healthy tissue, the amount of 21 nanofluid should be decreased to an acceptable level. Temperature elevations in tissue can still be maintained by increasing the magnetic field strength.
In clinical applications, the tissue temperatures should reach a minimum temperature of 43°C Citation[1],Citation[37] in the tumor region. Clinical and animal studies have proposed that the minimal heating duration should be more than 2 hours when the temperatures are 43°C to lead to tissue neocrosis. The RF equipment used in our experiment would achieve a temperature above 43°C with a 0.2 cc nanofluid injection. Since the magnetic frequency and magnitude cannot be further increased in our experiment, using a high concentration nanofluid may result in higher temperature elevations in tissue. Another method to increase the temperature is to inject more nanofluid into the tissue. This was limited in our experiment by the size of the rat limb. In previous studies, a linear relationship between the maximum temperature elevation and the amount of nanofluid was reported by Hilger et al. Citation[16] for a given set of magnetic field parameters. Based on the Arrhenius relation, the heating duration can be halved when the temperature elevation is increased by 1°C Citation[25],Citation[37]. Manipulating magnetic field parameters, nanoparticle concentration, and/or injecting amount would result in the target temperature elevations in the tumor tissue and therefore, shortening the heating duration.
Further studies are necessary to study the effect of the blood perfusion rate on the temperature field. During hyperthermia a typical response of local blood perfusion rate to heating is increase in perfusion. The measured blood perfusion rates in this study is almost double that under normal conditions in a previous experimental study using rat limbs of similar weights Citation[38]. A limitation in our study is that we could not monitor the blood flow rate in the artery during the treatment due to the possible interaction of the metallic probe and the magnetic field. Therefore, it is unclear how the blood perfusion rate changed during the heating duration. On the other hand, the effect of the blood perfusion rate on the 22 temperature field can be studied using isolated rat limbs that are perfused by physiological perfusate Citation[31]. Using an isolated rat limb has the advantages of precise control and measurement of the perfusate flow rate through the femoral artery in the rat limb. Thus, temperature fields in the rat limb can be measured for a wide range of blood perfusion rate controlled by a pump which pumps the perfusate to the isolated limb. On the other hand, visualizing the nanoparticles’ distribution is crucial in future clinical applications. The previous study by Wust et al. Citation[19] used the CT density distribution to compute the distribution of iron mass that is related to the accumulation of nanoparticles in tissue. The improvement in the resolution of the visualization techniques will enhance the ability of accurately determining the nanoparticle distribution and their possible aggregation in opaque tissue. It may also be used to monitor the transport of nanoparticles and nanofluid in the porous tissue after injection, if the temporal resolution of these techniques is high enough to capture the transient changes. This is especially important for drug delivery applications using nanoparticles to study the efficacy of those approaches.
In conclusion, our study demonstrated the feasibility of the use of the rat limb as an experimental model to study magnetic nanoparticle hyperthermia. It suggests that using a more concentrated nanofluid and/or injecting more nanofluid to the tissue would elevate the tissue temperature way above 43°C. A larger amount of the nanofluid results in more concentrated nanoparticles surrounding the injection site and therefore, a higher temperature elevation in the tissue filed. The proposed Gaussian distribution of the SAR resulted in a good fit to the experimentally measured tissue temperatures. The obtained expression is readily applicable to future theoretical study to simulate temperature distributions and to design an optimal treatment protocol for tumor nanoparticle hyperthermia. Histological analyses will be performed in the future to evaluate thermal damage to actual tumors and to obtain more information about the nanoparticles distribution.
Acknowledgements
This research was supported in parts by an NSF grant CBET-0730732 and an UMBC DRIF grant. The research is performed in partial fulfilment of the requirements for the PhD degree from University of Maryland Baltimore County by Maher Salloum.
Declaration of interest: The authors report no conflicts of interest. The authors alone are responsible for the content and writing of the paper.
References
- Gilchrist RK, Medal R, Shorey WD, Hanselman RC, Parrott JC, Taylor CB. Selective inductive heating of lymph nodes. Ann Surg 1957; 146: 596–606
- Hilger I, Hergt R, Kaiser WA. Towards breast cancer treatment by magnetic heating. J Magn Magn Mater 2005; 293: 314–319
- Moroz P, Jones SK, Gray BN. Magnetically mediated hyperthermia: Current status and future directions. Int J Hyperthermia 2002; 18(4)267–284
- Hergt R, Andra W. Physical limits of hyperthermia using magnetite fine particles. IEEE T Magn 1998; 34(5)3745–3754
- Rosensweig RE. Heating magnetic fluid with alternating magnetic field. J Magn Magn Mater 2002; 252: 370–374
- Lv Y, Deng Z, Liu J. 3-D numerical study on the induced heating effects of embedded micro/nanoparticles on human body subject to external medical electromagnetic field. IEEE Trans Nanobiosci 2005; 4(4)284–294
- Matsuki H, Yanada T. Temperature sensitive amorphous magnetic flakes for intratissue hyperthermia. Mater Sci Eng 1994; A181/A182: 1366–1368
- Hilger I, Andra W, Hergt R, Hiergeist R, Schubert H, Kaiser WA. Electromagnetic heating of breast tumors in interventional radiology: In vitro and in vivo studies in human cadavers and mice. Radiology 2001; 218(2)570–575
- Arshady R, Kono K. Smart nanoparticles in nanomedicine. Kentus Books, London 2006; 8
- Curtis A. Biomedical aspects of magnetic nanoparticles. Europhys News 2003; 34(6)
- Kawai N, Ito A, Nakahara Y, Futakuchi M, Shirai T, Honda H, Kobayashi T, Kohri K. Anticancer effect of hyperthermia on prostate cancer mediated by magnetite cationic liposomes and immune-response induction in transplanted syngeneic rats. Prostate 2005; 64(4)373–381
- Hergt R, Hiergeist R, Zeisberger M, Glockl G, Weitschies W, Ramirez LP, Hilger I, Kaiser WA. Enhancement of AC-losses of magnetic nanoparticles for heating applications. J Magn Magn Mater 2004; 280: 358–368
- Salloum M, Ma RH, Weeks D, Zhu L. Controlling nanoparticle delivery in magnetic nanoaprticle hyperthermia for cancer treatment: Experimental study in agarose gel. Int J Hyperthermia 2008, (in press)
- Jordan A, Wust P, Fähling H, John W, Hinz A, Felix R. Inductive heating of ferrimagnetic particles and magnetic fluids: Physical evaluation of their potential for hyperthermia. Int J Hyperthermia 1993; 9(1)51–68
- Jordan A, Scholz R, Wust P, Fähling H, Krause J, Wlodarczyk W, Sander B, Vogl T, Felix R. Effects of magnetic fluid hyperthermia (MFH) on C3H mammary carcinoma in vivo. Int J Hyperthermia 1997; 13(6)587–605
- Hilger I, Hergt R, Kaiser WA. Effects of magnetic thermoablation in muscle tissue using iron oxide particles. Invest Radiol 2000; 35(3)170–179
- Johannsen M, Gneveckow U, Eckelt L, Feussner A, Waldofner N, Scholz R, Deger S, Wust P, Loening SA, Jordan A. Clinical hyperthermia of prostate cancer using magnetic nanoparticles: Presentation of a new interstitial technique. Int J Hyperthermia 2005; 21: 637–647
- Wang X, Gu H, Yang Z. The heating effect of magnetic fluids in an alternating magnetic field. J Magn Magn Mater 2005; 293(1)334–340
- Wust P, Gneveckow U, Johannsen M, Bohmer D, Henkel T, Kahmann F, Sehouli J, Felix R, Ricke J, Jordan A. Magnetic nanoparticles for interstitial thermotherapyfeasibility, tolerance and achieved temperatures. Int J Hyperthermia 2006; 22(8)673–685
- Johannsen M, Gneveckow U, Thiesen B, Taymoorian K, Cho CH, Waldöfner N, Scholz R, Jordan A, Loening SA, Wust P. Thermotherapy of prostate cancer using magnetic nanoparticles: Feasibility, imaging, and three-dimensional temperature distribution. Eur Urol 2007; 52(6)1653–1661
- Fortin JP, Wilhelm C, Servais J, Ménager C, Bacri JC, Gazeau F. Size-sorted anionic iron oxide nanomagnets as colloidal mediators for magnetic hyperthermia. J Am Chem Soc 2007; 129(9)2628–2635
- Fortin JP, Gazeau F, Wilhelm C. Intracellular heating of living cells through Néel relaxation of magnetic nanoparticles. Eur Biophys J 2008; 37(2)223–228
- Bagaria HG, Johnson DT. Transient solution to the bioheat equation and optimization for magnetic fluid hyperthermia treatment. Int J Hyperthermia 2005; 21(1)5–775
- Johannsen M, Jordan A, Scholz R, Koch M, Lein M, Deger S, Roigas J, Jung K, Loening S. Evaluation of magnetic fluid hyperthermia in a standard rat model of prostate cancer. J Endourol 2004; 18(5)495–500
- Johannsen M, Thiesen B, Jordan A, Taymoorian K, Gneveckow U, Waldofner N, Scholz R, Koch M, Lein M, Jung K. Magnetic fluid hyperthermia (MFH) reduces prostate cancer growth in the orthotopic Dunning R3327 rat model. Prostate 2005; 64: 283–292
- Jordan A, Scholz R, Maier-Hauff K, Van Landeghem FK, Waldoefner N, Teichgraeber U, Pinkernelle J, Bruhn H, Neumann F, Thiesen B, et al. The effect of thermotherapy using magnetic nanoparticles on rat malignant glioma. J Neuro-Oncol 2006; 78: 7–14
- Jin H, Kang KA. Application of novel metal nanoparticles as optical/thermal agents in optical mammography and hyperthermic treatment for breast cancer. Adv Exp Med Biol 2007; 599: 45–52
- Johannsen M, Thiesen B, Gneveckow U, Taymoorian K, Waldofner N, Scholz R, Deger S, Jung K, Loening SA, Jordan A. Thermotherapy using magnetic nanoparticles combined with external radiation in an orthotopic rat model of prostate cancer. Prostate 2006; 66(1)97–104
- Krinke GJ. The laboratory rat. Academic Press, San Diego and London 2000
- Diao C, Zhu L. Temperature distribution and blood flow response in rat brain during selective brain cooling. Med Phys 2006; 33(7)2565–2573
- He Q, Zhu L, Weinbaum S. Effect of blood flow on thermal equilibration and venous rewarming. Ann Biomed Eng 2003; 31: 659–666
- Lewandowski WM, Leble S. Study of free convective heat transfer from horizontal conic. Int J Heat Mass Trans 2003; 46: 4925–4934
- Pennes HH. Analysis of tissue and arterial blood temperature in the resting human forearm. J Appl Physiol 1948; 1: 93–122
- Lagarias JC, Reeds JA, Wright MH, Wright PE. Convergence properties of the Nelder-Mead simplex method in low dimensions. SIAM J Optim 1998; 9(1)112–147
- Prabhu SS, Broaddus WC, Gillies GT, Loudon WG, Chen ZJ, Smith B. Distribution of macromolecular dyes in brain using positive pressure infusion: A model for direct controlled delivery of therapeutic agents. Surg Neurol 1998; 50: 367–375
- Bacon BR, Tavill AS. Hemochromatosis: How much iron is too much?. Hepatology 1986; 6(1)14–2145
- Engin K. Biological rationale for hyperthermia in cancer treatment (II). Neoplasma 1994; 41(5)277–283
- He Q, Zhu L, Lemons DE, Weinbaum S. Experimental measurements of the temperature variation along artery-vein pairs from 200 to 1000 μm diameter in rat hind limb. J Biomech Eng 2002; 124(6)656–661

