
Abstract
Temperatures above the normal physiological threshold may cause damage to cells and tissue. In this study, the response of a culture of dissociated cerebral cortex cells exposed to laser-induced temperature gradients was examined. The cellular response was evaluated using a fluorescent dye indicating metabolic activity. Furthermore, by using a finite element model of the heating during the pulsed laser application, threshold temperatures could be extracted for the cellular response at different laser pulse lengths. These threshold temperatures were used in an Arrhenius model to extract the kinetic parameters, i.e. the activation energy (Ea), and the frequency factor (Ac), for the system. A damage signal ratio was defined and calculated to 5% for the cells to increase their metabolism as a response to the heat. Furthermore, efficient stimulation with 20-ms long laser pulses did not evoke changes in metabolism. Thus, 20 ms could be a potential pulse length for functional stimulation of neural cells.
Introduction
Exposing cells or tissue to elevated temperatures for a prolonged time increases the risk of heat-induced damage [Citation1]. For tissue ablation performed during surgery, this is the desired effect, while for other therapies, high control of the heating parameters is crucial to avoiding damage. Dewhirst et al. showed the need for high control of the thermal dosimetry [Citation2]. The main reason behind cellular damage and cell death due to heat is assumed to be denaturation of metabolically important proteins [Citation3]. Cell death begins at a threshold level of denaturation of 5% of the cellular content; however, the specific mechanism of cellular death due to hyperthermia is not clear [Citation3]. The transition of a cell from a live to a dead state was described as a first-order chemical reaction according to the Arrhenius model by Henriques in 1947 [Citation1]. Several papers have successfully described the heat response among cells according to the Arrhenius model [Citation4–7]. One method, with clinical relevance, is the cumulative equivalent minutes at 43 °C (CEM43) method that can be applied in studying tissue hyperthermia [Citation8,Citation9]. Pearce et al. showed in their models that there is a complex relationship between the tissue geometry and the laser parameters [Citation10]. Other authors have successfully applied more complex three-state models incorporating a vulnerable state in addition to the live and dead states [Citation11].
In the last 10 years, infrared neural stimulation (INS), has gained increased attention. It relies on local temperature elevations caused by infrared light to functionally stimulate excitable cells to depolarise. Several papers have been published showing that infrared light can be used as a stimulus to excite neurons, cardiac myocytes as well as to act as a cue for guiding cell growth [Citation12–15]. In addition to neural activation, neural inhibition has also been reported [Citation16–19]. INS has several advantages, such as variable depth of penetration, contact-free stimulation, and no electrochemical by-products. With short pulses the light will locally heat the water in and around the cells, and this has been implicated as the driving force of the excitation, though the precise mechanism is not known. Theories have been proposed, such as the activation of heat-sensitive receptors such as transient receptors potential vanilloid (TRPV) [Citation20,Citation21], intracellular mechanisms [Citation19], or capacitance changes of the cellular membrane [Citation22]. INS has the potential to be used in the next generation of cochlear implants, as well as in other neural prosthetic devices with the need for techniques for sending sensory information into the neural system. To further explore the technique of INS it is essential that the heating does not cause cellular damage. According to the literature successful stimulation has been achieved for temperature increases varying between 0.1 and 27 °C for pulse lengths ranging from microseconds to milliseconds [Citation16,Citation22,Citation23]. The lower end of these temperatures may be considered as non-damaging, but the higher end could potentially cause damage if used for a prolonged time. This suggests the need for further investigations of the heat response of cells and tissues considered for INS.
In this paper we investigate the effect of hyperthermia on a culture of dissociated primary rat cerebral cortex cells, as a comparison to a previous study performed on a culture of astrocytes in our group [Citation24]. We used a fluorescent dye for the cell metabolic activity, to identify the effect that pulses of different lengths had on a neural culture containing non-migrating cells. Temperatures were extracted using a model developed earlier by our group [Citation16], and the kinetic parameters for the system could thus be calculated as well as values for the thresholds for observable changes in cellular metabolism.
Materials and methods
Cell culturing
Fresh rat cortical slices (BrainBits Loughborough, UK) were dissociated and seeded (BrainBits protocol) on pre-prepared multi-electrode arrays (MEAs), type 60MEA200/30iR-Ti-gr, from Multichannel Systems (Reutlingen, Germany), and microscope glass slides. The preparation process of the substrates has been described earlier in detail [Citation16,Citation24]. Briefly, after cleaning and autoclaving the substrates, 100 μL of 1% polyethyleneimine (Sigma, St Louis, MO) in phosphate buffered saline (PBS) was applied to the centre of the glass substrates and the MEAs. Each droplet was evaporated in a laminar hood followed by rinsing three times, after which 20 μL mouse laminin solution (20 μL/mL (Invitrogen, Carlsbad, CA)) was then applied. After removal of the laminin, 20 μL of cell solution was applied. Approximate cell concentration was 100,000 cells/mL. Nb4Active medium (BrainBits) with antibiotics (Invitrogen was used, and changed every 3 days.
Laser heating
For the laser stimulation a 500 mW butterfly laser (Modulight, Tampere, Finland) was used. The laser operated with a wavelength of 1550 nm. Temperature and laser control equipment (Thorlabs, Newton, NJ) were used along with a 200 μm multimode fibre (NA 0.39, Thorlabs) that was connected to the fibre mounted to the laser. The fibre was positioned perpendicular to the substrates and the distance and position were controlled using a portable microscope (Dino-Lite Pro, AD413T, New Taipei City, Taiwan). For the laser stimulation, the pulsing of the laser was controlled using a pulse generator (Model 2100, AM Systems, Sequim, WA).
An experiment was started by placing a substrate in the substrate holder which was preheated to 37 °C. If a MEA was used, a head stage was attached to the substrate holder. The fibre was lowered into the cell chamber. The position and distance of the fibre was controlled using the portable microscope. Before the laser was started, 2 min were allowed for the system to stabilise and reach the steady-state temperature of 37 °C. The laser pulses used were divided into two groups: over 1-s long pulses and sub-second pulses (see ). The over 1-s long pulses were output as single pulses, and ranged from 2 s to 60 s. The sub-second pulses were output at a frequency of 10 Hz for 30 s, with pulse lengths ranging from 20 ms to 80 ms, i.e. 300 pulses in total.
Table 1. The parameters used in the modelling, as well as for the cellular experiments.
Fluorescence staining
Immediately after laser pulses had been applied to a substrate, the medium was replaced with medium containing 10% of the chemical cell viability dye Alamar Blue (Sigma), and incubated for 2 h. After 2 h the substrate was rinsed six times using PBS (Sigma). Alamar Blue has been widely used in studies of cell viability [Citation25]. The active chemical substance in Alamar Blue, resazurin, is reduced by metabolic products in the cell, therefore serving as a marker for cellular metabolic activity. It has been used for the detection of neuronal viability of cells in culture [Citation26]. Resazurin has an excitation peak at 570 nm, and an emission peak at 585 nm.
Cellular damage
To evaluate possible damage to the cortical cells caused by the laser, a damage criterion was set: any observed changes in cell morphology or fluorescence to the cells exposed to the laser were taken as being damage. The heating of the laser decreased radially from the centre, thus resulting laser damage caused circular areas that were chosen for further examination, i.e. measurement of the diameter of the mark. For each pulse length the temperature at the perimeter of the mark signifies the lowest damage signal necessary to trigger an increase in cell metabolism. Diameter measurements were performed using fluorescence microscopy (Leica DM Inverted Light microscope, Leica Microsystems, Heerbrugg, Switzerland) 2 h after application of the laser pulses. Two diameters were measured for each mark, and the radius was calculated from the average. The distance was measured from the point where no effect could be seen to the opposite side using microscopy software (Leica Application Suite, version 3.1.0). Furthermore, if a ring of increased fluorescence was observed, the diameter of the inner ring was measured in the same way as well. Thus, potentially two average radii could be achieved for a mark: an inner radius, and an outer radius.
Electrophysiological measurements
In addition, to verify that the laser experiments were performed on electrically active cultures, electrophysiological measurements were performed on MEA substrates 2 weeks after seeding. For an electrophysiological experiment a MEA was positioned in the substrate holder, and a head stage (MEA-1060 Headstage from Multichannel Systems) connected to two 16-channel amplifiers (Micro Electrode Amplifier, Model 3600, AM Systems) was attached. The signal was amplified 10,000 times, the amplifier output was fed into a computer, and DataWave (SciWorks, version 6.0, Winston-Salem, NC) analysing software was used for recording the electrical activity from the cells of the MEA. For each experiment 16 electrodes were active for recording of the neural activity. The active electrodes were the central 16 electrodes (4 × 4).
The neural activity on MEAs was analysed based on the number of spontaneously occurring bursts. A burst was defined as a strong and temporally defined increase in neural activity lasting for about 100 ms, and detected on multiple electrodes. In this study the number of bursts detected before laser stimulation was compared to the number of bursts afterwards. To investigate whether 20 ms laser pulses affected the neural activity, measurements of the electrical activity as a response to the laser were performed. First, five activity measurements, each lasting 1 min were performed on a MEA, followed by the laser application using 20-ms pulses for 30 s at 10 Hz. Immediately after the pulsed laser another five measurements were performed, each lasting 1 min.
Modelling
A multi-physics model was created using software from COMSOL (COMSOL Multiphysics, 2011, version 4.2a, Stockholm, Sweden) for modelling the heat transfer during laser stimulation. Details about the model have been published [Citation16], but a short summary follows. For the parameters used, see . The model describes the dynamic temperature distribution during laser heating of a non-turbid medium according to the heat transfer equation:
(1)
where p = 994.1 kg m−3 is the density at 35 °C; Cp = 4178 J kg−1 K−1 is the specific heat capacity at constant pressure at 35 °C; T is the temperature (K); t is time (s); u is the velocity vector (m s−1); k = 0.6252 W m−1 K−1 is the thermal conductivity at 37 °C; Q is heat sources other than viscous heating (W m−3). The equation calculates heat transfer in a region over time due to diffusion. Convectional heat transfer is based on differences in temperature that leads to density variations in a volume, resulting in a flow of mass and heat to equilibrate the system.
A cylindrical volume, 1 mm in diameter, represented the geometry used in the model. The geometry was positioned so that it included parts of the glass substrate, central parts of the fibre tip, and the water in between. The laser beam was described as a Gaussian divergent beam, and an intensity profile for the beam was created using Matlab (Mathworks, 2010a, Natick, MA) [Citation16]. Due to the Gaussian profile and the water absorption, the intensity of the light decreased with distance and could be described using the Lambert–Beer law of absorption and the Gaussian function. At the wave length used, 1550 nm, the water absorption coefficient was 1064.4 m−1 [Citation27]. In previous publications the validity of the model was confirmed using both local temperature measurements [Citation16], and simulations using different heat equation parameters [Citation24].
The simulations were performed in the order as follows. First, for second-long pulses, a simulation was executed to find the temperature profile at steady-state, from the centre to a radial distance of 500 μm at a height of 0.1 μm above the glass surface, i.e. at the cell layer level. Next, the threshold temperatures according to the limit of the fluorescence described in the section Cellular damage, above, were extracted from the simulation. These temperatures were used for the calculation of the activation energy (Ea), and a combined frequency factor (Am), in the Arrhenius first-order chemical reaction model. Following that, we simulated the temporal dependence of the temperature for each pulse length at the corresponding radius of observable changes in fluorescence. The temporal profile was used for calculating a damage signal ratio, described in the next section.
Arrhenius model for the damage
As was shown in a previous study, a first-order chemical reaction model according to Arrhenius could be used to describe the kinetics of cellular damage due to heat shocks. For details of the mathematical background, see the previous study [Citation24].
The following equation can be used to calculate the resulting decrease of an unspecified internal chemical component, C, in response to a heat pulse.
(2)
where C0 is the initial concentration, Cthreshold the critical threshold where a decrease of the chemical component causes damage. C can for example be a native-state protein that is denatured, due to heating, with cellular damage as a result. Ac is the frequency factor (s−1), Ea is the reaction activation energy (kJ⋅mol−1), R is the universal gas constant (8.314 J⋅mol−1⋅K−1) and T(t) is the current value of the absolute temperature (°K) and τ is the length of the laser pulse (s).
By using the Arrhenius model the damage signal ratio (DSR) was defined as:
(3)
where C1 is the remaining concentration of C after the cell has been subjected to damage, calculated by the Arrhenius model. This relationship is evaluated at the perimeter, where C1 = Cthreshold, to yield the DSR threshold for damage. To calculate Ea and Ac the following equation was fitted to a plot of the temperature (K) and the pulse length (s) [Citation24]:
(4)
where
(5)
ln(Cthreshold/C0) is termed the damage integral, and is often assumed to be equal to −1 for cell death, but in our case that assumption is not possible as our damage criterion does not necessarily include cell death. The fitting of the curve was performed using Matlab. To determine the damage integral from Am or from EquationEquation 2
(2) we need to decide the frequency factor Ac. Using the relationship previously proposed by He et al. [Citation28], an approximation of Ac can be made:
(6)
where Ta is 316.75 K, R is the gas constant (8.314 × 10⁻³ kJ mol−1 K−1), and U = 1/s. This relationship has been determined to be valid for most proteins, cells, and tissues [Citation28].
Non-isothermal heating
Two approaches can be used considering the heating during laser stimulation. The first is isothermal heating where the pulse is approximated with a square pulse, neglecting the heating and cooling phases of a pulse, potentially adding an error to the result. The other approach is non-isothermal heating, where the nonlinear behaviour during the heating and cooling phase is considered. For the calculations of the DSR values in this paper, the non-isothermal method is used, in order to not neglect the error that the isothermal calculations adds, as was shown in previous studies [Citation6,Citation24].
Results
Heat modelling
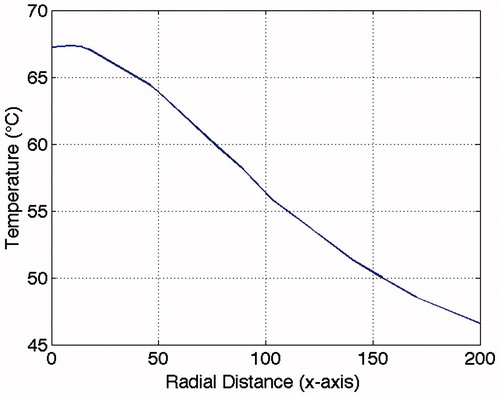
The model calculated the peak temperature to be 67 °C in the centre of the laser beam for ove 1-s long pulses, with a radial decrease in temperature (see ). The temperature was just below 47 °C 200 μm from the centre. Within 100 ms, 90% of the final temperature was reached, and the temperatures at selected distances were extracted for further analysis.
Figure 1. Simulated temperature distribution radially along the x-axis at steady-state at the cellular level. The peak temperature was 67 °C, and dropped to just below 47 °C 200 μm from the centre. Laser power: 250 mW, start temperature: 37 °C, distance glass surface to fiber tip: 200 μm.
Diameter measurements
With the light microscopy, marks were barely visible for any pulse length. However, with fluorescence microscopy, marks could be seen for all nine over 1-s long pulses (2–60 s). For examples of four pulse lengths, see . A ring of cells with high metabolic activity was noticed during inspection. This ring was more prominent for pulse lengths longer than 6 s. For the shorter pulse lengths, 2 and 4 s, the elevated activity in the marks were more evenly distributed, some rings were seen but difficult to measure. Therefore the inner diameters for the 2-s and 4-s pulses were disregarded. Two diameters were measured, an inner and an outer diameter. The white lines in for the 10-s pulse show how the measurements were performed. See and for the calculated average radii for the inner and outer radii. The general trend observed during the experiments was that longer pulses caused a larger area of elevated metabolic activity. The average thickness of the ring was 50.4 ± 3.8 μm for the seven pulse lengths used for calculation. This results in an average temperature difference between the inner and outer perimeter of the ring of 6.9 °C ± 0.4 °C.
Figure 2. Light microscopy and fluorescence microscopy image of the marks of four pulse lengths (as indicated in the images). (A) The marks are barely visible in the light microscopy image, but clearly visible in the fluorescence image; (B) the white lines in the 10-s mark indicate how the diameter measurements were performed (scale:μm). Scale bar: 200 μm.
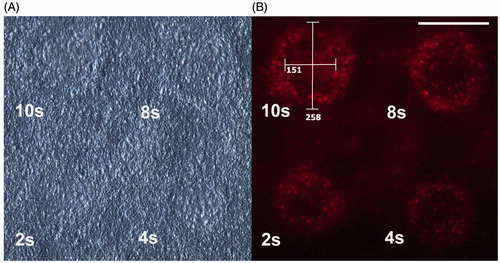
Table 2. The average outer radial distances calculated from the diameters measured 2 h following laser exposure, the corresponding extracted temperatures, and the number of measurements (n).
Table 3. The average inner radial distances calculated from the diameters measured 2 h following laser exposure, the corresponding extracted temperatures, and the number of measurements (n).
Arrhenius plot
Temperatures from were extracted at the corresponding distance according to . These distances were at the damage limit according to the criteria set earlier. The extracted temperatures were used in the analysis, and by fitting the temperature pulse duration data with EquationEquation 4(4) , the activation energy, Ea, and the combined frequency factor, Am, were calculated (see ). The fitted values were 333.6 kJ mol−1 (Ea) and 1.50 × 1052 s−1 (the combined frequency factor), which according to EquationEquation 6
(6) , yielded a frequency factor, Ac, of 9.76 × 1050 s−1.
Figure 3. The temperature (K) at the perimeter of the damage plotted versus laser pulse durations (s), and the resulting curve fit (solid line) using the Arrhenius model, T = Ea/(R·ln(t·Am)). The fit gave the activation energy Ea of 333.6 kJ mol−1 and the combined frequency factor Am, of 1.50 × 1050 s−1 (See for data). The goodness of the fit (R2) is 0.988, which indicates a good fit.
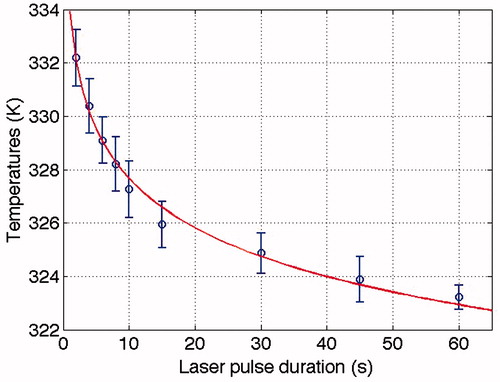
The activation energy, Ea, and the combined frequency factor, Am, in this paper closely match the values from the previous study [Citation24]: 333.6 kJ⋅mol−1 compared to 321.4 kJ mol−1, and 1.50 × 1052 s−1 compared to 1.50 × 1050 s−1. To compare the radii the results of the extracted temperatures from the two studies were plotted together (see ).
Figure 4. Comparison of the extracted temperatures (K) from the previous astrocyte study [Citation24] (stars and blue dashed line) and the present cortical cell study (circles and red solid line). The comparison show that the results match, and that both curves are plotted within the standard deviations.
![Figure 4. Comparison of the extracted temperatures (K) from the previous astrocyte study [Citation24] (stars and blue dashed line) and the present cortical cell study (circles and red solid line). The comparison show that the results match, and that both curves are plotted within the standard deviations.](/cms/asset/12af05d8-d195-4d48-9d76-f04c43c70ce1/ihyt_a_1181275_f0004_c.jpg)
Pulsed heating
Of the four sub-second pulse lengths used, 40 ms, 60 ms and 80 ms gave clearly visible fluorescence marks, which indicate increased metabolic activity. The 20 ms pulses did not show any increase in metabolic activity (see ). For most of the 60 ms and 80 ms pulses, rings of activity were observed that were similar to the ones observed for the over 1-s long pulses. The size of the marks increased with increased pulse length. See for the calculated average radii for the marks, as well as the simulated peak temperatures when the system reached steady state [Citation16]. As a comparison, the values for the 30-s pulses (See and ) were added to .
Figure 5. Fluorescence microscopy (top) and corresponding light microscopy (bottom) images of four positions exposed to sub-second pulses. Total stimulation time was 30 s, with a pulse frequency of 10 Hz (i.e. 300 pulses). The 20-ms pulses gave no visible mark, whereas the other three did so. The size of the marks increased with increased pulse length. Scale bar: 200 μm.
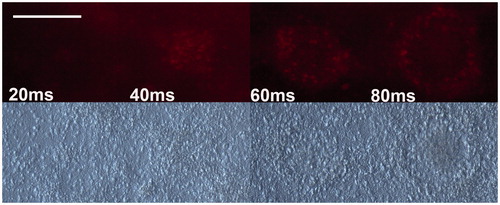
Table 4. The average radial distances calculated from the diameters measured 2 h following laser exposure, the corresponding extracted peak temperatures and the number of measurements (n) for the four sub-second pulse lengths. Note that values for the 30-s pulse have been added for comparison.
Electrophysiological measurements
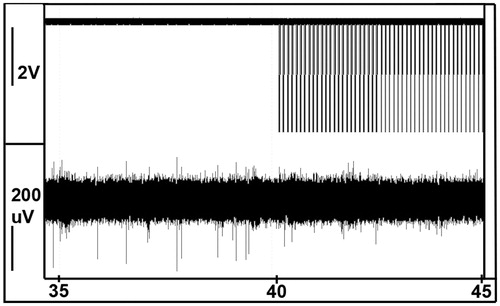
Neural networks with varying degrees of activity were confirmed using electrophysiological recordings. Both single action potentials and bursts were detected. A decrease in activity was detected following the application of 20-ms laser pulses. The number of bursts before application of the laser was 10.8 (±1.3) and decreased to 6.4 (±1.1) after the laser pulses. On the control MEA, the number of bursts was 7.0 (±3.4) for the first five measurements, and 6.6 (±3.8) for the following five measurements. During the pulsing no bursts were detected, and a decrease in the number of spontaneous action potentials, detected on the electrodes, see . The electrode was positioned about 500 μm away from the centre of the laser. After the laser pulsing the activity returned.
Figure 6. Lowering of spontaneous action potential activity on one electrode during application of sub-second laser pulses, positioned about 500 μm away from the centre of the laser. Top trace is the laser trigger output.
Damage thresholds
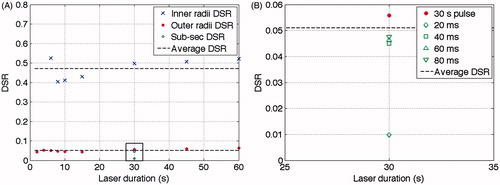
The DSR was calculated for all pulses, both over 1-s long (2 s to 60 s), and sub-second long pulses (20 ms to 80 ms) (see ). Furthermore, the average DSR for the outer radii was just above 0.05, and 0.47 for the inner radii (black dashed lines in ).
Figure 7. The calculated damage signal ratios, DSR, for all pulse lengths. (A) Blue crosses: DSR for the inner radii. Red dots: DSR for the outer radii. Green circles: DSR for the sub-second radii. Black dashed lines: the average DSR for outer radii (0.051) and inner radii (0.47) respectively. (B) Enlargement of the box in the lower part of A, showing the DSR for the 30-s pulse as well as the sub-second pulses. The DSRs for the sub-second pulses were positioned at 30 s, which is the total length of all pulsed stimulations. Note that the 20 ms pulses did not give any observable effect on the cells but was the calculated maximum value of the DSR at the center on the beam.
Discussion
In a previous paper [Citation24], the response of cultured astrocytes exposed to infrared laser light with different pulse lengths was investigated. It was concluded that the elevated temperatures caused the cells to migrate away from the heated zone. For longer pulse lengths dead cells remained in the centre of the marks. Furthermore, a damage signal ratio for the cells was calculated to be 6% for the cells to start migrating. In this study the same experimental parameters were used to investigate the heat response of cultured primary cortical cells, i.e. a mixture of both neurons and neuroglia, with astrocytes making up the greater number of the neuroglia. Astrocytes are the most abundant cell type of the neuroglia in the human brain, and have several important functions such as regulation of neuronal excitability and synaptic transmission [Citation29]. This motivates the investigation of the heat response not only from neurons, but also from supporting cells of the nervous system.
Pre-experiments showed that in contrast to the experiments with only astrocytes, where the resulting marks were clearly visible and could be measured without any problems, the laser marks for the cortical culture were very hard to distinguish in light microscopy. This can be seen in and . The marks from the laser are barely visible, making it difficult to measure the diameter satisfactorily. Therefore, an additional method had to be used. We chose the chemical dye Alamar Blue, which has previously been proven to be successful for use in cortical cultures as a viability marker [Citation26]. Using the metabolic marker Alamar Blue, we could clearly distinguish between cells affected by the laser, and cells without any visible effect. The use of dyes for metabolic activity is an enhancement of our method, giving us the possibility to investigate the response not only of migrating cells, such as astrocytes, but also non-migrating cells, such as neurons. We suggest that the current method of exposing cells to a temperature gradient () can be used with different cellular markers as a versatile tool for investigating how cells respond to elevated temperatures.
As the activation energies and the frequency factors in this study and the previous [Citation24] closely match each other, it leads to the suggestion that the diameters in this study were measured on migrating astrocytes as well, since all experimental parameters were the same except for the cultured cells. Furthermore, the goodness of the two fitted curves were also close to each other: 0.977 for the previous study and 0.988 for these results ( and ). From , a plausible suggestion is that both studies are dealing with the migration of astrocytes caused by the heating of the laser pulses. This can also be expected if astrocytes are the most numerous cells in the culture. In that case, it shows that the astrocyte reaction is the same, despite the presence of other cell types, such as neurons, in the cortical culture. However, we cannot distinguish the specific influence on the fluorescence from other cell types, such as neurons, although we expect these to have an increased metabolism as well.
According to our previous results [Citation24], all astrocytes migrated away from the centre of the laser mark for laser pulses shorter than 10 s. For longer laser pulses, a cell island remained in the centre, which was confirmed to contain only dead cells using a live/dead assay. Therefore we suggest that the activity in the marks presented in this paper for shorter pulse lengths are due to increased metabolic activity in the cells unable to migrate away, potentially neurons. Hence, we assume that astrocytes are migrating in this culture as well. An argument that supports this suggestion is that the differences between the outer radii of the astrocyte culture and the cortical culture are within the standard deviation of the measurements. This means that the limit of the visible morphological changes match the outer limit of the fluorescent ring. That raises another important question about what is happening in the fluorescent ring and why a fluorescent area and rings are clearly visible.
A suggestion is that the rings are visible due to elevated metabolism of the cells migrating due to the heat. But it could also be due to the increased cell density caused by cells moving outwards and clumping in the ring. Similarly, a combination of the suggestions above, that the rings are visible due to clumping of migrating cells with elevated metabolism as a response to the elevated temperatures, is also possible. For shorter pulse lengths, more specifically 2- and 4-s pulses, no cells were seen in the centre of the marks in the previous paper [Citation24], whereas in this paper the fluorescent marks shows that living cells remain in the centre of the marks. Therefore, the fluorescence of those marks is not due to cell clumping, but potentially to non-migrating cells with elevated metabolism. Weak rings were seen for the short pulses, though they were hard to measure, and therefore disregarded. This indicates that the ring formation was due to migrating astrocytes. The previous study clearly showed that the laser killed cells while using longer pulses.
Therefore in this study we assume that there exist dead cells within the marks. The Alamar Blue stain only shows cells with metabolic activity that might be dying, however, despite still being alive at the time of analysis.
To extract the parameters of the intracellular signal, a two-state model was applied. Fitting the data using Arrhenius made it possible to extract the kinetic parameters and the R2 value, 0.988, indicating a good fit, even better than that in the previous paper, and comparable to other models published [Citation4,Citation6] The curve in can be used to describe safety thresholds for cerebral cortex cells, i.e. what combination of pulse length and temperature causes cellular migration and potential damage. All combinations of pulse lengths and temperatures below the curve will not cause any elevated metabolism – that is to say, no damage according to the criteria set earlier. On the other hand combinations resulting in a data point above the curve will result in increased metabolism and thus to potential cell damage.
The calculation of the DSR in for the outer and inner radii indicates two thresholds for the cortical cells: an inner threshold with a DSR of 47%, and an outer threshold with a DSR of 5%. Between these thresholds cells with strong fluorescence were found in pulses ranging from 6 s to 60 s. The thresholds can be interpreted as meaning that for a DSR increase above 5% of the initial value, the metabolism of the cells increases and astrocytes starts to migrate. The difference in average DSR in this study compared to the astrocyte study, showing a DSR of 6% [Citation24], suggests that the Alamar Blue method might be slightly more sensitive than using light microscopy for observing cellular changes. A closer examination of the laser-induced marks presented in the astrocyte study reveals another limit closer to the centre than the limit used for extracting temperatures. This limit was the border between migrating cells and the inner area with no cells, creating a ring of migrating cells about the same size as the ring calculated in this study. It is a suggestion that this ring is also the fluorescent ring in the present study. That could be interpreted as a DSR between 5 and 47% resulting in a mixture of both dead and alive cells. According to the astrocyte study, all cells remaining in the middle for a pulse length longer than 10 s were dead, but the data in this study show metabolic activity for the cells remaining in the centre. This can be interpreted as dying cells, but with enough enzymes still functioning to reduce the Alamar Blue dye.
Sub-second pulsing
The results of the sub-second pulsing in this study should be connected to the use of ms-long pulses for INS published earlier [Citation16]. So far there have been a limited number of studies investigating the possible damage to cells using ms-long pulses, but the previous study suggested that 20 ms-long pulses did not cause any visible changes in morphology of astrocytes [Citation24], whereas 40-ms pulses showed weak differences. Those results are confirmed in this paper, where no increased fluorescence could be observed for 20-ms pulses, whereas increased fluorescence was observed for 40-ms pulses (). However, activity measurements performed showed that there was an inhibitory effect on network activity for 20-ms pulses (), as was noticed earlier [Citation16]. In the previous study the inhibitory effect observed lasted during the onset of the laser. In this study, the bursting activity vanished during the pulsing as a possible response to the laser onset. Furthermore, the amount of bursts decreased in the following measurements. We speculate that the effect during pulsing might be due to a laser-induced heat block, as observed by Mou et al. [Citation18], where elevated temperatures caused a block of both the generation and propagation of action potentials. It should be noted that these laser-induced temperature changes were performed by 1 min of continuously applied low-power laser. Also Duke et al. [Citation17] recently observed inhibition and block of neural activity, in both Aplysia axon, and rat myelinated peripheral nerve, using much shorter pulse lengths (ms). Due to the lack of increased metabolic activity for the 20-ms pulses we suggest that the observed inhibition was not caused by heat damage. Of course, the statistics need to be improved by further measurements, but since reversible inhibitory responses have been reported before, we believe this to be an observation worth mentioning.
The diameters of the fluorescent marks increased with increasing pulse length. One suggestion is that the increased metabolism was caused by a heat shock response, resulting in increased levels of heat shock proteins, such as hsp68 [Citation30], for example. As no damage could be observed for the 20-ms pulses, we know that the DSR is larger than 1%, see . The DSR values for the 40-, 60- and 80-ms pulses were all positioned close to each other, relatively close to the average DSR value of 5%. The difference between the 30-s DSR and the sub-second DSR, just below 1%, might be due to a measurement error, or a difference in the damage response, comparing over 1-s long pulses with sub-second pulses.
Conclusions
A cell culture of rat primary cortical cells was exposed to laser pulses, and responses were observed as increased circular fluorescent marks. The limit of the marks could be used as threshold temperatures for calculating the kinetic parameters of the system using a two-state Arrhenius model. The activation energy, Ea, was calculated to 333.6 kJ⋅mol−1, and the frequency factor, Ac, to 9.76 × 1050 s−1. The chemical dye Alamar Blue served as a more sensitive technique than simple visual observation of heat-induced damage. These results show a new method for investigating the heat response of non-migrating cells. The damage signal ratio for the system was calculated to 5% for the cells to initiate elevated metabolism. Pulse lengths of around 20 ms and shorter did not trigger changes in metabolism, and could thus potentially be used within the field of INS.
Disclosure statement
The authors report no conflicts of interest. The authors alone are responsible for the content and writing of the paper.
References
- Henriques FC Jr. Studies of thermal injury; the predictability and the significance of thermally induced rate processes leading to irreversible epidermal injury. Arch Pathol (Chic) 1947;43:489–502.
- Dewhirst MW, Abraham JP, Viglianti BL. Evolution of thermal dosimetry for application of hyperthermia treatment to cancer. Adv Heat Transfer 2015;47:397–421.
- Lepock JR. Cellular effects of hyperthermia: relevance to the minimum dose for thermal damage. Int J Hyperthermia 2003;19:252–66.
- Simanovskii DM, Mackanos MA, Irani AR, O'Connell-Rodwell CE, Contag CH, Schwettman HA, Palanker. DV. Cellular tolerance to pulsed hyperthermia. Phys Rev E 2006;74:011915.
- Pearce J. Mathematical models of laser-induced tissue thermal damage. Int J Hyperthermia 2011;27:741–50.
- He X, Bischof JC. The kinetics of thermal injury in human renal carcinoma cells. Ann Biomed Eng 2005;33:502–10.
- Bhowmick S, et al. In vitro thermal therapy of AT-1 Dunning prostate tumours. Int J Hyperthermia 2004;20:73–92.
- Dewhirst MW, Viglianti BL, Lora-Michiels M, Hanson M, Hoopes PJ. Basic principles of thermal dosimetry and thermal thresholds for tissue damage from hyperthermia. Int J Hyperthermia 2003;19:267–94.
- Viglianti BL, Dewhirst MW, Gorman JM, Abraham JP, Sparrow EM. Rationalization of thermal injury quantification methods: application to skin burns. Burns 2014;40:896–902.
- Pearce JA, Thomsen S. Kinetic models of laser-tissue fusion processes. Biomed Sci Instrum 1993;29:355–60.
- O’Neill DP, Peng T, Stiegler P, Mayrhauser U, Koestenbauer S, Tscheiliessnigg K, et al. A three-state mathematical model of hyperthermic cell death. Ann Biomed Eng 2011;39:570–9.
- Ebbesen CL, Bruus H. Analysis of laser-induced heating in optical neuronal guidance. J Neurosci Methods 2012;209:168–77.
- Dittami GM, Rajguru SM, Lasher RA, Hitchcock RW, Rabbitt RD. Intracellular calcium transients evoked by pulsed infrared radiation in neonatal cardiomyocytes. J Physiol 2011;589:1295–306.
- Wells J, Kao C, Konrad P, Milner T, Kim J, Mahadevan-Jansen A, Jansen ED. Biophysical mechanisms of transient optical stimulation of peripheral nerve. Biophys J 2007;93:2567–80.
- Izzo AD, et al. Selectivity of neural stimulation in the auditory system: a comparison of optic and electric stimuli. J Biomed Opt 2007;12:021008-1–7.
- Liljemalm R, Nyberg T, von Holst H. Heating during infrared neural stimulation. Lasers Surg Med 2013;45:469–81.
- Duke AR, Jenkins MW, Lu H, McManus JM, Chiel HJ, Jansen ED. Transient and selective suppression of neural activity with infrared light. Sci Rep 2013;3:2600. doi: 10.1038/srep02600.
- Mou Z, et al. A simulation study of the combined thermoelectric extracellular stimulation of the sciatic nerve of the Xenopus laevis: the localized transient heat block. IEEE Trans Biomed Eng 2012;59:1758–69.
- Rajguru SM, et al. Infrared photostimulation of the crista ampullaris. J Physiol 2011;589:1283–94.
- Bec JM, Albert ES, Marc I, Desmadryl G, Travo C, Muller A, et al. Characteristics of laser stimulation by near infrared pulses of retinal and vestibular primary neurons. Lasers Surg Med 2012;44:736–45.
- Albert ES, Bec JM, Desmadryl G, Chekroud K, Travo C, Gaboyard S, et al. TRPV4 channels mediate the infrared laser-evoked response in sensory neurons. J Neurophysiol 2012;107:3227–34.
- Shapiro MG, Homma K, Villarreal S, Richter CP, Bezanilla F. Infrared light excites cells by changing their electrical capacitance. Nat Commun 2012;3:736–746.
- Thompson AC, Wade SA, Brown WG, Stoddart PR. Modeling of light absorption in tissue during infrared neural stimulation. J Biomed Opt 2012;17:075002.
- Liljemalm R, Nyberg T. Quantification of a thermal damage threshold for astrocytes using infrared laser generated heat gradients. Ann Biomed Eng 2013:42:822–32.
- Rampersad SN. Multiple applications of Alamar Blue as an indicator of metabolic function and cellular health in cell viability bioassays. Sensors (Basel) 2012;12:12347–60.
- White MJ, DiCaprio MJ, Greenberg DA. Assessment of neuronal viability with Alamar Blue in cortical and granule cell cultures. J Neurosci Methods 1996;70:195–200.
- Wieliczka DM, Shengshan W, Querry MR. Wedge shaped cell for highly absorbent liquids: infrared optical constants of water. Applied Optics 1989;28:1714–19.
- He X, Bischof JC. Quantification of temperature and injury response in thermal therapy and cryosurgery. Crit Rev Biomed Eng 2003;31:355–422.
- Douglas Fields DR. The other brain: the scientific and medical breakthroughs that will heal our brains and revolutionize our health. New York: Simon & Schuster, 2009.
- Nishimura RN, Dwyer, BE, Clegg K, Cole R, de Vellis, J. Comparison of the heat shock response in cultured cortical neurons and astrocytes. Brain Res Mol Brain Res 1991;9:39–45.