
Abstract
Introduction: For computational models of microwave ablation (MWA), knowledge of the antenna design is necessary, but the proprietary design of clinical applicators is often unknown. We characterised the specific absorption rate (SAR) during MWA experimentally and compared to a multi-physics simulation.
Methods: An infrared (IR) camera was used to measure SAR during MWA within a split ex vivo liver model. Perseon Medical’s short-tip (ST) or long-tip (LT) MWA antenna were placed on top of a tissue sample (n = 6), and microwave power (15 W) was applied for 6 min, while intermittently interrupting power. Tissue surface temperature was recorded via IR camera (3.3 fps, 320 × 240 resolution). SAR was calculated intermittently based on temperature slope before and after power interruption. Temperature and SAR data were compared to simulation results.
Results: Experimentally measured SAR changed considerably once tissue temperatures exceeded 100 °C, contrary to simulation results. The ablation zone diameters were 1.28 cm and 1.30 ± 0.03 cm (transverse), and 2.10 cm and 2.66 ± −0.22 cm (axial), for simulation and experiment, respectively. The average difference in temperature between the simulation and experiment were 5.6 °C (ST) and 6.2 °C (LT). Dice coefficients for 1000 W/kg SAR iso-contour were 0.74 ± 0.01 (ST) and 0.77 (± 0.03) (LT), suggesting good agreement of SAR contours.
Conclusion: We experimentally demonstrated changes in SAR during MWA ablation, which were not present in simulation, suggesting inaccuracies in dielectric properties. The measured SAR may be used in simplified computer simulations to predict tissue temperature when the antenna geometry is unknown.
Introduction
Microwave ablation (MWA) procedures play an increasingly important role in the treatment of cancer. Compared to radiofrequency ablation, MWA induces faster heating over a larger volume of tissue, is more effective near vasculature, is effective in tissues with relatively high electrical impedance (such as lung or charred tissue), can utilise multiple applicators, and does not require ground pads [Citation1]. MWA procedures are typically performed with image guidance (X-ray computed tomography (CT) or ultrasound) to help localise the disease, inform device placement, and facilitate post-ablation confirmation of the treated zone. Nevertheless, on a patient-specific basis, MWA still has many unknowns with regard to the power dissipation from the antenna, as well as biophysical effects in tissue adjacent to the antenna and at the treatment margin [Citation2,Citation3].
Preoperative patient-specific planning and visualisation tools have the potential to improve the reliability of MWA procedures as both a palliative and curative treatment modality. Predictive planning is becoming increasingly important for MWA procedures as clinicians move towards standardising therapeutic approaches. The attempted clinical goal for most MWA procedures is to ablate the entire tumour with an additional margin (typically ∼5–10 mm) along the target circumference to account for any residual cancerous cells that may not be detected via imaging [Citation4,Citation5]. An inadequate ablation margin may result in residual disease left behind after treatment that leads to tumour recurrence [Citation6,Citation7].
The current standard for MWA planning is restricted to 2D comparison of the desired treatment effect region with the dimensions of ellipsoidal parameterisations derived from applicator-specific ex vivo tissue tests. Some new systems provide overlays of these ellipsoids on pretreatment imaging [Citation8]. This approach to estimating the treatment effect region is independent of any specific patient and ignores the effects of tissue perfusion, tumour type and location, and the influence of surrounding anatomy present in actual clinical procedures. Furthermore, the use of 2D ablation zone predictions on 3D anatomy places a considerable burden on the physician’s spatial treatment planning skill, and treatment accuracy may be skewed by physician experience. To facilitate personalised treatment delivery and simplify planning for physicians, there has been renewed interest in the development of modelling and visualisation techniques towards treatment planning of ablation treatments [Citation9–11].
Mathematical models of the thermoelectric processes that occur during MWA have been employed during the design and optimisation of devices for MWA [Citation12–18]. These models use numerical techniques to solve the partial differential equations that govern electromagnetic propagation, power deposition, and bioheat transfer [Citation19,Citation20]. Such models may help physicians to choose the treatment parameters (e.g. number of antennas, applied power levels, antenna insertion paths) that maximise the likelihood of a desired treatment outcome. Predictive modelling tools are of particular clinical relevance due to the shortage of practical techniques for intraoperative monitoring of thermal damage. Relatively few simulation platforms have been adapted for planning ablation procedures [Citation10,Citation11,Citation21,Citation22]. Challenges with creating an MWA simulation framework include limited patient-specific knowledge of tissue biophysical properties, integrating data from clinical imaging datasets with computational models, impracticality of lengthy computational times within the clinical workflow, and, critically, ignorance of the vendor‘s proprietary applicator geometries and antenna material properties.
Current MWA models often include multi-physics simulation techniques to compute the electric field and electromagnetic power absorption profile within tissue. Calculation of the electric field radiated by a particular applicator requires knowledge of the antenna geometry and antenna material properties. However, the proprietary design of applicators currently in clinical use is almost always unknown. Alternative simulation techniques that characterise the power absorption pattern during MWA without requiring knowledge of proprietary antenna design information could facilitate bioheat transfer modelling within clinical treatment planning.
Infrared (IR) thermographic SAR measurement, which has been in use for several decades [Citation23], is well suited to temperature measurements because of the high spatial resolution afforded by commercial thermal cameras, and the wide field of view that enables temperature measurement of an entire cross-sectional plane in a single experiment. Some work has been done to investigate thermographic SAR measurements and minimising associated measurement errors under experimental conditions for external applicators [Citation24]. Gladman et al. measured SAR for interstitial hyperthermia devices using an IR thermogaphic system using a technique similar to the one we adopted in this work [Citation25]. They acquired serial IR thermographic measurements during multiple heating and cooling periods using a tissue equivalent phantom and computed the errors caused by thermal conduction and convection when calculating SAR from thermography. In that study, the phantom was layered so that the interstitial device was not exposed during heating; so, temperature data acquisition was limited to the period immediately following heating. Another study used thermocouples to acquire temperature data and then used these data to correct for thermal conduction errors during tissue heating [Citation26].
The goal of this study was to examine any differences between the SAR profile predicted by multi-physics simulations and the corresponding SAR profile computed from experimentally measured temperature profiles with an IR camera. This study employed commonly used commercial antennas (Perseon Medical short-tip and long-tip antennas, Salt Lake City, UT) with geometry known by the authors. This study served two purposes: (1) it provided an experimental validation of the multi-physics model using proprietary geometry information, and (2) the experimental SAR data enabled us to demonstrate an alternative modelling strategy using experimentally measured SAR profiles to guide MWA simulations without knowledge of the antenna geometry.
Methods
Experimental set-up
We used the experimental set-up illustrated in to estimate the SAR profile in fresh ex vivo porcine liver tissue. We performed a total of six studies and measured the change in temperature during ablation with either of two clinically employed 915-MHz MWA antennas: Perseon Medical’s short-tip (ST) antenna (n = 3), or long-tip (LT) antenna (n = 3). Liver tissue samples were placed in 0.9% saline until tissue temperature was completely equilibrated with water-bath temperature (21 °C). The MW antenna was placed in firm contact on top of a tissue sample. An IR camera (Mikron M7500, Hancock, MI) was positioned above the sample and additional thermocouples (Model IT-18, Physitemp, Clifton, NJ) were placed on the tissue surface approximately 5 cm from the antenna (outside heated zone) to calibrate temperature values derived from the IR camera. We assumed tissue emissivity of 0.9 [Citation27]. The tissue surface temperature was recorded via IR camera (∼3.3 fps, 320 × 240 resolution) for the duration of the experiment and the image sequence was stored for later image analysis. Microwave power (15 W) was applied to the antenna for a total of 6 min, and antenna cooling by room temperature water was initiated just before power was turned on. Power was interrupted for ∼5 s every 20 s (0–2 min), or every 30 s (2–6 min). At the end of each study a photographic image was taken to visualise the coagulation zone.
Figure 1. Set-up for experimental measurement of SAR. (a) Tissue sample is heated with MW antenna and temperature is recorded with infrared (IR) camera data and thermocouples. (b) Transient temperature data is analysed for each pixel and (c) SAR is calculated. Thermocouples are used to calibrate IR camera data temperature.
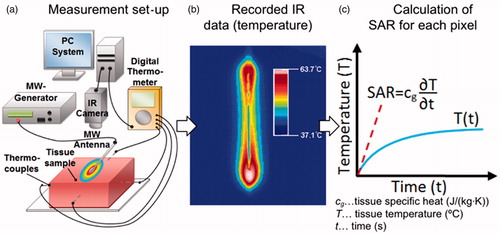
The initial rate of temperature rise was calculated for each pixel from the IR imaging data (). In addition, the slope of temperature rise/fall was calculated just before and just after each time the power was turned off (t−off, t+off) with a ∼3-s time interval for slope calculation. Similar to a prior study [Citation26], SAR was calculated during heating from these two slopes as specified in EquationEquations 1(1) and Equation2
(2) .
(1)
(2)
In both equations c is the specific heat, k is the thermal conductivity, and ρ is the density of the tissue sample. Since the tissue temperature is equal immediately before (t−off), and immediately after (t+off) the power is turned off, the heat conduction term (first right-hand term in EquationEquations 1(1) and Equation2
(2) ) also has to be identical as it depends on the temperature gradient; however, SAR equals 0 immediately after the power is switched off (t+off), leaving only the thermal conduction term in EquationEquation 2
(2) .
SAR during MW heating (i.e. just before power is turned off) can then be calculated by subtraction of EquationEquation 2(2) from EquationEquation 1
(1) , i.e. by subtraction of the two temperature slopes before and after power is turned off (EquationEquation 3
(3) ):
(3)
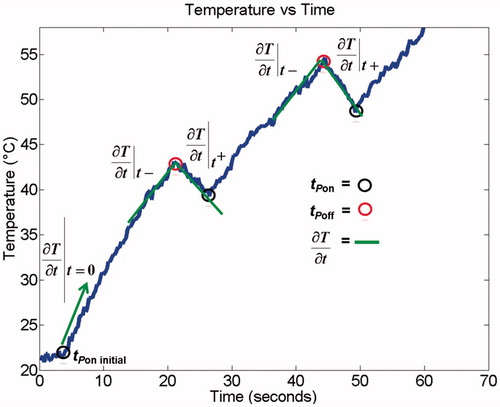
Thus, we were able to calculate SAR at the beginning of each experiment, as well as each time power was transiently turned off, every 20 s (0– min), or every 30 s (2–6 min) as illustrated in .
Figure 2. Example temperature change at a specific location during an ablation experiment in which the power was intermittently turned off to correct for thermal conduction.
Data analysis of experiments
Experimental IR temperature measurements and subsequent transient SAR spatial profiles were post-processed using MATLAB R2013b (Mathworks, Natick, MA). The spatial temperature changes captured by the IR camera were compared to a previously validated simulation model using the Perseon ST antenna [Citation9] that mimicked the same experimental set-up (discussed in the next section). The initial and transient SAR profiles were compared to the simulation as well. The simulated ablation zone and SAR profile (SARsim) were compared to the experimentally measured ablation zone and SAR profile (SARexp) using a Dice coefficient (EquationEquation 4(4) ).
(4)
Simulation framework
Biophysical model
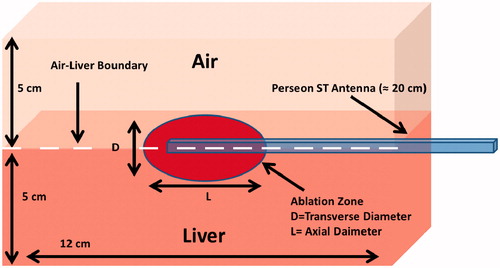
A 3D model was employed in this study as illustrated in . The simulation geometry illustrated is similar to the experimental set-up previously discussed in which half of the antenna was immersed within the liver tissue sample and half was exposed to air. The finite element method was implemented in COMSOL Multiphysics version 4.4 (Burlington, MA) to simulate the experiment described. The model used to simulate the ablation experiments for this study was used in a previous study to quantify clinical margin variability during MWA treatments [Citation9].
Figure 3. Simulation geometry of the MWA antenna at an air–liver boundary that was compared to the experimental temperature and SAR data. Note that the ablation zone is on the surface of the liver (not in air), and the distance from the ablation zone to the simulation boundary (edge of liver) is approximately 6–8 cm.
Material properties
EquationEquations 5–7 show the electromagnetic and heat transfer processes resolved in the simulation:
(5)
(6)
(7)
In EquationEquations 5–7, μr is the relative permeability ratio which is unity for all of the materials in this model, E (V m−1) is the electric field, k0 is the propagation constant in free space, ɛr is relative permittivity ratio, σ (S m−1) is electrical conductivity, ɛ0 (F/m) is the permittivity of free space, and ω (rad s−1) is angular frequency. ρ (kg m−3) is the density, Cp (J kg−1°C−1) is the heat capacity at constant pressure for the tissue, T (°C) is the temperature, k (W m−1°C−1) is the thermal conductivity, and SAR (W/kg) is the specific absorption rate. presents the temperature dependent dielectric and thermal properties used in our simulations within liver. The parameterisations of permittivity and electrical conductivity in liver tissue were also employed in a prior investigation for modelling MWA procedures within liver at 915 MHz [Citation9]. Moreover, a similar linear approximation for thermal conductivity was used, where k0 is the thermal conductivity at the reference temperature, k1 is a temperature coefficient, and T and T0 are the transient and reference temperatures [Citation28,Citation29]. Determinations of k0 and k1 were based on experimental data previously reported for experiments performed on human and porcine liver [Citation30,Citation31]. We used a temperature-dependent specific heat capacity parameterisation in our simulation. A Gaussian function centred on the boiling point of water was used to simulate the added heat sink associated with tissue water evaporation [Citation32]. We assumed constant physical properties for air (σair = 0 S m−1, kair = 0.0257 W m−1°C−1, Cp air = 1.005 J kg−1°C−1)
Table 1. Temperature-dependent liver dielectric and thermal property parameterisation used in the models.
Results
The spatial profiles of SAR and temperature at several time points during the ablation for the short-tip (ST) and long-tip (LT) applicators are illustrated in and – both for experimental data and for computer simulation. For both figures the thermal conduction correction (EquationEquations 1–3) was applied for SAR calculations from experimental temperature data. shows a photograph of the ablation zone following a 15-W, 6-min ablation using the short-tip and long-tip applicators. provides a comparison of the simulated and experimentally measured radial temperature profiles after 6 min using the short-tip and long-tip applicators. The average difference in temperature between the simulation and experimentally measured temperature for data, for the short-tip and long-tip applicators was 5.6 °C and 6.2 °C, respectively. is a comparison of ablation zone dimensions between simulation and experiment using a short-tip applicator. The 60 °C isothermal contour was used to compare the extent of the ablation zone of simulation versus experiment. The ablation zone diameters were 1.28 cm and 1.30 ± 0.03 cm (transverse) and 2.10 cm and 2.66 ± 0.22 cm (axial), for simulation and experiment, respectively. Dice coefficients for the 1000 W/kg SAR iso-contour were 0.74 ± 0.01 (ST) and 0.77 ± 0.03 (LT), suggesting good agreement of SAR contours. shows a comparison of transient SAR profile between experiment and simulation, for a short-tip antenna. contains Dice coefficient comparison of the SAR profiles for the ex vivo ablation experiments to the simulated transient profile at various time points, and for both antennas.
Figure 4. (a) Experimental (top) and simulated (bottom) temperature profiles during the course of an ablation experiment using the short-tip applicator. (b) Experimental (top) and simulated (bottom) SAR spatial profiles during the course of an ablation experiment using the short-tip applicator. Black lines indicate antenna position. White dotted lines in (a) at t = 360 s mark the position where the temperature profile is plotted in .
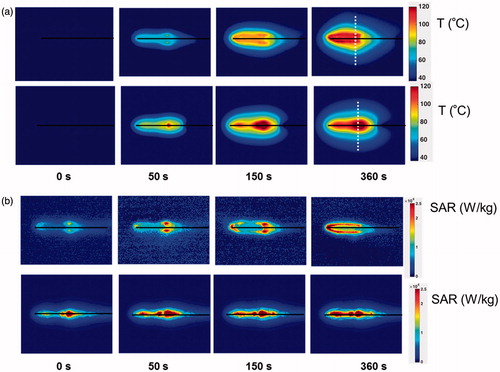
Figure 5. (a) Experimental (top) and simulated (bottom) temperature profiles during the course of an ablation experiment using the long-tip applicator. (b) Experimental (top) and simulated (bottom) SAR spatial profiles during the course of an ablation experiment using the long-tip applicator. Black lines indicate antenna position. White dotted lines in (a) at t = 360 s mark the position where the temperature profile is plotted in .
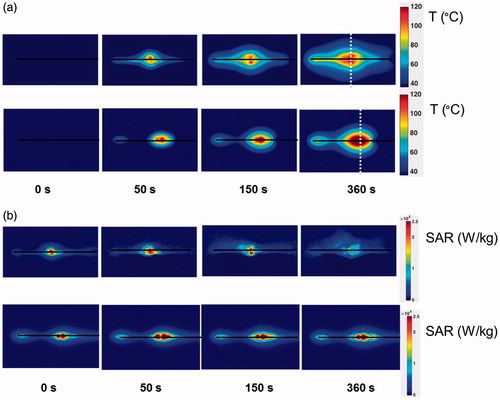
Figure 6. Axial view of a 15-W, 6-min ablation on an ex vivo liver sample using the short-tip applicator (left) and long-tip applicator (right).
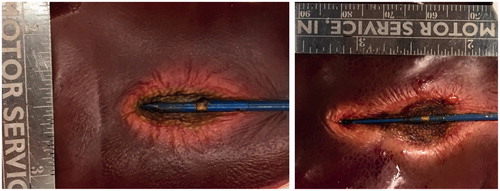
Figure 7. Radial temperature profile along dotted line in Figures 4 and 5, compared between simulation and experiment using (a) the short-tip (ST) and (b) the long-tip (LT) applicators. Temperature is shown after 6 min of ablation. Average difference between experiments and simulation was 5.6 °C (ST applicator) and 6.2 °C (LT applicator).
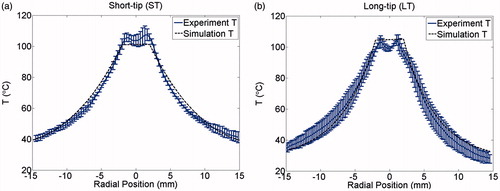
Figure 8. Comparison of simulation and experiment using the short-tip (ST) applicator. The solid black line is the simulation and each individual shade of grey line corresponds to a different actual experiment. The 60 °C isothermal contour was used to compare the extent of the ablation zone of simulation versus experiment (n = 3) at 1 min (DSC agreement =0.79 ± 0.07)), 3 min (DSC agreement =0.83 ± 0.03) and 6 min (DSC agreement =0.85 ± 0.03). Temperature maps are shown from the simulation.
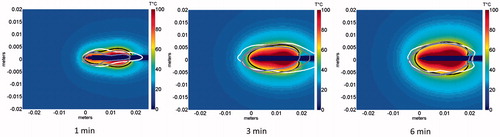
Figure 9. Comparison of simulated transient SAR profile with the experimentally measured SAR profile during ablation for the short-tip antenna. Note that only the simulated SAR profile captures the antenna outline (see arrow), which contributes to the discrepancy in Dice coefficients between the model and the experiment.
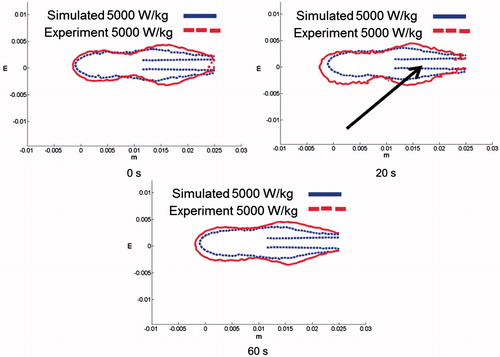
Table 2. Dice coefficient (DSC) comparison of the SAR profiles between ex vivo experiments and simulation at various time points, for both short-tip and long-tip applicators.
Discussion
In this study we quantified tissue temperature and SAR of two clinically employed MWA antennas via IR camera measurements on ex vivo liver tissue, similar to prior studies [Citation23–25]. By intermittently turning power off we were able to correct for thermal conduction (EquationEquations 1(1) , Equation2
(2) and Equation3
(3) ) and thus calculate SAR both initially and during ablation, to characterise changes in SAR. We used the results of these experimental measurements to validate a prior multi-physics MWA model [Citation9]. There was reasonable agreement in temperature, with an average error of 5.9 °C between model and experiment (). Similarly, shape and dimension of the ablation zone (defined by the 60 °C isotherm) agreed well, with deviations of 0.3 cm (traverse diameter) and 0.4 cm (axial diameter, and ). There was, however, a considerable change in SAR over the course of the ablation observed during the experiments, which was apparent to a much lesser extent in the computer models. In experimental studies hot spots were apparent during the first 150 s but disappeared later in both short-tip and long-tip applicator experimental studies ( and ). While SAR also changed in the computer models and became more uniform during heating, the change was much less pronounced. This suggests that the temperature dependence of tissue properties – particularly that of dielectric properties – was not adequately captured in the simulation, resulting from limited dielectric property data available at high temperatures. This lack of available data is likely due to the difficulty of directly measuring the temperature dependence of dielectric properties at high temperatures (>100 °C). While there is lack of temperature-dependent dielectric data for 915 MHz at high temperatures, measurements at 2.45 GHz suggest values of tissue electrical conductivity and permittivity drop considerably at temperatures in excess of ∼80 °C, presumably attributable to loss of tissue water [Citation33,Citation34]. Assuming a similar trend at 915 MHz would explain the reductions in SAR at tissue temperatures in excess of 100 °C. The experimental results support this explanation since considerable changes in SAR occur only once tissue temperature exceeds 100 °C (see , t = 360 s). These differences in SAR correspond to parallel differences in the temperature profiles, with more uniform temperature surrounding the antenna in experimental studies, and larger temperature gradients in the computer simulations.
A comparison of simulated SAR profile to experimentally measured SAR profile for a 15-W, 6-min ablation with the short-tip (ST) applicator at different time points is illustrated in . shows approximately 72–83% agreement between the simulated and experimentally measured transient SAR profiles for both short-tip (ST) and long-tip (LT) applicators. The 18–20% discrepancy between simulation and experiment depicted in and can be explained by the differences in SAR described above, and because the simulated ablation captured the SAR along the shaft of the antenna (see , arrow).
In this study we experimentally demonstrated considerable change in SAR during MW ablation. SAR also changed in the computer simulation; however, it was to a much lesser extent, likely due to inaccuracies in temperature dependence of dielectric properties. Nevertheless, the ablation zone dimensions between simulation and experiment agreed reasonably well, suggesting that the impact of this change in SAR during heating is somewhat limited. Thus, current modelling approaches are reasonably accurate, but could benefit from knowledge of high temperature dielectric property data.
Our data also suggest feasibility of a novel modelling approach of incorporating experimentally measured SAR during the course of an ablation may provide a simplified technique for modelling MWA procedures with clinical applicators without requiring detailed knowledge of the applicator construction. Such a simulation approach would also be computationally less demanding as the electromagnetic problem (EquationEquation 5(5) ) does not need to be solved. While we employed IR thermometry in this study, the proposed technique to estimate SAR changes during heating may also be employed with magnetic resonance thermometry [Citation35] to facilitate 3D measurements in vivo.
It is important to note that our approach was evaluated for a single tissue type (liver), and that future studies should assess this approach in other tissues (e.g. kidney, lung). Moreover, the measurements and simulations were performed based on normal liver tissue only. However, since prior studies measured only a small difference in dielectric properties between malignant and normal human liver tissue [Citation36,Citation37], our data are likely applicable also to liver tumour tissue. This premise is further supported by a recent computer modelling study, where MWA ablation zones varied only slightly when considering heterogeneity between tumour and normal tissue dielectric properties, compared to assuming homogeneous properties [Citation9]. Additional studies have identified other heterogeneous tissue properties such as blood perfusion between tumour and normal tissue to be a more relevant factor for accurate modelling of MWA than dielectric properties [Citation9,Citation38]. As such, the proposed approach affords inclusion of patient-specific blood perfusion in thermal models to address the growing interest in MWA treatment planning.
Conclusion
The focus of this study was to experimentally characterise the transient power deposition pattern during MWA, given a commercially available antenna with known geometry, and compare these to a computer model. The experimental results suggest significant changes in SAR during heating which were not present in simulation results. While tissue temperature and ablation zone dimensions agreed reasonably well between model and experiment, knowledge of dielectric properties at high temperatures will likely improve model accuracy. The experimentally measured SAR data may potentially be used in simplified computer simulations to predict ablation zone dimensions for MWA when the antenna geometry is unknown, without the need to solve the electromagnetic equations.
Disclosure statement
This work was supported by US National Institutes of Health (NIH) grant no. R01CA181664. Part of the work was conducted in a facility constructed with support from the NIH, grant no. C06 RR018823 from the Extramural Research Facilities Program of the National Center for Research Resources. The authors alone are responsible for the content and writing of the paper.
References
- Lubner MG, Brace CL, Hinshaw JL, Lee FT Jr. Microwave tumor ablation: Mechanism of action, clinical results and devices. Vasc Interv Radiol 2010;21(Suppl8):S192–S203.
- Yu H, Burke CT. Comparison of percutaneous ablation technologies in the treatment of malignant liver tumors. Semin Interv Radiol 2014;31:129–37.
- Ahmed M, Brace CL, Lee FT Jr, Goldberg SN. Principles of and advances in percutaneous ablation. Radiology 2011;258:351–69.
- Ahmed M, Kumar G, Moussa M, Wang Y, Rozenblum N, Galun E, Goldberg SN. Hepatic radiofrequency ablation-induced stimulation of distant tumor growth is suppressed by c-Met inhibition. Radiology 2016;279:103–17.
- Ahmed M, Solbiati L, Brace CL, Breen DJ, Callstrom MR, Charboneau JW, et al. Image-guided tumor ablation: standardization of terminology and reporting criteria a 10-year update. Radiology 2014;273:241–60.
- Lu DS, Yu NC, Reman SS, Limanond P, Lassman C, Murray K, et al. Radiofrequency ablation of hepatocellular carcinoma: treatment success as defined by histologic examination of the explanted liver 1. Radiology 2005;234:954–60.
- Lanuti M, Sharma A, Willers H, Digumarthy SR, Mathisen DJ, Shepard JA. Radiofrequency ablation for stage I non-small cell lung cancer: management of locoregional recurrence. Ann Thorac Surg 2012;93:921–8.
- MicroThermX®. Microwave Ablation Synchrowave ST Antenna: instructions for use. 2013.
- Deshazer G, Merck D, Hagmann M, Dupuy D, Prakash P. Physical modelling of microwave ablation zone clinical margin variance. Med Phys 2016;43:1764.
- Yeniaras E, Fuentes DT, Fahrenholtz SJ, Weinberg JS, Maier F, Hazle JD, Stafford RJ. Design and initial evaluation of a treatment planning software system for MRI-guided laser ablation in the brain. Int J Comput Assist Radiol Surg 2014;9:659–67.
- Schumann C, Rieder C, Haase S, Teichert K, Süss P, Isfort P, et al. Interactive multi-criteria planning for radiofrequency ablation. Int J Comput Assist Radiol Surg 2015;10:879–89.
- Chakaravarthi G, Arunachalam K. Design and characterisation of miniaturised cavity-backed patch antenna for microwave hyperthermia. Int J Hyperthermia 2015;31:737–48.
- Cavagnaro M, Amabile C, Cassarino S, Tosoratti N, Pinto R, Lopresto V. Influence of the target tissue size on the shape of ex vivo microwave ablation zones. Int J Hyperthermia 2015;31:48–57.
- Yang D, Bertram JM, Webster JG, Will JA. A floating sleeve antenna yields localized hepatic microwave ablation. IEEE Trans Biomed Eng 2006;53:533–7.
- Brace CL. Dual-slot antennas for microwave tissue heating: parametric design analysis and experimental validation. Med Phys 2011;38:4232–40.
- Cavagnaro M, Amabile C, Bernardi P, Pisa S, Tosoratti N. A minimally invasive antenna for microwave ablation therapies: design, performances, and experimental assessment. IEEE Trans Biomed Eng 2011;58:949–59.
- Prakash P, Converse MC, Webster JG, Mahvi DM. An optimal sliding choke antenna for hepatic microwave ablation. IEEE Trans Biomed Eng 2009;56:2470–6.
- McWilliams BT, Schnell EE, Curto S, Fahrbach TM, Prakash P. A directional interstitial antenna for microwave tissue ablation: theoretical and experimental investigation. IEEE Trans Biomed Eng 2015;62:2144–50.
- Prakash P. Theoretical modeling for hepatic microwave ablation, Open Biomed Eng J 2010;4:27–38.
- Chiang J, Wang P, Brace CL. Computational modelling of microwave tumour ablations. Int J Hyperthermia 2013;29:308–17.
- Fuentes D, Cardan R, Stafford RJ, Yung J, Dodd GD III, Feng Y. High-fidelity computer models for prospective treatment planning of radiofrequency ablation with in vitro experimental correlation. J Vasc Interv Radiol 2010;21:1725–32.
- Zhai W, Xu J, Zhao Y, Song Y, Sheng L, Jia P. Preoperative surgery planning for percutaneous hepatic microwave ablation. Med Image Comput Comput Assist Interv 2008;11:569–77.
- Guy A. Analysis of electromagnetic fields induced in biological tissues by thermographic studies on equivalent phantom models. IEEE Trans Biomed Eng 1971;19:205–14.
- Samaras T, Rhoon GCV, Sahalos JN. Theoretical investigation of measurement procedures for the quality assurance of superficial hyperthermia applicators. Int J Hyperthermia 2002;18:416–25.
- MD Shera, Gladman AS, Davidson SRH, Easty AC, Joy ML. Infrared thermographic SAR measurements of interstitial hyperthermia applicators: errors due to thermal conduction and convection. Int J Hyperthermia 2004;20:539–55.
- Haemmerich D, Schutt DJ, Dos Santos I, Webster JG, Mahvi DM. Measurement of temperature-dependent specific heat of biological tissues. Physiol Meas 2005;26:59–67.
- Soerensen DD, Clausen S, Mercer JB, Pedersen LJ. Determining the emissivity of pig skin for accurate infrared thermography. Comput Electron Agric 2014;109:52–58.
- Baldwin SA, Pelman A, Bert JL. A heat transfer model of thermal balloon endometrial ablation. Ann Biomed Eng 2001;29:1009–18.
- Byeongman J, Aksan A. Prediction of the extent of thermal damage in the cornea during conductive thermokeratoplasty. J Therm Biol 2010;35:167–74.
- Choi J, Morrissey M, Bischof JC. Thermal processing of biological tissue at high temperatures: impact of protein denaturation and water loss on the thermal properties of human and porcine liver in the range of 25–80 °C. J Heat Transf 2013;35:061302.
- Rossman C, Haemmerich D. Review of temperature dependence of thermal properties dielectric properties, and perfusion of biological tissues at hyperthermic and ablation temperatures. Crit Rev Biom Eng 2014;42:467–92.
- Abraham JP, Sparrow EM. A thermal-ablation bioheat model including liquid-to-vapor phase change, pressure- and necrosis-dependent perfusion, and moisture-dependent properties. Int J Heat Mass Transf 2007;50:2537–44.
- Lopresto V, Pinto R, Lovisolo GA, Cavagnaro M. Changes in dielectric properties ex vivo bovine liver during microwave thermal ablation at 2.45 GHz. Phys Med Bio 2012;57:2309–27.
- Brace CL. Temperature-dependent dielectric properties of liver tissue measured during thermal ablation: toward an improved numerical model. Conf Proc IEEE Eng Med Biol Soc 2008;2008:230–3.
- Winter L, Oberacker E, Paul K, Ji Y, Oezerdem C, Ghadjar P, et al. Magnetic resonance thermometry: methodology, pitfalls and practical solutions. Int J Hyperthermia 2016;32:63–75.
- Stauffer P, Rossetto F, Prakash M, Neuman DG, Lee T. Phantom and animal tissues for modelling the electrical properties of human liver. Int J Hyperthermia 2003;19:89–101.
- O’Rourke AP, Lazebnik M, Bertram JM, Converse MC, Hagness SC, Webster JG, Mahvi DM. Dielectric properties of human normal, malignant and cirrhotic liver tissue: in vivo and ex vivo measurements from 0.5 to 20 GHz using a precision open-ended coaxial probe. Phys Med Biol 2007;52:4707–19.
- Sebek J, Albin N, Bortel R, Natarajan B, Prakash P. Sensitivity of microwave ablation models to tissue biophysical properties: a first step towards probabilistic treatment modeling and treatment planning. Med Phys 2016;43:2649–61.