
Abstract
A comprehensive study was performed to quantify the risk of burns from hot beverage spills. The study was comprised of three parts. First, experiments were carried out to measure the cooling rates of beverages in a room-temperature environment by natural convection and thermal radiation. The experiments accounted for different beverage volumes, initial temperatures, cooling period between the time of service and the spill, the material which comprised the cup, the presence or absence of a cap and the presence or absence of an insulating corrugated paper sleeve. Among this list, the parameters which most influenced the temperature variation was the presence or absence of a cover or cap, the volume of the beverage and the duration of the cooling period. The second step was a series of experiments that provided temperatures at the surface of skin or skin surrogate after a spill. The experiments incorporated a single layer of cotton clothing and the exposure duration was 30 s. The outcomes of the experiments were used as input to a numerical model which calculated the temperature distribution and burn depth within tissue. Last was the implementation of the numerical model and a catalogue of burn predictions for various beverage volumes, beverage service temperatures, and durations between beverage service and spill. It is hoped that this catalogue can be used by both beverage industries and consumers to reduce the threat of burn injuries. It can also be used by treating medical professionals who can quickly estimate burn depths following a spill incident.
Introduction
Skin burns from scald events may cause serious injuries and occur with great frequency throughout the world. Proper treatment is critically dependent on a correct assessment of the burn severity. In practice, burns are categorised by both depth and the surface area of the injury. Perhaps the most common categorisation of burn depth is made with the degree designation. Under this mode of categorisation, first-degree burns refer to those that are contained within the outermost skin layer (the epidermis). Second-degree burns are those that extend into the dermal layer; third-degree burns usually refer to injuries that pass completely through the dermis.
First-degree burns generally heal quickly without medical intervention. Nevertheless, they can be painful and are accompanied by hyperaemia and flushing. Second-degree burns take on different appearances depending on their penetration into the dermis, and they tend to damage structures in the dermis such as blood vessels, hair follicles and sweat glands. These burns are often accompanied by blistering and redness. These burns have the potential to heal without scarring or medical intervention; however, if the surface area extent is very large, or if secondary infections occur, they can be serious. They are also often quite painful.
Third-degree burns are accompanied by ischaemia because the blood vessels to all the skin structure are damaged or destroyed. While these burns are severe, the pain is often less than first- or second-degree burns because of damage to the nerves. Third-degree burns often benefit from surgical intervention, undergoing excision and grafting, and/or lead to significant scarring. Multiple studies have evaluated the ability of medical practitioners to correctly identify burn depth and the findings are that visual detection is difficult and uncertain [Citation1–5]; this outcome complicates medical treatment.
Within the scientific community, a different classification of burns is often preferred relative to the degree approach. In this alternative system, a superficial burn refers to a burn that is confined to the epidermal layer and is equivalent to a first-degree burn. A superficial-partial-thickness burn is one that extends through the dermal papillae and into the outermost portion of the dermal layer. A deep-partial-thickness burn passes through the midplane of the dermal layer and into the reticular layer. Both superficial-partial-thickness and deep-partial-thickness burns are contained within the second-degree description. Finally, in the alternative classification system, a full-thickness burn is one that passes completely through the dermal layer and into the hypodermis. Such burns are equivalent to the third-degree burn classification.
The motivation for the alternate classification method is that it subdivides dermal burns into two categories. One category (superficial-partial-thickness burns) is less severe and less likely to benefit from surgical intervention. The other category (deep-partial-thickness burns) is more likely to require surgical attention and lead to scarring. The distinction between these two burn extents is not reflected by the coarser second-degree burn classification. Furthermore, the more refined classification provides a target for designers of products if they wish to avoid very serious burns.
Despite the social importance of burn injury prediction and classification, very little work has been reported in the scientific literature to provide guidance to lay persons on ways to avoid burn injuries. The present study is motivated by this goal. In particular, this study will quantify the potential for beverage spills to cause scald injuries and propose guidelines for the beverage industry to reduce the potential for injury.
There already exists some literature on the subject [Citation6–10]. These studies generally deal with preferred hot-beverage drinking temperatures and the corresponding potential for burn injuries. A general conclusion is that beverages are often served at temperatures which are greatly in excess of those preferred by consumers or preferred from a safety standpoint. While these studies provide some insight to this issue, they do not lead to guidelines which the beverage industry can use to deal with complex issues when hot beverages are served. For instance, the rate of cooling of the beverage after it has been served may be an important factor in injury risk. Important factors affecting the cooling rate are: the volume of hot liquid, the type of containment vessel, the presence or absence of a cover on the vessel, the presence or absence of an insulating sleeve and the influence of the room temperature. In addition, the presence of clothing on the skin has an insulating effect which may be important. This impact has not yet been fully characterised in the literature.
There are studies in the literature where the burn depths caused by heated liquid are reported. Some of that work is experimental [Citation11–14] whereas others are numerical predictions [Citation15–19]. The numerical predictions are based on well-established calculation procedures that have been validated many times in the literature and are a result of a multi-year evolution in the methodology of numerical modelling and simulation [Citation20–39]. Additionally, there is a wealth of research which deals with simulation and experimentation on heating of carcinogenic tissues [Citation40–49], on thermal tolerance and dosimetry of tissues (including skin) [Citation50–54], on the cellular responses to heating [Citation55,Citation56], heating for internal but non-cancerous applications [Citation57,Citation58], patient-specific thermal protocols [Citation59] and reviews [Citation60].
The studies focused on skin burns [Citation20–39] are limited by simplifying assumptions. Typically, the exposure of skin to heated liquids was achieved by applying a constant-in-time fluid temperature for a carefully controlled exposure duration. Such careful control is unlikely to occur in an actual spill incident in which a volume of liquid would initially spill and subsequently, cooling to a room environment would occur quickly. A similar limitation exists for the skin simulations wherein idealised boundary conditions were applied (such as a specified exposure temperature or a convection condition) for some set spill duration, after which cooling is allowed.
Reality is different from these idealisations. Prior to a spill incident, there is a cooling period which occurs from the moment of beverage service until the spill occurs. In addition, there is a timewise variation of the spilled liquid temperature on the skin. To the best knowledge of the authors, there are no studies which quantify both the pre-spill cooling and the timewise temperature variation on the skin surface. The present study aims to fill this knowledge gap and to provide simple-to-use guidelines which allow beverage makers, servers and consumers to very quickly identify the potential that a scald injury would be either a superficial-partial-thickness burn or a deep-partial-thickness burn.
The present study will incorporate many of the factors which may influence risks of these burns. Naturally, it is not possible to study every potential influencing factor; however, here the important parameters are identified and reasonable decisions are made in order to provide a simple-to-use injury-prediction tool. Finally, comparison of the present results with prior idealisations will be made.
The experiments
There were two sets of experiments performed in this study. First, a series of tests were performed to quantify the rate of cooling of a heated beverage following service. Second, spill experiments were performed on tissue surrogate material and on living tissue and surface temperatures were measured. Both sets of experiments were performed using a HP temperature sensing data recorder and thin-gauge type E thermocouples. Replicate experiments were performed and for the cooling data, a statistical analysis was performed. Replicate experiments were also performed for the skin surface temperature measurements.
Beverage cooling experiments
In the developed world, hot beverages such as coffee, tea or other liquids are commonly served in disposable containers (cups). There is some variation among cups, but the important parameters are the volume of liquid, the material which constitutes the cup, the presence or absence of a corrugated paper insulating sleeve and the presence or absence of a cap. In the United States, the liquid ounce (oz) is the standard volume measurement; however, to reflect different practices, metric units will also be used in this study. A series of experiments were performed to assess the cooling rate of each of the scenarios listed in . In all cases, water was the fluid. It may be noticed in that not all possible permutations have been included. For instance, not every case has been studied involving the presence of a sleeve. In addition, foamed Styrofoam (polystyrene) materials were only used for the 237-ml (8-oz) case. The justification for this exclusion is partially because in the beverage industry, sleeves are most commonly used with larger volume beverages and polystyrene is more common with smaller volumes. The other justification to be shown is that neither of these choices materially impacts the results.
Table 1. Various parameters investigated in the cooling experiment.
In all cases, the heating procedure was identical. The water was heated on a stovetop in a metallic vessel which could hold approximately 60 oz (∼1800 ml). The water was stirred periodically during the heating process so that the fluid was well mixed. Temperature measurements were made in the common vessel prior to the dispensing of the liquid into the cups. The dispensing occurred immediately after the final temperature measurement was made so that the initial temperature was known.
In the experiments, at least three replicate runs were made with different starting temperatures and ambient temperatures. These variations will affect both the natural convection and radiative heat losses. Five representative cases (1, 2, 6, 8 and 10) were run with three replicates each for purposes of determining experimental error. Timewise temperature variations were put into dimensionless form as follows:
(1)
Results from the experiments are shown in where the dimensionless temperatures are plotted as a function of time. The figures are ordered by the beverage volume. Parts (a), (b) and (c) of the figure correspond to different beverage volumes. For each part of the figure, the data naturally segregate by capped vs. uncapped cases. The impact of the cup material and the presence or absence of a sleeve was negligible compared to the effect of the cap. To put the temperature spread into context, in the 237-ml cases, the capped and uncapped groups formed two sets of results which were within a small range amongst their group. Both groups were within 1.2 °C (2.2 °F) of their kin after the cooling experiments. The other volumes had similar temperatures despite the presence or absence of sleeves or different materials.
Figure 1. Experimentally obtained timewise cooling of (a) 237-ml (8-oz) beverages, (b) 355-ml (12-oz) beverages and (c) 473-ml (16-oz) beverages.
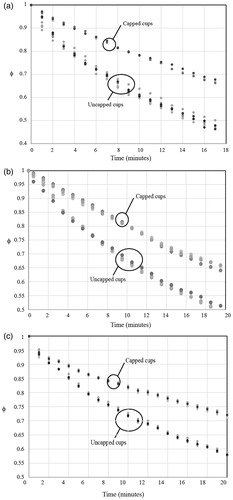
Since liquid tends to stratify due to buoyant effects, it was decided to make measurements in a consistent location, in the centre of the cups, approximately 1 inch (25 mm) below the surface. The results corresponding to the following figures were all obtained at this location.
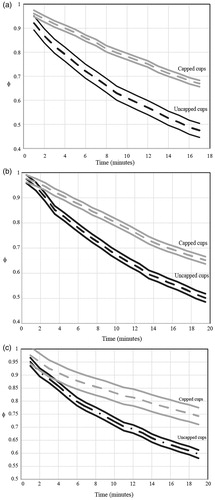
Experimental variability was calculated for each combination of volume and cup covering. These combinations were plotted in , which again is arranged in three parts which correspond to different beverage volumes. The figures show a centreline average of all data points in the combination and bracketed by two standard deviations above and below the average. In the figures for each volume, the data is again naturally broken into capped and uncapped cases. The maximum variance, 0.000260, occurred in the experimental condition of a volume of 473 ml with a cap. Total pooled experimental variance of φ for all replicates was 0.000136 corresponding to a standard deviation of 1.01 °C.
Figure 2. Timewise cooling of (a) 237-ml (8-oz), (b) 355-ml (12-oz) and (c) 473-ml (16-oz) beverages with ±2 standard deviation envelopes.
From the results presented in and , it was possible to obtain an average timewise temperature variation in the cups which reflected the important parameters (presence of caps and liquid volume). The results from the averaging process are shown in , and the fitted equations are listed following the figure. The fitted equations are for the average cooling rates for the labelled equations. The variability of the expected temperatures is provided by the two-sigma envelopes which were already presented and discussed in .
Figure 3. Timewise temperature variations accounting for significant parameters.
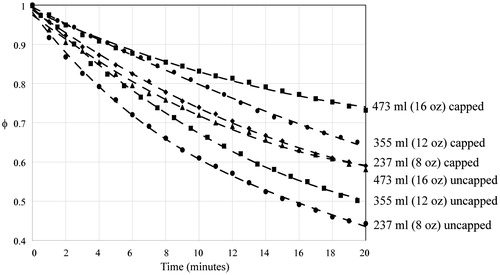
The following correlations correspond to cooling times greater than zero.
For 237 ml (8 oz) uncapped
(2)
For 237 ml (8 oz) capped
(3)
For 355 ml (12 oz) uncapped
(4)
For 355 ml (12 oz) capped
(5)
For 473 ml (16 oz) uncapped
(6)
For 473 ml (16 oz) capped
(7)
The variable time is expressed in minutes. EquationEquations (2)–(7) can be used to predict the temperature at any time after service of a hot beverage for volumes in the 8–16 oz (237–473 ml) range with and without a cap.
Skin–liquid temperature measurements
The next step was to purposely spill heated water onto a tissue surrogate and onto living tissue and measure the resulting surface temperatures. The selection of surrogate is based on an interfacial thermal analysis. The temperature of the interface of two materials is dictated by the square roots of the products of density, specific heat and thermal conductivity [Citation61]. The surrogate material (glass) possessed this product which was within 20% of that of a human dermis [Citation61]. The glass substrate was a horizontally oriented flat surface approximately 4 inches by 6 inches suspended over a receptacle for catching runoff liquid. A validating experiment on living human skin tissue (forearm) gave results which were virtually indistinguishable from the tissue surrogate, adding confidence to the methodology. The experiments were carried out using the forearm of the lead author (J. P. Abraham), no institutional review board (IRB) approval was required.
During the experiments, small gauge type E thermocouples were affixed to the surrogate surface or living tissue and the surface was covered with a single layer of cotton clothing (typical of a fitted undershirt). Following the initiation of the spill, a data recording system was set to automatically record and store temperature data for approximately 30 s. Temperatures were recorded at the impact site of the spill and continued after the cessation of water flow. The approximate spill duration varied among the experiments but was typically 1–2 s long. All experiments were completed in replicate so that reproducibility could be assessed. The main difference between the experiments on living tissue with those on tissue surrogate was the spill temperature. To avoid injury, spills on living tissue involved water whose temperature was 50 °C, while spills on the tissue surrogate were much hotter.
It must be mentioned that in an actual situation, the spill pattern and duration may vary from that employed here. While it is not possible to explore all the potential variations of spills, the goal here is more modest. It is to provide guidance, within a reasonable degree of engineering certainty, for burn depths which would occur during a typical beverage spill. Judgement is made regarding some features of the experiment and calculation. For instance, it was decided that a post-spill clothing duration of 30 s would represent the upper bound. In an actual situation, it is likely that saturated clothing would be removed and/or cooling treatment would be applied by this time.
To facilitate the discussion of the results, another dimensionless temperature was defined:
(8)
In this definition, Tskin is the temperature of the surrogate material or living tissue prior to the spill. The term Tspill is the temperature of the liquid within the cup as the spill commences. Among the experiments to be presented here, multiple initial temperatures and spill temperatures were used. It was found that when the results are presented in dimensionless format, all of the experimental results were condensed to dimensionless curves.
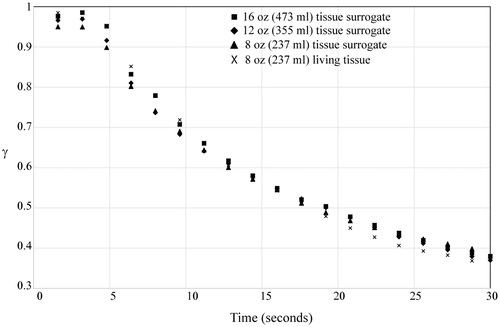
shows the set of results for the three different beverage spill volumes. It is seen that the temperatures are not strongly dependent on the spill volume. This may be surprising, because it was expected that larger volume spills would lead to higher surface temperatures. On the other hand, observations were that the initial spill quickly saturated the clothing and excess liquid flowed off of the impact site. It was observed that the larger spill volumes saturated a larger area of clothing and tissue, and so it is expected that they would lead to a larger area of burn. However, the temperatures directly underneath the spill were not affected by the volume. It should be noted that each set of data in corresponds to three replicate runs, so the total number of experiments which comprise the image is 12.
Figure 4. Surface temperatures of a skin surrogate and on living tissue following a spill incident.
The numerical model
The next step in the analysis was to couple the experimental results with a numerical simulation. The calculation procedure is identical to that of [Citation15] and readers are directed there for details of the approach, however, a brief description will be given here. The model includes four layers of tissue, as shown in . The thicknesses of the layers were taken from [Citation17] and are listed in and thermophysical properties are in .
Figure 5. Multiple tissue layers and applied boundary condition.
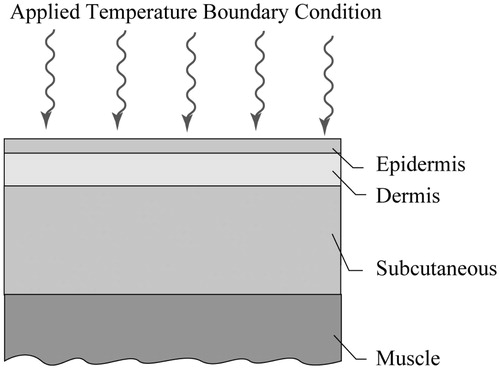
Table 2(a). Thicknesses of tissue layers used in model (mm).
Table 2(b). Summary of thermophysical properties used in the calculations.
The calculation procedure is based on the finite element method where conservation of energy is applied to a multitude of elements which constitute the tissue regions. The approach has been used in multiple research studies, very recently in [Citation15] where it compared excellently with clinical results in correctly predicting the depth of burns for a variety of scald incidents. The governing differential equation includes the timewise temperature variation in the tissue, the conduction of heat through the tissue and the impact of blood perfusion through the Pennes model [Citation62].
(9)
Symbols ρ, c and k represent the density, specific heat and thermal conductivity, respectively. The symbols ω and T represent blood perfusion and temperature. The subscripts t and b correspond to tissue and blood properties. The values of the thermophysical properties for the layers which are listed in are from [Citation17].
The initial temperature of the tissue was set at 37 °C. At the initiation of the simulation, the dimensionless surface temperatures for the respective spill volumes were applied (from ). At the outermost boundaries (on the right- and left-hand sides of ), insulated conditions are enforced and at the deep-muscle boundary, an isothermal condition of 37 °C was used.
Following a 30-s spill duration, the temperature condition was replaced by a convection to a room whose temperature was 20 °C and with a convective coefficient of 10 W/m2 °C. This convection condition continued for another 30 s. At this time, the accumulation of injury at the burn front was very small, and further extension of the calculation did not appreciably affect the results.
As discussed in [Citation15], the calculation procedure is independent of both element size and time-step size; both mesh and time-step independence verifications were performed as described in [Citation15]. The outcome of the numerical simulations are local temperatures at all time instances during the spill incident and subsequent cooling. These temperatures are imported into an injury calculation, wherein the injury is defined as a rate equation according to the work of Henriques and Moritz [Citation11–14]. The advantage of using information from [Citation11–14] is that it was obtained with hot-liquid scald experiments on both human and porcine tissue – a scalding method similar to the present investigation. The injury integral is calculated from
(10)
Here, R is the ideal gas constant and λ is a variable of integration. The symbols ξ and ΔE are tissue injury parameters which have been determined by experiments to be ξ = 3.1e98 and ΔE = 6.28e8 (J/kmol). Tissue was considered fully injured for values of Ω > 1.
To summarise the procedure, it consists of four steps. First, a determination of the beverage temperature at the time of the spill (obtained from Equationequations (2)(2) to Equation(7)
(7) ). Second, determination of the dimensionless tissue surface temperature from as a boundary condition for a numerical model. Third, use of the numerical model to determine temperatures within the tissue and finally calculation of the extent of burn injury using Equationequation (10)
(10) .
Resulting burn depths and discussion
The results are first set forward graphically in . The figure shows three sets of data; however, two overlap and are symbolised by a single marker. The graph shows the final burn depths as a function of the initial temperature of the spill (the temperature of the beverage at the time of the spill). Also shown in the figure is a dashed line which approximately indicates the depth of a deep-partial-thickness burn (a burn at the mid-dermal location). It is seen that the temperature which would cause these burns is approximately 82 °C (179–180 °F). This result is very similar to conclusions from [Citation15,Citation16] despite that study using an idealised computational model. These results also agree with the clinical evidence provided in [Citation15]. The results are also listed in °F with a secondary horizontal axis atop the graph.
Figure 6. Burn depths for various spill temperatures.
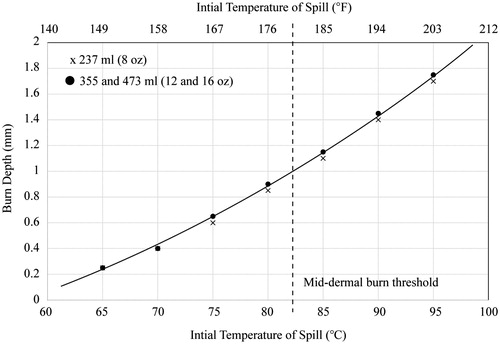
It must be noted that the definition of mid-dermal burn in is based on a dermal-layer thickness of 2 mm. The actual thickness of the dermal layer varies by body location, by age and by ethnicity. There are many situations where dermal layers are less thick than 2 mm so that lower temperature spills would result in mid-dermal burns. In this regard, the information in can be considered conservative with respect to mid-dermal burns.
It is also noteworthy that burn injuries can occur for injury depths which do not reach the mid-dermal layer. So, the results in this paper and in should be not interpreted as an absolute threshold for injury.
To provide a simple means to estimate burn temperatures, have been prepared. Each table is presented in two parts. The (a) part lists the temperature of the spilled liquid based on the service temperature and the cooling time (the duration of cooling time from service to spill). The (b) part lists the corresponding burn depths for each entry of the (a) table. and correspond to a 237-ml (8-oz) beverage (with and without caps); and are for the 355-ml (12-oz) size (with and without caps); and and correspond to the largest beverage size of 473 ml (16 oz), again with and without caps.
Table 3(a). Impact temperatures in °C for an 8-oz (237-ml) beverage spilled without a cap.
Table 3(b). Burn depths (mm) for an 8-oz (237-ml) beverage spilled without a cap.
Table 4(a). Impact temperatures in °C for an 8-oz (237-ml) beverage spilled with a cap.
Table 4(b). Burn depths (mm) for an 8-oz (237-ml) beverage spilled with a cap.
Table 5(a). Impact temperatures in °C for a 12-oz (355-ml) beverage spilled without a cap.
Table 5(b). Burn depths (mm) for a 12-oz (355-ml) beverage spilled without a cap.
Table 6(a). Impact temperatures in °C for a 12-oz (355-ml) beverage spilled with a cap.
Table 6(b). Burn depths (mm) for a 12-oz (355-ml) beverage spilled with a cap.
Table 7(a). Impact temperatures in °C for a 16-oz (473-ml) beverage spilled without a cap.
Table 7(b). Burn depths (mm) for a 16-oz (473-ml) beverage spilled without a cap.
Table 8(a). Impact temperatures in °C for a 16-oz (473-ml) beverage spilled with a cap.
Table 8(b). Burn depths (mm) for a 16-oz (473-ml) beverage spilled with a cap.
The utility of the tables is that they allow beverage service to be planned based on the risk of severe burns. For adults whose dermal layers are approximately 2 mm thick, a mid-dermal burn is one that extends approximately 1 mm into the tissue. It must be recognised that the dermal thickness varies with location on the body and with age. In particular, children have dermal thicknesses which are thinner than adults (approximately 70% or less). Consequently, for children, a more conservative definition of burn depth (0.7 mm or less) should be used. For adults and for all of the beverage volumes, spills that occur over approximately 82 °C are likely to lead to mid-dermal burns. On the other hand, for children mid-dermal burns are predicted to occur at lower temperatures.
For cases where the spill temperature is lower, burn depths are not provided, because burns at these temperatures are extremely unlikely to reach deep into the dermal layer. While these temperatures may result in painful superficial burns or superficial-partial-thickness burns, they are unlikely to be of an extent that requires significant medical attention.
Inspection of the tables indicates that, as expected, the presence of a cap results in both higher impact temperatures and greater burn depths. This outcome is clearly of practical importance with regard to burn depth. With increasing cooling time before the spill, there are major differences between the burn depths in the absence of the cap and those in the presence of the cap. If all else were to remain constant, safety issues would lead to the recommendation that the use of a cap be avoided. On the other hand, if the cap were sufficiently held onto the cup and prohibited liquid from exiting the cup after a spill, its use would be justified.
Summary table and beverage safety guidelines
In order to provide a compact resource for predicting and avoiding scald injuries. and have been prepared. These tables combine all of the prior information and maintain the critical features extracted from the data. The first table shows the burn risk for an adult undergoing a spill incident. The table allows the beverage temperature and the cooling time to be used to predict a burn category. pertains to uncapped cups of all sizes and constructions. The letters “SP” signify a risk of superficial-partial-thickness burns or greater while the letters “DP” correspond to deep-partial-thickness burns or worse. shows the same information for capped cups. Some care should be exercised when using these tables. For instance, for elderly or children, whose skin is thinner or whose ability to react quickly to a burn is compromised, the burns may be deeper than those listed in the table. Furthermore, when scalds occur to body locations with thinner skin, the burns again may be more severe than indicated by the table. Nevertheless, these tables can provide a quick and easy to use resource to estimate burn depths or to plan burn-avoidance strategies. These results should be considered against common misconceptions that equate dermal threshold burns with third-degree injuries as discussed in [Citation63]. A simplified version of this table was presented in [Citation64] which used a lower resolution calculation approach.
Table 9. Burn risk for various service temperatures and cooling durations for cups which are not capped. “DP” signifies a deep-partial-thickness burn or worse and “SP” indicates superficial-partial-thickness burn or worse. This table corresponds to adults with 2 mm dermal layer thickness.
Table 10. Burn risk for various service temperatures and cooling durations for cups which are capped. “DP” signifies a deep-partial-thickness burn or worse and “SP” indicates superficial-partial-thickness burn or worse. This table corresponds to adults with 2 mm dermal layer thickness.
Concluding remarks
A comprehensive investigation has been performed to determine the potential for hot-liquid beverage spills to cause severe burns on human skin. This study includes the cooling of beverages between the time of service and spill. The cooling experiments investigated many independent variables, such as the volume of the beverage, the initial temperature of the beverage at service, the duration of cooling, the material comprising the cup, the presence or absence of a cap and the presence or absence of a protective sleeve. It was found that the critical factors in the aforementioned are the presence or absence of a cap, the volume of the beverage and the cooling duration. The results found here agree extremely well with previously recorded studies on cooling rates of hot beverages [Citation65–67] which adds confidence to the experimental approach. In fact, the results here agree to within the capability to read graphical results from [Citation65–67] or to within 1 °C after 15 min of cooling. The dimensionless presentation of results led to a condensing of cooling curves to a compact set which can be used to predict with reasonable engineering certainty the temperature of a beverage after service.
Subsequent experiments carried out with spills on both tissue surrogates and on living human skin provided a timewise temperature variation which existed at the impact surface. The experiments were completed with a single layer of cotton clothing in all cases. The dimensionless temperature variations were nearly universal regardless of the volume of spilled liquid, the initial temperature of the liquid, the initial temperature of the surrogate or the surrogate material.
Finally, the timewise surface temperatures were used as input to a numerical model and a simulated spill occurrence followed by cooling to an air environment at 20 °C was obtained. A series of such calculations along with the dimensionless form of the input allowed for the creation of an archive of tables which predict burn depths for any reasonable combination of initial beverage temperature, beverage volume and cooling time. This archive is expected to be a valuable resource to consumers, the beverage industry and even treating clinicians whose goal is to avoid serious burn injury or quantify burn severity when it occurs.
Disclosure statement
Professor Abraham has served as an expert witness in scald injury litigation.
References
- Merz KM, Pfau, M, Blumenstock G, . (2010). Cutaneous microcirculatory assessment of the burn wound is associated with the depth of injury and predicts healing time. Burns 36:477–82.
- Singer AJ, Berutti L, Thode HC, et al. (2000). Standardized burn model using multiparametric histologic analysis of burn depth. Acad Emerg Med 7:1–6.
- Durant CAT, Simpson AR, Williams G. (2008). Thermal injury – the first 24 h. Curr Anesth Crit Care 19:256–63.
- Heimbach DM, Afromowitz MA, Engrav LH, et al. (1984). Burn depth estimation – man or machine. J Trauma 24:373–8.
- Palla RL. (1981). A heat transfer analysis of scald injury. National Technology Information Service, US Department of Commerce.
- Brown F, Diller KR. (2008). Calculating the optimum temperature for serving hot beverages. Burns 34:648–54.
- Pipatsattayanutong S, Lee HS, Lau S. et al. (2001). Hedonic R-index measurement of temperature preferences for drinking black coffee. J Sensor Studies 16:517–36.
- Borchgrevink CP, Susskind AM, Tarras JT. (1999). Consumer preferred hot beverage temperatures. Food Qual Preference 10:117–21.
- Lee HS, O’Mahony M. (2002). At what temperature do consumers like to drink coffee?: mixing methods. J Food Sci 67:2774–7.
- Jamnadas-Khoda B, See MS, Cubison CTC. et al. (2010). How would you like your tea, vicar? Burns 36:356–59.
- Moritz AR, Henriques FC. (1947). Studies of thermal injury I. The conduction of heat to and through the skin and the temperature attained therein. Am J Pathol 23:531–49.
- Moritz AR, Henriques FC. (1947). Studies of thermal injury II. The relative importance of time and surface temperature in the causation of cutaneous burns. Am J Pathol 23:695–720.
- Moritz AR. (1947). Studies of thermal injury III. The pathology and pathogenesis of cutaneous burns, an experimental study. Am J Pathol 23:915–41.
- Henriques FC. (1947). Study of thermal injury V. The predictability and significance of thermal induced rate processes leading to irreversible epidermal injury. Arch Pathol 43:489–502.
- Abraham JP, Plourde BD, Vallez LJ, et al. (2015). Estimating the time and temperature relationship for causation of deep-partial thickness skin burns. Burns 41:1741–7.
- Abraham JP, Plourde BD, Vallez LJ, et al. Skin burn. In: Shrivastava D, ed. Theory and application of heat transfer in cells and organs. Hoboken (NJ): Wiley (in press).
- Johnson NN, Abraham JP, Helgeson ZI, et al. (2011). An archive of skin-layer thicknesses and properties and calculations of scald burns with comparisons to experimental observations. J Thermal Sci Eng Appl 3:paper no. 011003.
- Abraham JP, Hennessey MP, Minkowycz WJ. (2011). A simple algebraic model to predict burn depth and injury. Int Comm Heat Mass Trans 38:1169–71.
- Viglianti BL, Dewhirst MW, Gorman JM, et al. (2014). Rationalization of thermal injury quantification methods: application to skin burns. Burns 40:896–902.
- Diller KR. (1998). Modeling thermal skin burns on a personal computer. J Burn Care Rehab 19:420–9.
- Ng EYK, Tan HM, Ooi EH. (2009). Boundary element method with bioheat equation for skin burn injury. Burns 35:987–97.
- Diller KR, Hayes LJ, Blake GK. (1991). Analysis of alternate models for simulating thermal burns. J Burn Care Rehab 12:177–89.
- Ng EYK, Chua LT. (2002). Prediction of skin burn injury. Part 1: numerical modeling. J Eng Med 216:157–70.
- Ng EYK, Chua LT. (2002). Prediction of skin burn injury. Part 2: parametric and sensitivity analysis. J Eng Med 216:171–83.
- Ng EYK, Chua LT. (2002). Comparison of one- and two-dimensional programmes for predicting the state of skin burns. Burns 28:27–34.
- Dai W, Wang H, Jordan PM, et al. (2008). A mathematical model for skin burn injury induced by radiation heating. Int J Heat Mass Trans 51:5497–510.
- Lovik RD, Abraham JP, Sparrow EM. (2009). Potential tissue damage from transcutaneous recharge of neuromodulation implants. Int J Heat Mass Trans 52:3518–24.
- Smith DK, Lovik RD, Sparrow EM, et al. (2010). Human tissue temperatures achieved during recharging of new-generation neuromodulation devices. Int J Heat Mass Trans 53:3292–9.
- Ross DC, Diller KR. (1976). An experimental investigation of burn injury in living tissue. J Heat Trans 98:292–6.
- Diller KR. (1992). Modeling of bioheat transfer processes at high and low temperature. In: Advances in heat transfer. Vol. 22. New York: Academic Press.
- Abraham JP, Sparrow EM. (2007). A thermal ablation model including liquid-to-vapor phase change, necrosis-dependent perfusion, and moisture-dependent properties. Int J Heat Mass Trans 50:2537–44.
- Weaver JA, Stoll AM. (2009). A mathematical model of skin exposed to thermal radiation. Aerospace Med 40:24–30.
- Chato J. (1980). Heat transfer to blood vessels. J Biomech Eng 102:110–8.
- Charny C. (1992). Mathematical models of bioheat transfer. In: Cho Y, Harnett J, Irvine T, eds. Advances in heat transfer bioengineering heat transfer. Vol. 22. Boston: Academic Press.
- Gasperin M, Juricic D. (2009). The uncertainty in burn prediction as a result of variable skin parameters: an experimental evaluation of burn-protective outfits. Burns 35:970–82.
- Stoll AM, Chianta MA. (1971). Heat transfer through fabrics as related to thermal injury. Trans NY Acad Sci 33:649–70.
- Stoll AM, Greene LC. (1959). Relationship between pain and tissue damage due to thermal radiation. J Appl Physiol 14:373–82.
- Torvi DA, Threlfall TG. (2007). Heat transfer model of flame resistant fabrics during cooling after exposure to fire. Fire Technol 42:27–48.
- Vallez LJ, Plourde BD, Abraham JP. (2016). A new computational thermal model for the whole human body: applications to patient warming blankets. Num Heat Transfer 69:227–41.
- Hall SK, Ooi EH, Payne SJ. (2015). Cell death, perfusion and electrical parameters are critical in models of hepatic radiofrequency ablation. Int J Hyperthermia 31:538–50.
- Dewhirst MW, Sim DA. (1984). The utility of thermal dose as a predictor of tumor and normal tissue responses to combined radiation and hyperthermia. Cancer Res 44:4772s–80s.
- Facciorusso A, Di Maso M, Muscatiello N. (2016). Microwave ablation versus radiofrequency ablation for the treatment of hepatocellular carcinoma: a systematic review and meta-analysis. Int J Hyperthermia 32:339–44.
- Huang Q, Yang H, Lin QN, et al. (2016). Microwave ablation versus radiofrequency ablation for the treatment of hepatocellular carcinoma: a systematic review and meta-analysis: two issues should be noted. Int J Hyperthermia 32:45.
- Zhai H, Liang P, Yu XL, et al. (2015). Microwave ablation in treating intrahepatic recurrence of hepatocellular carcinoma after liver transplantation: an analysis of 11 cases. Int J Hyperthermia 31:863–68.
- Shetake NG, Kumar A, Gaikwad S, et al. (2015). Magnetic nanoparticle-mediated hyperthermia therapy induces tumour growth inhibition by apoptosis and Hsp90/AKT modulation. Int J Hyperthermia 31:909–19.
- Zhang B, Moser MA, Zhang EM, et al. (2015). Numerical analysis of the relationship between the area of target tissue necrosis and the size of target tissue in liver tumours with pulsed radiofrequency ablation. Int J Hyperthermia 31:715–25.
- Soni S, Tyagi H, Taylor RA, et al. (2015). The influence of tumour blood perfusion on variability on thermal damage during nanoparticle-assisted thermal therapy. Int J Hyperthermia 31:615–25.
- Mouratidis PXE, Rivens I, Ter Haar G. (2015). A study of thermal dose-induced autophagy, apoptosis, and necroptosis in colon cancer cells. Int J Hyperthermia 31:476–88.
- Maloney E, Hwang JH. (2015). Emerging HIFU applications in cancer therapy. Int J Hyperthermia 31:302–09.
- Dewhirst MW, Viglianti BL, Lora-Michiels M, et al. (2003). Basic principles of thermal dosimetry and thermal thresholds for tissue damage from hyperthermia. Int J Hyperthermia 19:267–94.
- Yarmolenko PS, Moon EJ, Landon C, et al. (2011). Thresholds for thermal damage to normal tissues: an update. Int J Hyperthermia 27:320–43.
- van Rhoon GC, Samaras T, Yarmolenko PS, et al. (2013). CEM43 °C thermal dose thresholds: a potential guide for magnetic resonance radiofrequency exposure levels? Eur Radiol 23:2215–2227.
- Dewhirst MW, Winget JM, Keshet-Edelstein L, et al. (1987). Clinical application of thermal isoeffect dose. Int J Hyperthermia 3:307–18.
- Kumaran B, Watson T. (2015). Thermal build-up, decay, and retention responses to local therapeutic application of 448 kHz capacitive resistive monopolar radiofrequency: a prospective randomized crossover study in healthy adults. Int J Hyperthermia 31:883–95.
- Ikuta K, Urakawa H, Kozawa E, et al. (2015). In vivo heat-stimulus-triggered osteogenesis. Int J Hyperthermia 31:58–66.
- Dewey WC. (1994). Arrhenius relationships from the molecule and cell to the clinic. Int J Hyperthermia 10:457–83.
- Quinn SD, Gedroyc WM. (2015). Thermal ablative treatment of uterine fibroids. Int J Hyperthermia 31:272–9.
- Ryan TP, Turner PF, Hamilton B. (2010). Interstitial microwave transition from hyperthermia to ablation: historical perspectives and current trends in thermal therapy. Int J Hyperthermia 26:415–433.
- Hong B, Du X, Zhao Y, et al. (2015). Characteristics of laproscopic microwave ablation with renal tissue: experimental in vivo study using a porcine model. Int J Hyperthermia 31:930–6.
- Verhaart RF, Verduijn GM, Fortunati V, et al. (2015). Accurate 3D temperature dosimetry during hyperthermia therapy by combining invasive measurements and patient-specific simulations. Int J Hyperthermia 31:686–92.
- Ghoshdastidar PS. (2004). Heat transfer. Oxford: Oxford University Press.
- Pennes HH. (1948). Analysis of tissue and arterial blood temperatures in resting human forearm. J Appl Physiol 1:93–133.
- Abraham JP, Plourde BD, Vallez LJ, et al. (2016). Correcting a prevalent misunderstanding of burns. Burns 42:715–16.
- Bourdon RT, Nelson-Cheeseman BB, Abraham JP. (2016). Prediction, identification, and initial treatment guidelines for scald injuries. Austin J Emerg Crit Care Med 3:1043.
- Ramanathan C, Ekpenyong L, Stevenson JH. (1994). Scald burns in children caused by hot drinks – the importance of the type of cup. Burns 20:111–14.
- Mercer NSG. (1988). With or without? A cooling study. Burns 14:397–398.
- Warner RW, Wilson Y, Chester DL. (2012). Cooling properties of everyday liquids. Burns 38:1186–91.