
Abstract
Microwave coagulation therapy (MCT) is an effective treatment for hepatocellular carcinoma. During MCT, the target region is heated to induce coagulation in the tissue, including cancer cells. Several types of antennas for MCT have been developed, the heating performances of which were evaluated via specific absorption rate (SAR) and temperature distribution. However, for coagulation therapy, detailed evaluation of the coagulated region is important. Therefore, a newly developed algorithm is presented for calculating the coagulated region within biological tissue. To confirm the validity of the proposed method, the calculated result is compared with the experimental findings.
Introduction
Microwave coagulation therapy (MCT) has been used mainly for the treatment of hepatocellular carcinoma [Citation1,Citation2]. During treatment, a thin microwave antenna is inserted into the tumour, providing microwave energy that heats the tumour, producing a coagulated region that includes cancer cells. The input power of the antenna is of the order of several tens of watts, and heating duration is a few minutes or longer. The mechanisms of the treatment depend on therapeutic temperature. At temperatures of around 42–45 °C, biological cell death occurs in cancerous tissues [Citation3], whereas at around 50 °C coagulation necrosis will occur [Citation4]. Despite the large differences between treatment mechanisms, their treatment schemes are similar, especially in interstitial heating. In this paper, MCT corresponding to the coagulative necrosis is described.
To generate a localised coagulated region of sufficient volume, several types of antennas have been investigated [Citation5,Citation6]. The heating ability has also been evaluated experimentally and by numerical calculations [Citation7]. For example, in Chiang et al. [Citation8], specific absorption rate (SAR) and temperature distributions of thin interstitial antennas were evaluated and in vivo analyses were performed. The heating abilities of practical antennas, such as water-cooled designs, were evaluated by Lu et al. [Citation9]. In Sommer et al. [Citation10], shapes of the coagulated regions are categorised to typical geometric shape such as a sphere and an ellipsoid to evaluate the coagulation volume. In radio frequency tumour ablation, temperature analysis was conducted based on the results of in vitro experiments [Citation11], and the relationship between the coagulated region (ex vivo) and the calculated electric field strength [Citation12] was investigated.
In this way, the heating ability of antennas (for the microwave) and electrodes (for the radio frequency current) were investigated based on SAR and temperature distribution. SAR and temperature distribution are important indices of the heating performance of antennas. However, examination of the coagulated region around the antenna is important for evaluation of coagulation therapy. The coagulated region around the antenna can be measured with the use of biological tissue such as extracted organs. The experimental evaluation is not easy to perform. If the coagulated region can be calculated, antenna performance and treatment planning can be improved.
The Arrhenius integral or the index of CEM43 is employed for evaluating heating dosimetry. For example, thermal lesions are evaluated by the Arrhenius integral during the radio frequency (RF) ablation [Citation13,Citation14]. The Arrhenius integral can precisely express the generation of thermal lesion based on characteristics of the biological tissue. However, some physical parameters of biological tissue, which are difficult to obtain, are required. In brief, CEM43 evaluates equivalent time at 43 °C heating. Therefore, CEM43 is used for evaluating hyperthermia range temperature histories and is not appropriate for coagulation range temperatures [Citation15].
In this paper, the coagulated region within the biological tissue is directly calculated via a relatively simple method. For this calculation, the fundamental characteristics of biological tissue regarding tissue coagulation are investigated. Then, an algorithm that defines the coagulated region is introduced. Finally, the calculated results are validated by comparison with experimental findings.
Materials and methods
Tissue properties
In this study, porcine liver was used, as it displays similar electrical properties to those of human tissue. In the first step, the fundamental coagulation characteristics of biological tissue were investigated experimentally: the temperature and time required for coagulation in the tissue: Coagulation as indicated by a colour change in the tissue from red to white. The measurement procedure is explained in and is as follows: (1) The porcine liver tissue was cut into very small samples (∼0.03 g), to ensure that the sample achieves uniform temperature in the short time compared to delay of the observation. (2) A very small and bare liver tissue sample was placed into water of various temperatures, and the time until a colour change was observed (coagulation) was recorded. (3) The water temperature and duration until colour change were graphed (horizontal and vertical axes, respectively). From the graph, the relationship between temperature and coagulation time in the tissue as a linear function was determined via the least-squares approach.
Figure 1. Fundamental characteristics of biological tissue regarding coagulation. (a) Experimental schema. (b) Relation between temperature and coagulation time of porcine liver tissue.
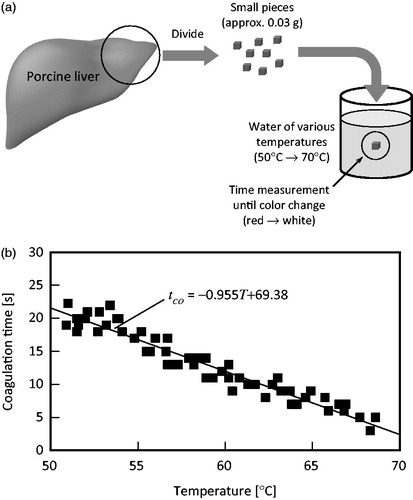
shows the measurement results. From the results, the coagulation time in tissue can be obtained as follows:
(1)
Where, tco is the coagulation time of the tissue (s) and T is temperature (°C).
Above mentioned procedure is employed in this study, only the macroscopic physical changing of the biological tissue is considered and does not consider the detail biochemical denaturation behaviour. Details of the damage process based on the Arrhenius formulation are described by Pearce [Citation16].
Antenna structure
Several types of interstitial antennas are used for MCT. In this study, the coaxial-slot antenna was used for its simple structure. and show the configuration and parameters, respectively, of the antenna [Citation17]. Here, db is the diameter of the antenna, dc is the external diameter of the catheter, tc is the thickness of the catheter, Lts is the length from the tip to the centre of the upper slot, Lls is the length from the tip to the centre of the lower slot and Dt is the insertion depth. A thin, semi-rigid coaxial cable of diameter 1.19 mm was used for the antenna, because a thin antenna is required for interstitial treatments. Two ring slots were cut on the outer conductor, and the tip of the cable was short-circuited. According to our previous study, an antenna of Lts 20 mm and Lls 10 mm can generate a localised heating pattern [Citation18]. These parameters were used in the present study. Additionally, to ensure hygiene, the antenna was inserted in a polytetrafluoroethylene (PTFE) catheter that prevents adherence of the coagulated tissue to the antenna. The operating frequency was set to 2.45 GHz because this frequency is used for conventional MCT and is an industrial, scientific and medical (ISM) frequency.
Figure 2. Structure of coaxial-slot antenna.
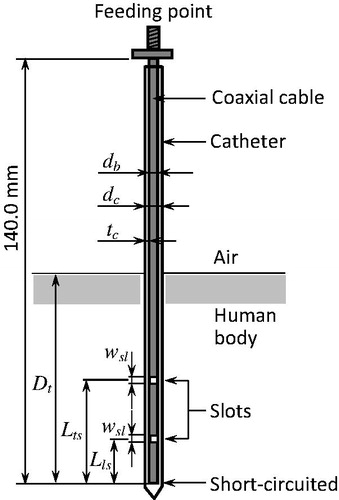
Table 1. Dimensions and relative permittivities of the coaxial-slot antenna.
Calculation algorithm for defining the coagulated region
shows the algorithm used to define the coagulated region. Firstly, the electric field around the antenna was analysed using computational electromagnetic techniques, such as the finite-difference time-domain (FDTD) method [Citation19], to calculate the SAR with the following equation (the definition of the SAR in an electromagnetic field):
(2)
Where, σ is tissue conductivity (S/m), ρ is tissue density (kg/m3) and E is the electric field (rms; V/m). Here, conductivity refers to “effective” electrical conductivity and is related to dielectric heating as well as Joule heating. The SAR provides a measurement of the heat generated in the tissue by the electric field. Secondly, the temperature distribution around the antenna was calculated. The temperature distribution within the biological tissue was obtained by a bioheat transfer equation [Citation20] that includes the SAR value:
(3)
Where, T is temperature (°C), t is time (s), ρ is density (kg/m3), c is specific heat (J/kg/K), κ is thermal conductivity (W/m/K), ρb is the density of blood (kg/m3), cb is the specific heat of blood (J/kg/K), Tb is the temperature of blood (°C) and ω is the volumetric perfusion rate (1/s). The bioheat transfer equation is often employed for calculations involving a living body. It can calculate temperature including the uniform blood perfusion, such as inside the liver. It is not possible to calculate the temperature including non-uniform blood flow, such as thermally-significant blood vessels. The finite-difference time-domain approximation was employed to solve EquationEquation (3)
(3) . The approximation is shown by Saito et al. [Citation18]. lists the physical properties of the liver tissue and the antenna used for the calculation.
Figure 3. Calculation algorithm for estimation of coagulated region.
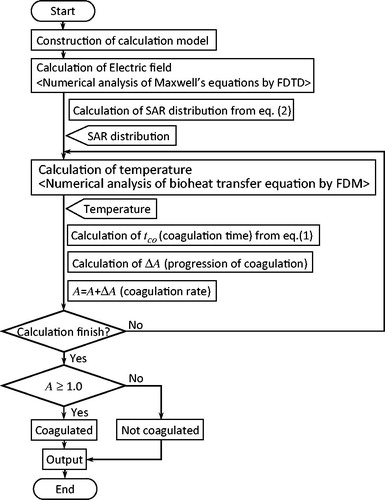
Table 2. Electrical and thermal properties of media.
When calculating the progression of coagulation in the tissue, the temperature calculation assumed that the tissue temperature was >50 °C and that coagulation speed was constant. This will be explained using an example: From , if the temperature of the calculation voxel is 52 °C, then coagulation time tco is 20 s. If the time step Δt for the coagulation evaluation is 1.0 s, then the progression of coagulation at the calculation voxel ΔA is 1/20 and is added to coagulation rate A. In the next time step for the coagulation evaluation, if the temperature of this voxel is increased to 62 °C, then tco is 10 s. At this duration, ΔA is 1/10 and is again added to coagulation rate A. This calculation is repeated every Δt, and if A exceeds 1.0, the voxel is assumed to be the coagulated region. Δt for the coagulation evaluation was set to be the same as the time step for the temperature calculation. In this manner, coagulation rate A may be said to represent the degree of thermal energy accumulation required for tissue coagulation. The method proposed here for evaluating the coagulated region only considers macroscopic physical changes to the biological tissue, and does not consider the detailed biochemical denaturation. Therefore, the detailed characteristics of A cannot be fully established in the proposed method.
Experimental setup for validation
To validate the calculated result, an experiment using an extracted organ is effective. The experimental setup was the same as shown by Saito et al. [Citation18]. The antenna was placed in two liver blocks of temperature at ∼35 °C. After heating, the coagulated region on the surface of one liver block sample was observed and was compared with the calculated region.
Results
In the experiment, the input power of the antenna (incident power minus reflected power) was 33 W. The same level of power was used for the calculation. The duration of exposure to microwave radiation was 60 s in both cases. The volumetric perfusion rate was set at 0.0, because the methodology employed extracted organs; In a real-life situation, the effect of blood flow is represented by the volumetric perfusion rate.
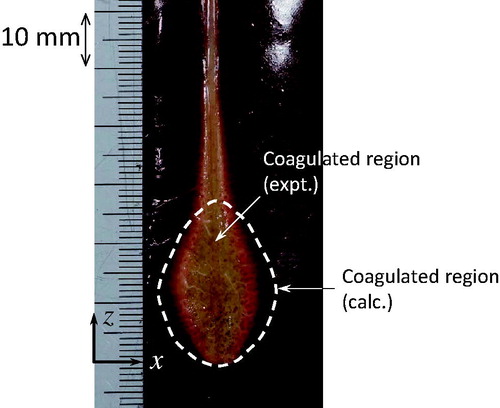
shows the calculated and experimental results, in which the discoloured (white) area corresponds to the coagulated region. In the experiments, a coagulated region is observed between the upper slot and the antenna tip, and around the antenna axis, whereas the calculation only predicts a coagulated region between the upper slot and the antenna tip.
Figure 4. Experimental and calculated results.
Discussion
In the experiment, the maximum length of the coagulated region in the x-direction is 15.0 mm, compared with 19.5 mm in the calculation (see ), representing a difference of ∼23%. This difference is not small; nevertheless, except that described below, the shapes of the coagulated regions are similar. The coagulated region around the antenna axis in the z-direction (z > 25 mm) could not be calculated. This coagulated region is generated due to Joule heating by the antenna’s metallic section. This phenomenon is not included in the numerical calculation of the electromagnetic field. Therefore, the problem is not related to the calculation of the coagulated region. For a highly accurate estimate, the electromagnetic analysis must be improved.
The validation results suggest that the scheme proposed here can be used for estimating coagulation in tissue. However, as the present study only considered coagulation in liver tissue, the relationship between temperature and coagulation time should also be investigated for other organs. In coagulation of tissue, microwave energy heats up the tissue to a high temperature of around 100 °C. For a highly accurate estimate, variations in physical properties, such as the electrical and thermal constants of the tissue, may be considered.
Conclusion
This article describes a method for calculating the “coagulated region,” one of the most important indices for MCT, rather than SAR and temperature distribution. The validity of the calculation method was found by comparison with the calculation and the measurement. In future studies, changes in the physical properties of the tissue through temperature increases will be investigated for more accurate estimation. In addition, the effectiveness of the evaluation method presented here should be clearly established by comparison with practical methods.
Acknowledgements
The authors would like to thank Kenta Suzuki, at the Graduate School of Engineering, Chiba University, for his valuable assistance.
Disclosure statement
The authors report no conflicts of interest. The authors alone are responsible for the content and writing of the article.
References
- Seki T, Wakabayashi M, Nakagawa T, et al. (1994). Ultrasonically guided percutaneous microwave coagulation therapy for small carcinoma. Cancer 74:817–25.
- Murakami R, Yoshimatsu S, Yamashita Y, et al. (1995). Treatment of hepatocellular carcinoma: value of percutaneous microwave coagulation. AJR Am J Roentgenol 164:1159–64.
- Streffer C. (1995). Molecular and cellular mechanisms of hyperthermia. In: Seegenschmiedt MH, Fessenden P, Vernon CC, eds. Thermoradiotherapy and thermochemotherapy. vol. 1. Berlin: Springer-Verlag.
- Chou CK. (2007). Therapeutic heating applications of radio frequency energy. In: Barnes FS, Greenebaum B, eds. Biological and medical aspects of electromagnetic fields. Boca Raton: CRC Press.
- Lin JC, Wang YJ. (1987). Interstitial microwave antennas for thermal therapy. Int J Hyperthermia 3:34–7.
- Saito K, Hayashi Y, Yoshimura H, Ito K. (2000). Heating characteristics of array applicator composed of two coaxial-slot antennas for microwave coagulation therapy. IEEE Trans Microwave Theory Tech 48:1800–6.
- Dewhirst MW, Abraham JP, Viglianti BL. (2015). Evolution of thermal dosimetry for application of hyperthermia treatment to cancer. Adv Heat Transfer 47:397–421.
- Chiang J, Wang P, Brace CL. (2013). Computational modelling of microwave tumour ablations. Int J Hyperthermia 29:308–17.
- Lu Y, Nan Q, Li L, Liu Y. (2009). Numerical study on thermal field of microwave ablation with water-cooled antenna. Int J Hyperthermia 25:108–15.
- Sommer CM, Sommer SA, Sommer WO, et al. (2013). Optimisation of the coagulation zone for thermal ablation procedures: a theoretical approach with considerations for practical use. Int J Hyperthermia 29:620–8.
- Mertyna P, Dewhirst MW, Halpern E, et al. (2008). Radiofrequency ablation: the effect of distance and baseline temperature on thermal dose required for coagulation. Int J Hyperthermia 24:550–9.
- Mulier S, Jiang Y, Jamart J, et al. (2015). Bipolar radiofrequency ablation with 2 × 2 electrodes as a building block for matrix radiofrequency ablation: ex vivo liver experiments and finite element method modelling. Int J Hyperthermia 31:649–65.
- Chang IA, Nguyen UD. (2004). Thermal modelling of lesion growth with radiofrequency ablation devices. Biomed Eng Online 3.
- Schutt DJ, Haemmerich D. (2008). Effects of variation in perfusion rates and of perfusion models in computational models of radio frequency tumor ablation. Med Phys 35:3462–70.
- van Rhoon GC. (2016). Is CEM43 still a relevant thermal dose parameter for hyperthermia treatment monitoring? Int J Hyperthermia 32:50–62.
- Pearce JA. (2015). Improving accuracy in Arrhenius models of cell death: adding a temperature-dependent time delay. J Biomech Eng 137:121006.
- Ito K, Ueno K, Hyodo M, Kasai H. (1989). Interstitial applicator composed of coaxial ring slots for microwave hyperthermia. Proc Int Symp Antennas Propag 2:253–6.
- Saito K, Yoshimura H, Ito K, et al. (2004). Clinical trials of interstitial microwave hyperthermia by use of coaxial-slot antenna with two slots. IEEE Trans Microwave Theory Tech 52:1987–91.
- Yee KS. (1966). Numerical solution of initial boundary value problems involving Maxwell’s equation in isotropic media. IEEE Trans Antennas Propag 14:302–7.
- Pennes HH. (1948). Analysis of tissue and arterial blood temperatures in the resting human forearm. J Appl Phys 1:93–122.