
Abstract
Purpose: In this study, we investigated the differences in hyperthermia treatment (HT) quality between treatments applied with different hyperthermia systems for sub-superficial tumours in the head and neck (H&N) region.
Materials and methods: In 24 patients, with a clinical target volume (CTV) extending up to 6 cm from the surface, we retrospectively analysed the predicted HT quality achievable by two planar applicator arrays or one phased-array hyperthermia system. Hereto, we calculated and compared the specific absorption rate (SAR) and temperature distribution coverage of the CTV and gross tumour volume (GTV) for the Lucite cone applicator (LCA: planar), current sheet applicator (CSA: planar) and the HYPERcollar (phased-array).
Results: The HYPERcollar provides better SAR coverage than planar applicators if the target region is fully enclosed by its applicator frame. For targets extending outside the HYPERcollar frame, sufficient SAR coverage (25% target coverage, i.e. TC25 ≥ 75%) can still be achieved using the LCA when the target is fully under the LCA aperture and not deeper than 50 mm from the patient surface.
Conclusion: Simulations predict that the HYPERcollar (hence also its successor the HYPERcollar3D) is to be preferred over planar applicators such as LCA and current sheet applicator in sub-superficial tumours in the H&N region when used within specifications.
Introduction
Adding hyperthermia (HT) to radio- and/or chemotherapy has been demonstrated to be beneficial for treatment outcome for a number of cancers at various locations in the body [Citation1–4]. It is commonly accepted that hyperthermia treatment quality is positively correlated with improved tumour control [Citation2,Citation5]. Hence, during the last decades ample research has been devoted in developing hyperthermia systems for superficial or deep heating that provide the ability of a flexible and adaptive optimisation of the delivered thermal dose for a specific tumour site [Citation6–8]. At our institute, superficial hyperthermia is administered at 434 MHz using incoherent planar applicators, i.e. the Lucite cone applicator (LCA) or the current sheet applicator (CSA), to treat diseases up to 40 mm from the surface [Citation9]. For the deeper and more centrally located tumours in head and neck (H&N) region, we developed the HYPERcollar applicator consisting of 12 patch antennas arranged in two rings operating coherently at 434 MHz [Citation10]. The HYPERcollar is based on phased-array heating technology, allowing 3D steering of the heat focus to the target region.
Prior to each HYPERcollar treatment, a hyperthermia treatment planning (HTP) is required to obtain information about the optimal amplitude and phase settings for each channel in the phased array, and the patient position in the applicator [Citation11,Citation12]. For hyperthermia target definition, we use identical delineation to the clinical target volume (CTV) used for radiotherapy. Our in-house developed visualisation tool for electromagnetic dosimetry and optimisation, i.e. VEDO, is used to optimise amplitude and phase settings during treatment according to measured temperatures and patient feedback [Citation13]. Pre-treatment planning in superficial hyperthermia is not regularly required and is applied only in special situations: if the CTV is 1) deeper than 40 mm, 2) close to critical organs or 3) includes metal implants [Citation14,Citation15]. We consider HTP an ideal tool for comparison of different treatment modalities.
The purpose of this study was to extend current HT strategies by including also applicator selection in the overall optimisation process for sub-superficial tumours in the head and neck region. For 24 representative patients, we retrospectively compared quality of hyperthermia treatments using HTP for the HYPERcollar, LCA and CSA applicators. HTP for the HYPERcollar was done following our standard clinic procedure [Citation16] and superficial HTP setups for LCA and CSA were created manually by an experienced physicist. Heating quality was assessed using the predicted specific absorption rate (SAR) and temperature coverages of the CTV.
Methods
Patient selection
We selected all patients referred for HT treatment in the H&N region with the CTV extending up to 6 cm from the patient surface, leading to 24 patients in total. 19/24 patients were treated with the HYPERcollar applicator, 3/24 with a setup of 1–6 LCAs (depth CTV ≤4 cm) and 2/24 were not treated due to insufficient SAR coverage. The latter two patients were included in this study to provide situations with a larger variation in the SAR and temperature coverage for the HYPERcollar applicator. The group of 24 patient models comprised of 13 larynx, six oral cavity, four oropharynx and one nasopharynx tumour, i.e. 18 males and six females with mean age of 64.3 ± 10.1 (1 standard deviation) years.
Hyperthermia treatment planning
The patient specific HTP procedure involves finding the optimal hyperthermia system setting (e.g. applicator type and position, amplitude, phase, water bolus temperature) to maximise the heat delivery in the CTV. At our institute, HTP is mandatory prior to HYPERcollar treatments to optimise amplitude and phase settings for each channel in the phase array, and the patient position in the applicator [Citation11,Citation12,Citation16]. HTP also ensures that the specific absorption rate (SAR) in critical tissues such as spinal cord does not exceed safety limits of 60 W/kg [Citation13]. Our in house tool VEDO allows technicians to adjust amplitude and phase settings during treatment according to measured temperatures and patient feedback [Citation13]. Superficial HTP setups were created manually by an experienced physicist (TD) in order to overlap the CTV with at least ten millimetres by the LCA or CSA aperture. Heating quality was assessed using the predicted specific absorption rate (SAR) and temperature coverage of the CTV and gross target volume (GTV), i.e. tumour.
Patient model
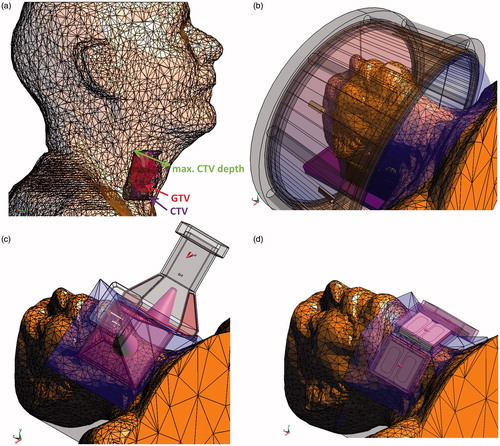
Patient specific 3D models were automatically segmented from on average 166 ± 44 computer tomography (CT) slices using an atlas-based method [Citation17,Citation18]. Adjustment of air at nose and ear cavities, metal implants and assignment of tumour from radiotherapy planning delineation was done manually in iSeg (v. 3.8, ZMT, Zürich, Switzerland). Patient models typically consisted of 15 tissues and it takes around 40 min of processing power plus 20 min of operator time to create 3D patient model at a standard desktop computer. Sclera, optical nerve and vitreous humour were segmented separately for left and right eye. shows a simplified 3D patient model with the CTV and GTV highlighted.
Figure 1. (a) Patient 3D model in SEMCAD X with highlighted CTV and GTV (homogeneous transparent patient model was used for better visualisation of CTV and GTV). Example of treatment planning setups for all studied applicators, (b) HYPERcollar, (c) Lucite cone applicator and (d) current sheet applicator.
HYPERcollar H&N hyperthermia
One point at the top of the nose and two at the edges of the headrest were assigned in iSeg together with the patient model and imported into electromagnetic simulator SEMCAD X (v. 14.8.6, Speag, Zürich, Switzerland). These points were used for automatic positioning (translation and rotation) of the HYPERcollar model such that the patient model was at the identical position as during the test treatment. For each antenna, a harmonic electromagnetic simulation was calculated using SEMCAD X, and 3D electric (E)-field distributions per antenna were exported. These fields were combined in VEDO, and amplitude and phase per field were optimised [Citation13]. shows an example of HTP setup using the HYPERcollar applicator. Within this study we were able to create HTP setups for all 24 patient models using the HYPERcollar applicator.
LCA or CSA H&N hyperthermia
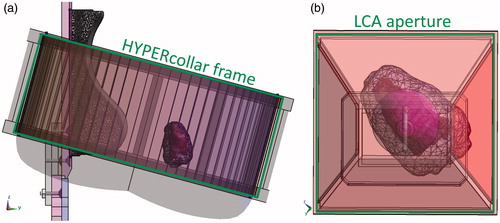
Since superficial arrays are excited in incoherent mode, optimisation of 3D SAR pattern consists of changing the respective power and/or position of each applicator in the array. This makes superficial treatment planning laborious and distinctly different from deep (phased-array) HTP, where individual antennas are fixed with respect to each other. All simulation setups for superficial HTP in this study were created manually in SEMCAD X to enclose the CTV within 50% SAR iso-surface. In clinical practice this translates to overlapping the CTV with the LCA and/or CSA aperture by a margin of at least 10 mm, which is visualised in . For each patient, we studied all possible applicator configurations, e.g. single and/or multiple applicator setups and whenever possible two E-field orientations per applicator. shows an example of a HTP setup using a combination of two LCAs, shows a setup with an array of three CSAs. For the CSA, creation of HTP setups for all 24 patient models was possible, while proper positioning of the LCA during HTP was not possible for two patients due to its large aperture.
Figure 2. CTV and GTV fully (a) within the frame of the HYPERcollar, (b) under the LCA aperture.
EM and temperature calculations
The electromagnetic field simulation settings in SEMCAD X for all three applicators are summarised in . We used a uniform FDTD (Finite Difference Time Domain) step of 1.25 mm for all HYPERcollar simulations. For the CSA/LCA, the feeding parts were modelled using a graded step size (0.05 mm, 0.5 mm), while using maximum 1 mm inside the applicators and maximum 5 mm outside the applicators. The small FDTD grid step of 0.05 mm, necessary to correctly discretize the inner part of the applicator, resulted also in increased calculation time for the CSA. The metal parts of all applicators were modelled as perfect electric conductor (PEC) material and voxelled as continuous volume. Compute unified device architecture (CUDA) acceleration at two GTX Titan graphic cards in SEMCAD X was used for all electromagnetic (EM) simulations. All dielectric and temperature properties, shown in , were assigned using the ITIS material database [Citation19]. The temperature distribution were calculated using the Pennes bioheat [Citation22] equation
where c (J/kg·K) represents the specific heat capacity, ρ (kg/m3) the density, k (W/m·K) the thermal conductivity, cb (J/kg·K) the specific heat capacity of blood, ω (ml/min·kg) the blood perfusion rate, Q (W/kg) the metabolic heat generation, Tb (K) the temperature of the circulated blood and SF (−) is a scaling factor used to implement temperature dependent blood perfusion model [Citation23–25] for muscle, fat and tumour which is shown in . We studied two temperature models
Figure 3. Piecewise linear temperature dependent perfusion scaling factors for muscle, fat and tumour. Please note that the perfusion at the specified temperature is obtained by multiplying the perfusion value at 37 °C with the temperature dependent scaling function.
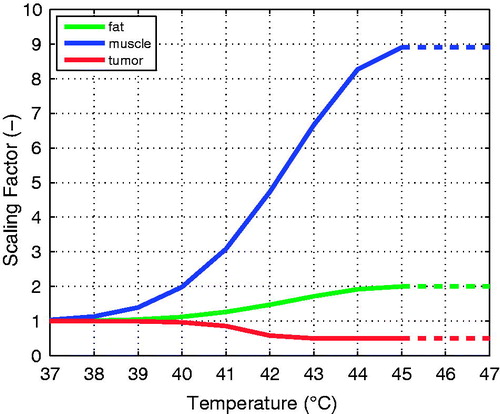
Table 1. Summary of electromagnetic simulation settings in SEMCAD X.
Table 2. Dielectric properties at 434 MHz [Citation20], thermal properties for 37 °C [Citation19], * optimised values from ten patients treated with HYPERcollar applicator [Citation21], the internal air and lung were modelled in temperature simulations using boundary condition.
optimised constant values (ωconst.) – blood perfusion and thermal conductivity as reported by Verhaart et al. [Citation21], optimised to minimise the difference between measured and predicted temperature profiles.
temperature dependent perfusion (ωTdep.) – blood perfusion for fat was piecewise linearly scaled by factor of 2, for muscle by factor of 8.9 and for tumour by factor of 0.5 between temperatures of 37 °C and 45 °C shown in , for all other tissues the scaling factor SF = 1.
For all temperature simulations, we used a uniform 2 mm FDTD discretization, a double precision solver and one hour of heating (treatment) time. Internal air together with metal implants and lung were inactive in the temperature simulations and modelled using mixed boundary condition with heat transfer rate h = 82 W/m2·K and h = 50 W/m2·K, respectively and temperatures of 20 °C and 37 °C. Boundary conditions with h = 8 W/m2·K and temperatures of 20 °C were used for external air and the headrest [Citation21].
Optimization and evaluation
In clinical practice, we use as inclusion criteria for both H&N and superficial treatments that at least 75% of the CTV must be enclosed by the 25% iso-SAR contour [Citation13]. The optimum SAR distribution for the HYPERcollar is obtained using particle swarm optimisation algorithm that maximises the target-hotspot quotient (THQ) representing the ratio of average SAR in the target and hotspot in VEDO [Citation13]. For the LCA and CSA models, we scaled RF power input to individual applicators to obtain equal maximum SAR under each applicator aperture. SAR for all three applicators was adjusted to achieve maximum of 43 °C in normal tissue, i.e. outside GTV.
Results
Patient selection
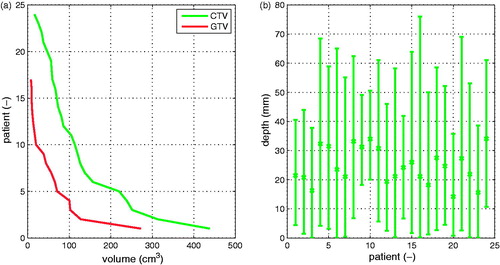
shows cumulative volume size histograms for the CTV and GTV of all 24 patients in this study. We found a median CTV and GTV volumes of 84 cm3 and 39 cm3. Note that seven patients had no GTV since they were treated with radiotherapy combined with hyperthermia after surgical removal of the tumour (“post-operative”). Because of lower number of GTVs, we decided to make further analysis only based on CTV targets. shows mean CTV depth profile including minimum and maximum interval, maximum CTV depth from the patient surface was 54 ± 10.9 mm (mean ± standard deviation). Please note that some of the CTV exceed maximum intended depth of 6 cm, which was caused by fact that at the beginning of the study patients were selected by manual inspection of the CT images.
Figure 4. (a) CTV and GTV volume cumulative histograms for 24 CTVs and 17 GTVs, (b) mean CTV depth profiles including minimum and maximum depth interval.
EM and temperature prediction
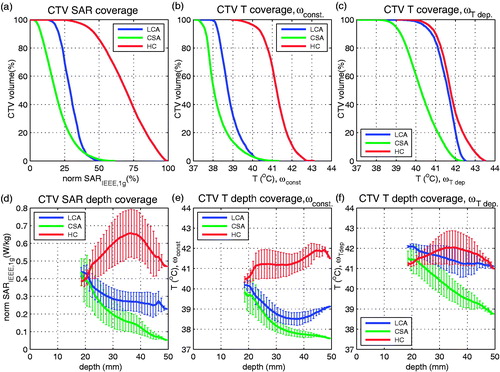
shows the cumulative SAR histograms in the CTV for the three studied applicators for an example patient. shows CTV temperature volume histograms for constant (5 b) and temperature dependent (5c) perfusion models. shows CTV depth profiles of the SAR normalised to obtain maximum of 1 W/kg in the patient model and the two temperature models. Solid lines represent the mean values while the whiskers indicate the ± standard deviation range over the CTV depth, which spanned 18 mm–50 mm depth. demonstrates the deep heating capabilities of the HYPERcollar applicator: the maximum mean SAR is at 36 mm depth from the patient surface. For both superficial applicators this maximum is located at 18 mm, which is the minimum depth of the CTV for this patient. The large and a priori unknown variation in blood perfusion especially in head and neck region could result in large uncertainty in the predicted temperature distribution. In this example, T50 for the HYPERcollar changes from 41.2 °C to 41.8 °C and for the LCA from 38.8 °C to 41.6 °C when going from constant perfusion values to the temperature-dependent model (see ). For all 24 patients, we found an average temperature T50 increase of 2.0 °C for LCA, 2.0 °C for CSA and 1.6 °C for HYPERcollar when applying temperature-dependent perfusion instead of constant perfusion model. Therefore, we decided to use mainly SAR coverage for further analyses.
Figure 5. Example of SAR and temperature cumulative histograms and depth profiles for Lucite cone applicator (LCA), current sheet applicator (CSA) and HYPERcollar applicator (HC). CTV (a) cumulative SAR histograms; (b) constant perfusion model (ωconst.), temperature histograms; (c) temperature dependent perfusion model (ωTdep.) temperature histograms; (d) mean SAR ± standard deviation (SD) range; (e) mean temperature ± SD range for (ωconst.) and (f) mean temperature ± SD range for (ωTdep.) for CTV depth (from 18 mm to 50 mm) and all three studied applicators.
shows comparison of TC25 for LCA and CSA applicators against HYPERcollar for CTV, encircled points indicate comparisons for setups where the CTV was fully positioned within the frame of the HYPERcollar (see ). There are only 22 comparisons for LCA vs. HYPERcollar in , since for two patients we were not able to create HTP setups for the LCA. In 2/24 CSA provided better, in 3/24 comparable and in 19/24 a worse TC25 coverage than the HYPERcollar (see ). Because only in 2/22 patients CSA provided slightly (by 2.9% and 4.6%) better TC25 than the LCA, we limited all additional comparisons to LCA and HYPERcollar.
Figure 6. TC25 comparison of CTV for: (a) the Lucite cone applicator (LCA) and (b) the current sheet applicator (CSA) vs. the HYPERcollar, comparisons for CTV within HYPERcollar frame are encircled with red colour. Note that for two LCA vs. HYPERcollar comparisons we received almost identical values resulting in partly overlapping of two points.
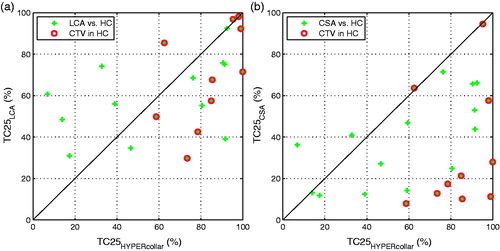
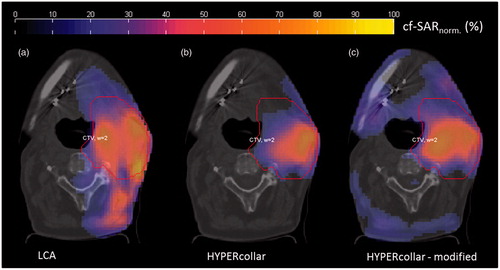
For five patients, with a CTV outside the HYPERcollar frame, LCA provided better TC25 than the HYPERcollar (above identity line in ). These CTVs were located in the lower part of the neck and extended towards the sternum. When the CTV was fully positioned within the HYPERcollar frame (ten patients), the HYPERcollar was better 7/10 or equal 2/10 to the LCA, and worse only for 1/10 patient. Normalized cubic-filtered SAR (%) distributions from VEDO are shown for this patient in . This figure compares a) LCA (TC25LCA=86%), b) HYPERcollar (TC25HYPERcollar=62%) and c) modified HYPERcollar (TC25HYPERcollar=78%). When re-optimizing phase/amplitude settings, TC25 coverage could be improved for the HYPERcollar, but at the cost of the THQ (: from 1.73 to 1.48, vs. 1.12 for the LCA).
Figure 7. Example of normalised cubic-filtered SAR (%) axial slices in VEDO for (a) Lucite cone applicator, TC25 = 86%; (b) initial HYPERcollar optimisation, TC25 = 62% and (c) modified HYPERcollar optimisation which was done in order to improve TC25 = 78%, however the target-to-hotspot quotient (THQ) decreased from 1.73 for case (b) to 1.48 for case (c); for case (a) LCA THQ =1.12. Note that the CTV delineation for LCA and HYPERcollar differs slightly due to the different FDTD grid implementation in SEMCAD X.
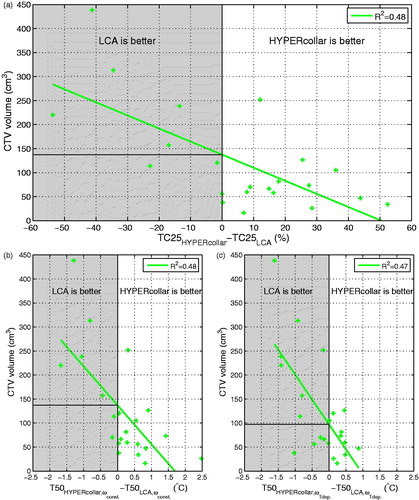
shows the correlation of the TC25 difference between HYPERcollar and LCA as function of CTV volume for the 22/24 patients where LCA-based HTP was possible. Based on the fitted linear line, the LCA provides better TC25 coverage than the HYPERcollar when CTV volumes are larger than 137 cm3. Correlations of the T50 difference between HYPERcollar and LCA for constant and temperature dependent perfusion models are shown in , respectively. Results from constant perfusion model leads to identical CTV volume of 137 cm3 found using SAR TC25 analyse. The thermal-dependent model results in a smaller CTV volume of 97 cm3, due to the lower average T50 increase between the constant and the temperature-dependent model of the HYPERcollar compared to the LCA. A TC25 difference less than 1.5% was found in 2/22 patients located fully within the HYPERcollar frame and also under the LCA aperture, but with a CTV not exceeding 40 mm depth. These results confirm our approach of using the superficial hyperthermia LCA array in the H&N region when the CTV does not exceed 40 mm depth and the CTV can be covered with LCA aperture.
Figure 8. (a) correlations between TC25HYPERcollar–TC25LCA and 22 CTV volumes, correlations between T50HYPERcollar–T50LCA using (b) constant perfusion model and c) temperature dependent perfusion model.
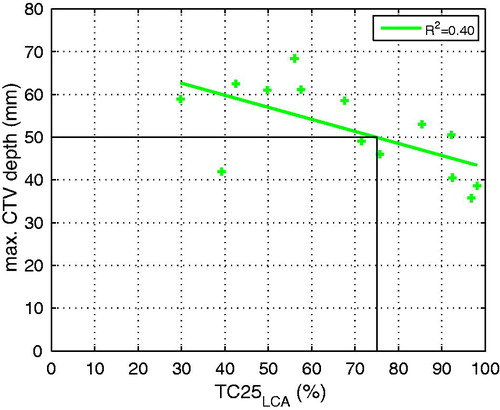
shows the variation of TC25LCA against maximum CTV depth for 14 CTVs that were fully under the LCA aperture (see ). Based on the fitted linear data, for CTV with maximum depth of 50 mm we obtained TC25 ≥ 75%, which is the inclusion criterion for HT in the H&N region at our institute.
Figure 9. Dependency of TC25LCA and 14 maximum CTV depths for CTVs fully under LCA apertures. Applying a threshold of TC25 = 75%, i.e. our inclusion criteria for deep H&N HT, the maximum CTV depth is 50 mm.
Discussion
The HYPERcollar proved to be the preferred applicator over superficial hyperthermia applicators for targets positioned fully within its frame. Only for one single patient with the CTV fully within HYPERcollar frame, the LCA obtained better TC25 than HYPERcollar. This can be explained by higher (better) THQ, used as an objective function for all HYPERcollar optimisation, in comparison to THQ value obtained for LCA. For five patients with CTV in larynx region and the target outside of the HYPERcollar frame, the LCA achieved better TC25. Our analysis shows that the LCA can provide a high quality HT treatment in the larynx region if the CTV is covered by the aperture and the maximum CTV depth does not exceed 50 mm. Hence, we might consider changing the general threshold from 40 mm to 50 mm in our current practice for larynx tumours. Note that these conclusions are valid only for the LCA, which has a depth optimised SAR profile, and are not valid for other superficial applicators like the CSA due to the different SAR characteristics.
The HYPERcollar3D, i.e. second generation of the applicator, provides equal or better SAR coverage than the HYPERcollar [Citation26] and thus all conclusions drawn for the HYPERcollar within this study will be applicable also for HYPERcollar3D. One of the main redesign aspects of the HYPERcollar3D compared to HYPERcollar was the reproducibility of the water bolus [Citation26,Citation27]. However, the consequence for this more reproducible water bolus is the current inability to treat larynx tumours, as the current water bolus design of the HYPERcollar3D does not cover the lower neck region. Due to this inability to properly heat larynx tumours with the HYPERcollar3D, treatments using the LCA represent a relevant treatment option for this patient group.
For temperature simulations we applied two models in this study, one with constant temperature conductivity and the perfusion optimised for the HYPERcollar applicator and a second more generic model with a temperature-dependent blood perfusion. These simulations led to different observations regarding applicator performance. The results of the temperature-dependent blood perfusion model would in some cases even advocate superficial applicators compared to the HYPERcollar applicator while the latter clearly provided better SAR profiles. For superficial applicators, we found differences up to 3 °C between these two temperature models. Based on these large differences, we decided to base conclusions in this study purely on the SAR coverage. We feel that our state-of-the-art temperature simulations failed to consistently pinpoint favourable applicators, which confirm our believe for a need of more reliable thermal model. These uncertainties in temperature prediction are one of the main reasons why at our institute we currently use only SAR coverage for treatment guidance in clinical practice.
In current clinical hyperthermia practice, selecting the best applicator system is not often required. However, in our institute we have the unique opportunity of multiple heating systems for hyperthermia in the H&N region, i.e. phased arrays (HYPERcollar and HYPERcollar3D) and planar arrays (six LCA or CSA elements). Making the selection is still mostly a qualitative, expertise-based process with as main criteria the tumour location and the ability to properly position the heating system at the patient. For the HYPERcollar treatment, HTP is always required in order to decide on the optimal phase and amplitude settings of the 12 antennas. With the HYPERcollar, nearly the whole patient’s head is enclosed by the surrounding water bolus and positioning of the applicator must be highly precise in order to accurately translate the HTP to the clinical setting. For a planar array of LCA or CSA elements, HTP is performed only in exceptional cases, and also antenna positioning is less critical, allowing more flexibility to address patient’s requirements for comfort. Note though that this lower antenna positioning accuracy also in turn makes HTP less predictive. Another benefit of superficial HT is that it requires less personnel [Citation9]. The results reported in this study represent our attempt to apply more objective criteria and to improve our process of applicator selection for tumours in H&N region. To our knowledge, this is the first clinically based study comparing different heating strategies for (sub-superficial) hyperthermia using incoherent and coherent applicators.
The superficial hyperthermia simulation setups were created manually by placing applicators to the appropriate treatment position. The LCA provided better SAR coverage of the CTV than CSA in 20/24 patients, which was caused by the depth optimised SAR pattern of the LCA and hence high effective field size (92cm2) with respect to its aperture size [Citation28]. For two patients, it was not possible to place the LCA into the correct position due to the size of the LCA aperture of 10 × 10 cm2. In case of CSA, we were able to build treatment setups for all patients in this study. On the other hand, the rectangle CSA shape made generation of simulations setups more difficult, while the square aperture of the LCA allowed to easily study two E-field orientations. Note that these orientations are often used in sequential treatments to improve treatment quality robustness. Experience obtained by building the HTP models revealed that an applicator with a square aperture around 50–60 mm will provide easier applicator placement and better patient contour conformity. To provide good heating, the EFS should always preferably be equal to the footprint of the applicator. Nevertheless, still a possible decrease in penetration depth needs to be considered during the design procedure for applicators with a smaller aperture [Citation29,Citation30]. A confounding factor in this study was the patient position during the CT scan. All 24 patient models used for this study were generated for a HYPERcollar treatment. This implied that patient position during the CT scan was fixed using a H&N mask. This limited the placement of superficial applicators since patients would preferably be positioned on a bed facing sideways to expose a larger part of the neck. This may affect the SAR and temperature coverages, especially for the LCA, however, we do not know to what extend as some patients also have a limited ability to turn the head. In addition, application of the mask allows direct use of the CTV and GTV that are standardly delineated for radiotherapy treatment planning for HT purposes, resulting in faster and easier to apply HTP process.
Conclusion
This simulation study shows that phased-array applicators like the HYPERcollar provide better SAR coverage for all patients than superficial applicators when used within specifications, i.e. the target region is fully enclosed by the applicator frame. For targets extending outside the HYPERcollar frame, planar arrays like multiple LCAs can be considered if the target can be covered with its aperture and is located less than 50 mm from the skin.
Disclosure statement
The authors report no declarations of interest.
Additional information
Funding
References
- Valdagni R, Amichetti M. (1994). Report of long-term follow-up in a randomized trial comparing radiation therapy and radiation therapy plus hyperthermia to metastatic lymph nodes in stage IV head and neck patients. Int J Radiat Oncol Biol Phys 28:163–9.
- Jones EL, Oleson JR, Prosnitz LR, et al. (2005). Randomized trial of hyperthermia and radiation for superficial tumors. J Clin Oncol 23:3079–85.
- Franckena M, Stalpers LJA, Koper PCM, et al. (2008). Long-term improvement in treatment outcome after radiotherapy and hyperthermia in locoregionally advanced cervix cancer: an update of the Dutch Deep Hyperthermia Trial. Int J Radiat Oncol Biol Phys70:1176–82.
- Cihoric N, Tsikkinis A, van Rhoon G, et al. (2015). Hyperthermia-related clinical trials on cancer treatment within the ClinicalTrials.gov registry. Int J Hyperthermia 31:609–14.
- Franckena M, Fatehi D, de Bruijne M, et al. (2009). Hyperthermia dose-effect relationship in 420 patients with cervical cancer treated with combined radiotherapy and hyperthermia. Eur J Cancer 45:1969–78.
- Wust P, Hildebrandt B, Sreenivasa G, et al. (2002). Hyperthermia in combined treatment of cancer. Lancet Oncol 3:487–97.
- Stauffer PR. (2005). Evolving technology for thermal therapy of cancer. Int J Hyperthermia 21:731–44.
- Trefna HD, Crezee H, Schmidt M, et al. (2017). Quality assurance guidelines for superficial hyperthermia clinical trials: I. Clinical requirements. Int J Hyperthermia 0:1–12.
- van der Zee J, de Bruijne M, Mens JWM, et al. (2010). Reirradiation combined with hyperthermia in breast cancer recurrences: overview of experience in Erasmus MC. Int J Hyperthermia 26:638–48.
- Paulides MM, Bakker JF, Neufeld E, et al. (2007). Winner of the “New Investigator Award” at the European Society of Hyperthermia Oncology Meeting 2007. The HYPERcollar: a novel applicator for hyperthermia in the head and neck. Int J Hyperthermia 23:567–76.
- Paulides MM, Bakker JF, Linthorst M, et al. (2010). The clinical feasibility of deep hyperthermia treatment in the head and neck: new challenges for positioning and temperature measurement. Phys Med Biol 55:2465–80.
- Paulides MM, Stauffer PR, Neufeld E, et al. (2013). Simulation techniques in hyperthermia treatment planning. Int J Hyperthermia 29:346–57.
- Rijnen Z, Bakker JF, Canters RAM, et al. (2013). Clinical integration of software tool VEDO for adaptive and quantitative application of phased array hyperthermia in the head and neck. Int J Hyperthermia 29:181–93.
- de Bruijne M, Wielheesen DHM, van der Zee J, et al. (2007). Benefits of superficial hyperthermia treatment planning: five case studies. Int J Hyperthermia 23:417–29.
- Trujillo-Romero CJ, Paulides MM, Drizdal T, van Rhoon GC. (2015). Impact of silicone and metal port-a-cath implants on superficial hyperthermia treatment quality. Int J Hyperthermia 31:15–22.
- Paulides MM, Verduijn GM, Van Holthe N. (2016). Status quo and directions in deep head and neck hyperthermia. Radiat Oncol 11:21.
- Fortunati V, Verhaart RF, van der Lijn F, et al. (2013). Tissue segmentation of head and neck CT images for treatment planning: a multiatlas approach combined with intensity modeling. Med Phys 40:071905.
- Fortunati V, Verhaart RF, Niessen WJ, et al. (2015). Automatic tissue segmentation of head and neck MR images for hyperthermia treatment planning. Phys Med Biol 60:6547.
- Hasgall PA, Neufeld E, Gosselin MC, et al. ITIS Database for thermal and electromagnetic parameters of biological tissues; 2013. Available from: https://www.itis.ethz.ch/virtual-population/tissue-properties/overview/.
- Gabriel S, Lau RW, Gabriel C. (1996). The dielectric properties of biological tissues: III. Parametric models for the dielectric spectrum of tissues. Phys Med Biol 41:2271–93.
- Verhaart RF, Verduijn GM, Fortunati V, et al. (2015). Accurate 3D temperature dosimetry during hyperthermia therapy by combining invasive measurements and patient-specific simulations. Int J Hyperthermia 31:686–92.
- Pennes HH. (1948). Analysis of tissue and arterial blood temperatures in the resting human forearm. J Appl Physiol 1:93–122.
- Song CW, Lokshina A, Rhee JG, et al. (1984). Implication of blood flow in hyperthermic treatment of tumors. IEEE Trans Biomed Eng 31:9–16.
- Lang J, Erdmann B, Seebass M. (1999). Impact of nonlinear heat transfer on temperature control in regional hyperthermia. IEEE Trans Biomed Eng 46:1129–38.
- Drizdal T, Togni P, Visek L, Vrba J. (2010). Comparison of constant and temperature dependent blood perfusion in temperature prediction for superficial hyperthermia. Radioengineering 19:281–9.
- Togni P, Rijnen Z, Numan WCM, et al. (2013). Electromagnetic redesign of the HYPERcollar applicator: toward improved deep local head-and-neck hyperthermia. Phys Med Biol 58:5997–6009.
- Rijnen Z, Togni P, Roskam R, et al. (2015). Quality and comfort in head and neck hyperthermia: a redesign according to clinical experience and simulation studies. Int J Hyperthermia 31:823–30.
- van Rhoon GC, Rietveld PJ, van der Zee J. (1998). A 433 MHz Lucite cone waveguide applicator for superficial hyperthermia. Int J Hyperthermia 14:13–27.
- Cheever E, Leonard JB, Foster KR. (1987). Depth of penetration of fields from rectangular apertures into lossy media (short paper). IEEE Trans Microw Theory Technol 35:865–7.
- Nilsson P, Physics and technique of microwave-induced hyperthermia in the treatment of malignant tumours. Sweden: Lund University; 1984. Chapter: Absorbed power distributions from single or multiple electromagnetic direct-contact waveguide applicators for hyperthermia.