
 ?Mathematical formulae have been encoded as MathML and are displayed in this HTML version using MathJax in order to improve their display. Uncheck the box to turn MathJax off. This feature requires Javascript. Click on a formula to zoom.
Abstract
Aim: Thermal isoeffective dose (TID) has not been convincingly validated for application to predict biological effects from rapid thermal ablation (e.g., using >55 °C). This study compares the classical method of quantifying TID (derived from hyperthermia data) with a temperature-adjusted method based on the Arrhenius model for predicting cell survival in vitro, after either ‘rapid’ ablative or ‘slow’ hyperthermic exposures.
Methods: MTT assay viability data was obtained from two human colon cancer cell lines, (HCT116, HT29), subjected to a range of TIDs (120–720 CEM43) using a thermal cycler for hyperthermic (>2 minutes, <50 °C) treatments, or a novel pre-heated water bath based technique for ablative exposures (<10 seconds, >55 °C). TID was initially estimated using a constant RCEM>43°C=0.5, and subsequently using RCEM(T), derived from temperature dependent cell survival (injury rate) Arrhenius analysis.
Results: ‘Slow’ and ‘rapid’ exposures resulted in cell survival and significant regrowth (both cell lines) 10 days post-treatment for 240 CEM43 (RCEM>43°C=0.5), while 340-550 CEM43 (RCEM>43°C =0.5) delivered using ‘rapid’ exposures showed 12 ± 6% viability and ‘slow’ exposures resulted in undetectable viability. Arrhenius analysis of experimental data (activation energy ΔE = 5.78 ± 0.04 × 10⁵ J mole−1, frequency factor A = 3.27 ± 11 × 1091 sec−1) yielded RCEM=0.42 * e0.0041*T which better-predicted cell survival than using R CEM> 43°C=0.5.
Conclusions: TID calculated using an RCEM(T) informed by Arrhenius kinetic parameters provided a more consistent, heating strategy independent, predictor of cell viability, improving dosimetry of ablative thermal exposures. Cell viability was only undetectable above 305 ± 10 CEM43 using this revised measure.
Introduction
In the treatment of cancer, thermal ablation therapies including high intensity focused ultrasound (HIFU), radiofrequency, microwave and laser ablation have attracted increasing interest over the past few decades. The primary aim of these therapies has been to heat target tissue rapidly, to achieve ablative temperatures (>55 °C, but often ∼80 °C) in a few seconds, in order to avoid the cooling effects of blood flow that make low temperature, long duration (many minutes) hyperthermia treatment challenging to plan and deliver. The resultant effect is primary and secondary cell necrosis [Citation1,Citation2]. Despite the minimally and/or noninvasive nature of thermal ablation treatments, and the advantages these confer, their use in the clinic has been, at least in part, hampered by lack of a universally-accepted dosimetric framework [Citation3]. To address this shortcoming, a parameter known as the thermal isoeffective dose (TID) commonly used for longer duration, lower temperature (‘slow’ hyperthermic) thermal exposures [Citation4–6], was introduced to relate the exposure of tissues to increased temperatures, held for different lengths of time, to a given biological endpoint [Citation7]. EquationEquation (1)(Equation 1)
(Equation 1) shows the mathematical expression for accumulated thermal dose:
(Equation 1)
(Equation 1)
where TID is the thermal dose in units of cumulative equivalent minutes at 43 °C (CEM43), dt is the time at temperature T (°C), RCEM is approximated as 0.25 for temperatures <43 °C and 0.5 for temperatures >43 °C, and
represents the final time point of the thermal treatment [Citation8]. This formulation of TID suggests that, for each 1 °C increase in temperature above 43 °C, the treatment time should be halved to achieve the same cytotoxic effect. In practice, the thermal dose must be quantified over the whole of any hyperthermic temperature-time treatment profile: including the initial period of increasing temperature, any period of approximately constant temperature, and the cooling period of reducing temperature.
This relationship has been tested in vitro with a biological endpoint of cell survival and found to provide a reasonable prediction of cell death for temperatures between 40 and 47 °C, the range for which it was originally formulated [Citation9–11]. In this temperature range, heat exhibits pleiotropic effects on the protein and DNA structures of the cells resulting in the reduction of their survival [Citation12]. In vivo, a TID value of 240 CEM43 has been shown to result in coagulative necrosis of prostate tissue [Citation13] and uterine fibroids [Citation14] when magnetic resonance imaging thermometry was used for noninvasive temperature measurement.
The challenge in thermal biology remains to validate this ‘slow’ hyperthermic concept in vitro for ‘rapid’ ablative treatments. Two issues hinder the ability to achieve this. First, during ‘rapid’ ablative exposures, temperature inhomogeneity within a sample renders the use of an average TID to represent the dose to all cells inappropriate, since cells may be subjected to a wide range of different TID. For example, 1 s exposures at 55 °C, 56 °C and 57 °C result in TID of ∼68, 135 and 270 CEM43 respectively. Thus a difference of +2 °C can result in a TID difference of ∼400%. Such differences are likely to be associated with markedly different cell kill. Secondly, the time required to achieve temperature transitions during ‘rapid’ ablative exposures becomes significantly long relative to the total treatment time. Using isosurvival curves based on data from clonogenic assays, Borelli et al. demonstrated that ‘slow’ hyperthermic and ‘rapid’ ablative exposures in vitro in the temperature range of 43.5 °C–57 °C held for times ranging from 35 min to 1 s, respectively, resulted in similar survival of Baby Hamster Kidney cells (BHK) cells when the same thermal dose was delivered [Citation15]. This data, combined with additional studies, led to the suggestion of a cytotoxic isoeffect between the thermal treatment of 135 min at 43.5 °C (190 CEM43) and 2–3 s at 57 °C (550–820 CEM43) [Citation15,Citation16]. In renal cancer cells, and prostate cells and tissue TIDs between 800 and 150 000 CEM43 were necessary to achieve 99% cell kill when temperatures greater than 55 °C were used [Citation17,Citation18]. Also, a TID between 210 and 670 CEM43 was required to kill 99% of prostate AT-1 cells using temperatures between 40 and 60 °C. In experiments undertaken in skin tissue has been shown that TID >10 000 CEM43 is needed to kill all cells [Citation19]. Experiments in human and pig skin in vivo have shown that at temperatures >55 °C the Arrhenius plots are not linear, making it difficult to calculate the activation energy suggesting the existence of additional transition points for the RCEM value in addition to those established at 43 °C [Citation20,Citation21]. For example, in-vitro studies with hepatocellular cancer cells have shown that in the temperature range of 50–60 °C RCEM can be as high as 0.72 [Citation22], and in prostate cells and tissue can vary from 0.47 to 0.83 [Citation18].
This study aims to assess whether the method for calculating TID derived from long duration hyperthermia experiments is suitable for quantifying dose for ablative techniques. The cytotoxic effects of ‘slow’ hyperthermic and ‘rapid’ ablative thermal exposures are compared using in-vitro models of colon adenocarcinoma at times up to 14 days after thermal insult. We define ‘slow’ hyperthermic exposures as those lasting more than 2 min at temperatures in the range of 44–50 °C, in which there is temperature homogeneity throughout the sample and the thermal insult can, therefore, be described by a spatially-averaged TID. We define ‘rapid’ ablative exposures as being short duration with clinically ablative intention, (i.e., <10 s, in the temperature range 55–64 °C) during which temperature homogeneity cannot be achieved, and for which spatially-averaged TID does not provide a meaningful representation of the exposure. Instead, the local TID at a fixed location where the dose is designed to be minimal is denoted as minTID. In order to achieve ‘rapid’ ablative exposure conditions, a heating bath method which incorporates temperature measurement at 100 Hz at multiple positions in a (500 μl) polymerase chain reaction (PCR) tube was developed. The cytotoxic effects of ‘rapid’ ablative heating to temperatures above 55 °C were compared with heating using a cell thermal cycler (PCR machine) suitable for ‘slow’ hyperthermic exposures in the range of 44–50 °C. The TID required to reduce cell viability in vitro to undetectable levels of 10 days (chosen as the best indicator of the therapeutic effect, see discussion) after exposure was investigated for both ‘rapid’ ablative and ‘slow’ hyperthermic thermal exposures, and a significant difference was demonstrated between the 2 delivery regimes.
Materials and methods
Cell culture
HCT116 and HT29 cells (provided Dr. Yuen-Li Chung, The Institute of Cancer Research, London) were maintained in a sub-confluent monolayer at 37 °C in 75cm2 flasks in a humidified atmosphere containing 5% CO2. They were propagated using Hyclone McCoys 5 A medium supplemented with 10% hybridoma cell culture grade fetal bovine serum ((FBS) USA (cat. no. F2442, SIGMA, Poole UK)), 2 mM L-glutamine, 50 U/ml penicillin, 50 mg/ml streptomycin B, 0.25 μg/ml amphotericin B and sub-cultured using Accutase (SIGMA). Screening for mycoplasma contamination was carried out on a monthly basis.
Thermal exposures and thermometry
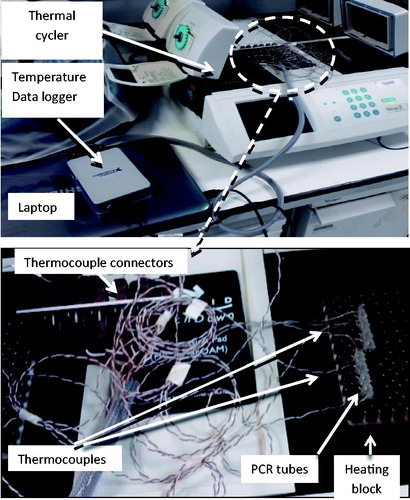
For all thermometry measurements, thermocouples were connected to a DELL laptop (Intel® Core™ i5-2540M CPU at 2.6GHz, RAM 8GB) (Round Rock, Texas) via a cDAQ-9171 National Instruments data logger (Austin, Texas) ().
Figure 1. ‘Slow’ hyperthermic thermal exposure of cells achieved using a PCR thermal cycler. 60 μL of cells in a medium in plastic walled PCR tubes were placed in individual wells with the heating block. Thermocouples connected to a data logger were used to record temperature with one thermocouple per tube. The thermal dose was delivered using the range of heating cycles detailed in .
For experiments involving ‘slow’ hyperthermic exposures (lasting between 112 s and 1 h, and with peak temperatures between 50 (high) and 44 °C (low), with control cells being maintained at 37 °C), a Biorad Tetrad2 DNA Engine polymerase chain reaction (PCR) thermal cycler (Hercules, CA, USA) was used, the specifications of which are shown in . The thermal cycler delivered preprogramed temperatures for specified lengths of time as shown in . In order to determine the TID for a variety of exposure conditions, T-type thermocouples with 0.2 mm wire diameter, 0.57 mm probe diameter and accuracy of ± 0.5 °C up to 125 °C (cat. no. 6212164, RS Instruments, Corby, UK) were used to determine the temperature at a number of positions within the fluid contained in the PCR tube as described previously [Citation23]. Temperature homogeneity within the treatment volume was within 0.3 °C [Citation23]. The T-type thermocouple offset was estimated as 0.325 °C ± 0.025 °C by the National Physical Laboratory (Teddington, UK) using a source of constant temperature at 20 °C. Temperature measurements used to calculate TIDs were corrected for this offset error.
Table 1. Biorad Tetrad2 DNA Engine PCR thermal cycler specifications.
Table 2. Details of ‘slow’ hyperthermic thermal exposures averaged over 5 experiments achieved using the PCR thermal cycler as the heating source.
Measurements were made simultaneously in 5 PCR tubes (0.2 ml medical grade, wall thickness 0.375 ± 0.025 mm Corning Inc., NY) containing the same volume of medium (60 μl) as used for the cell studies, but with no cells present. One thermocouple was placed in each tube with the intention of sampling temperature in a number of positions, in order to assess the variation in thermal dose. Temperature, recorded at 100 Hz simultaneously for all 5 sensors using custom-written Matlab software, was converted to TID using EquationEquation (1)(Equation 1)
(Equation 1) . These experiments were repeated 5 times in order to measure the maximum range of actual thermal dose for all the time/temperature combinations used for ‘slow’ hyperthermic exposures. Since a variety of thermocouple measurement positions were sampled, these data were averaged in order to quantify the ‘spatially-averaged’ TID for each ‘slow’ exposure condition, in order to attempt to represent the dose delivered when homogeneous temperature distributions were achieved.
For cell survival experiments, cells from stock culture were trypsinized, and 60 μl of the resulting solution, at 4 °C and a density of 2 × 10⁶ cells/ml, transferred to the PCR tubes. The cell containing solutions were heated using the PCR thermal cycler, and the 3 target-temperature step cycles were programed to give TIDs of 0 CEM43 using exposures of 37 °C for 15 min (control), 120 CEM43 using exposures of 44 °C for 60 min, 46 °C for 15 min, and/or 48 °C for 3 min and 45 s, 240 CEM43 using exposures of 46 °C for 30 min, 47 °C for 15 min, 48 °C for 7 min and 30 s, and/or 50 °C for 112.5 s, 340 CEM43 using exposures of 48 °C for 10 min and 36 s, 480 CEM43 using exposures of 48 °C for 15 min, 680 CEM43 using exposures of 49 °C for 10 min and 36 s and 720 CEM43 using exposures of 49 °C for 11 min and 15 s (). Before and after thermal exposure, cells were cooled to 4 °C for 1 min to normalize their intracellular processes. At the end of the treatment, 25 μl aliquots of control and treated cells were transferred to 24- and 96-well plates to allow fluorescent microscopy and MTT cell viability assays to be performed, respectively.
For ‘rapid’ ablative thermal exposures, cells in 220 μl medium in 0.5 ml PCR tubes were treated with a TID of 205, 410 or 820 CEM43 using 3 s exposures to temperatures of 55 °C, 56 °C and 57 °C respectively. In order to evaluate the efficacy of the technique for delivering quantifiable thermal dose to a population of cells, 5 fast response PFA-insulated 0.078 mm k-type thermocouples (5SRTC-TT-KI-40-1M, Omega, Stamford, Connecticut) were placed at various positions within PCR tubes containing 180 μl of medium, as shown in , and the wires tethered using tape. Thermocouple (tc) 1 was always placed as close to the bottom of the tube as possible, with tc2 adjacent to it, and tc 5 just below the surface of the solution. The other sensors were positioned roughly as shown but the positions were not designed to be reproducible since the aim was only to sample temperature and thermal dose away from the bottom of the tube and the top of the solution to verify that these positions represented a minimum and (approximately) maximum thermal dose, respectively.
Figure 2. ‘Rapid’ ablative thermal dose delivery. (A) indicates how 5 K-type thermocouples were positioned in the pre-heated medium. Also shown is roughly where the cells were pipetted into the pre-heated solution for an intended exposure of 57 °C for 3 s. (B and C) show typical examples of the temperature histories measured for such an exposure which was intended to provide a minimum TID of 820 CEM43. The resultant exposures are summarized in terms of thermal dose and peak temperature in .
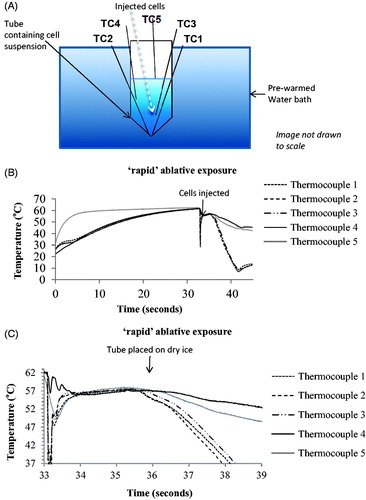
Before exposure, cells were kept on ice (4 °C) at a concentration of 2 × 10⁶ cells/ml. A water bath preheated to 65 °C was used in an attempt to minimize the discrepancy between the intended and actual (i.e., that calculated from measured temperature and exposure duration) TID. Medium (180 μl) without cells was pre-warmed in this water bath, with the PCR tube held such that the surface of the medium was below that of the heated water, in order to minimize the rate of cooling during the heating phase.
When the temperatures recorded by all the indwelling thermocouples exceeded 63 °C, 40 μl of medium containing cells were rapidly pipetted into the bottom of the PCR tube (in order to contribute to providing a minimum thermal dose at the bottom of the tube, as demonstrated in experiments in which red ink replaced cells (Appendix A and video A and B)). The pipette tip was inserted into the heated fluid and the cool medium injected soon enough so that heating prior to injection was ignored. The aim was to achieve a temperature rise as rapid as possible by exploiting the mixing of a small volume of cool liquid containing cells with a much larger heated volume, thus ideally resulting in an unaltered equilibrium (hot) temperature. As soon as tc 1 reached 56–57 °C the tube was taken out of the water bath and the bottom of it placed into dry ice within ∼1–2 s. This technique was chosen to minimize the duration of the cooling phase for ‘rapid’ ablative exposures.
For data processing purposes, the ‘increasing temperature’ phase of ‘rapid’ ablative exposures begins after the injection of cells into the PCR tube (as soon as the temperature recorded by tc 1 reaches a minimum) and lasts until the temperature recorded by the bottom thermocouple (i.e., that placed deepest into the PCR tube) reaches within 0.6 °C (twice the measurement uncertainty) of the peak temperature (defined as the steady-state temperature plus the measurement uncertainty of 0.3 °C). Cooling phase duration is calculated similarly as the time between the temperature of the bottom thermocouple falling 0.6 °C below peak temperature to reaching 39 °C. Once the temperature of the lowest placed thermocouple dropped below 10 °C the cells were re-suspended twice and plated in 96-well plates by pipetting 25 μl of the experimental cell mixture into 80 μl of unexposed media. The steady-state phase was defined as the period between the end of the increasing temperature phase and the cooling phase. Control cells were exposed for 10 s at room temperature in the same way as thermally-exposed cells.
Cell viability: MTT
An MTT assay, based on the reduction of the tetrazolium dye MTT 3–(4,5-dimethylthiazol-2-yl)-2,5-diphenyltetrazolium bromide to formazan in mitochondria, was used to determine cell viability. The optical density (OD) signal from the assay correlates linearly with live cell number over a range of 0–105 cells. 20 μl MTT dye (5 mg/ml)/100 μl of medium was added to the cells in 96 well plates, which were then incubated at 37 °C for 2 h. 100 μl of 10% sodium dodecyl sulfate (SDS) was then added to each well. After overnight incubation at 37 °C, the signal intensity at 550 nm was measured using a microplate reader. The average OD of wells containing medium only (n = 4) was subtracted from each signal in order to provide a background correction, the resulting average signal from control cells was then normalized to 100% and the individual signal from treated cells was expressed as a percentage of the control:
(Equation 2)
(Equation 2)
The viability of both cell lines was assessed up to 14 days after ‘slow’ hyperthermic exposures of 0, 120, 240, 480 and 720 CEM43 (3 independent experiments, n = 4 per dose) ( and ). The objective of these experiments was to characterize the long-term survival of the cells at regular intervals.
Figure 3. Average viability of HCT116 and HT29 colon cancer cells assessed up to 14 days after ‘slow’ hyperthermic exposures with TIDs of 0, 120, 240, 480 and 720 CEM43 achieved using 37 °C, 46 °C, 47 °C, 48 °C for 15 min and 49 °C for 11 min and 15 s, respectively. Results are presented as means ± SEM for three independent experiments per data point.
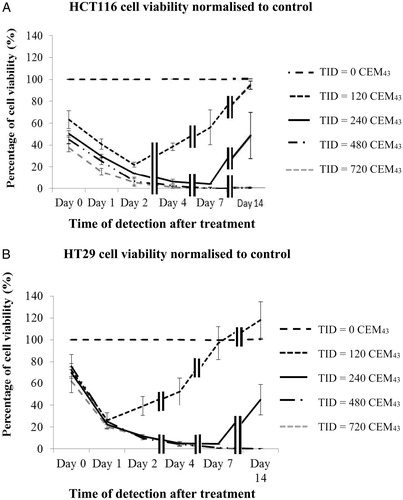
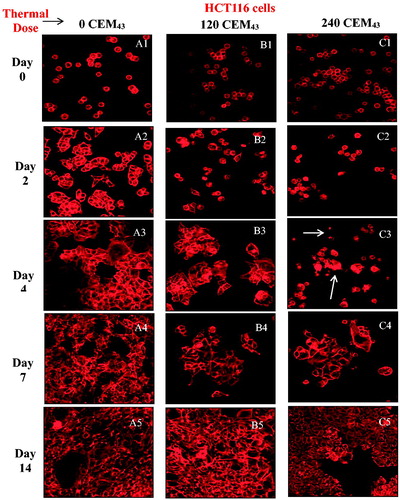
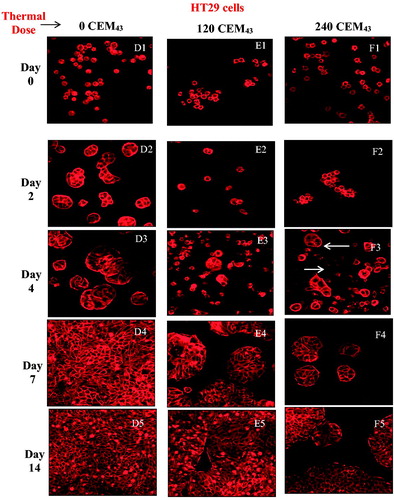
Figure 4. Microscopic visualization of actin microfilament staining of HCT116 cells (A, B and C) and HT29 cells (D, E and F) after ‘slow’ hyperthermic exposures with TIDs of 0 (columns A and D), 120 (columns B and E) and 240 (columns C and F) CEM43 assessed up to 14 days after treatment. Results are presented as representative fluorescent microscopy images of fixed cells stained with phalloidin-TRITC obtained using confocal microscopy at 200 times magnification.
Cell viability after ‘slow’ hyperthermic exposures was assessed one day (n = 4 samples per condition) after treatment () so that the cytotoxic effects of both necrosis and programed cell death [Citation23] could be observed at a time when the proliferation of survivors should be minimal.
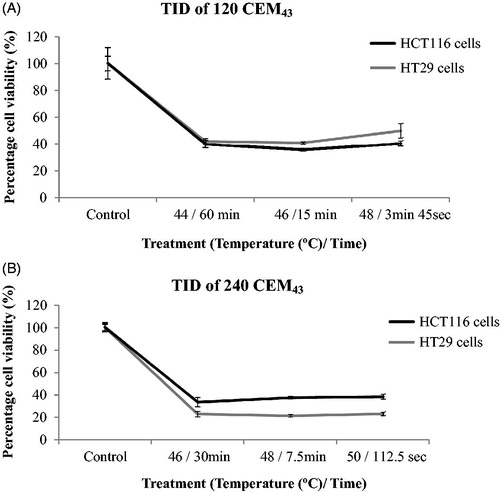
Figure 5. Comparison of cell viability for different ‘slow’ hyperthermic thermal exposure regimes. HCT116 and HT29 cell viability treated with a TID of 120 CEM43 (A) and 240 CEM43 (B) and assessed 1 day after treatment using the combinations of time and temperature shown in each graph. Results are presented as means ± std. dev. (n = 4) of an experiment that has been repeated three times with similar results. The data show that cell viability was independent of the delivery strategy over the range tested.
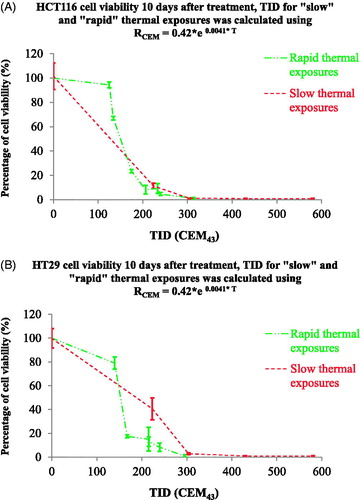
In order to compare the viability of cells after ‘rapid’ ablative (n = 2) and ‘slow’ hyperthermic (n = 2) exposures (), day 10 after treatment was chosen to give adequate time for survivors to attach to the substrate, exhibit clonogenic potential and proliferate enough for a signal to be detected with the MTT assay. Viabilities lower than 3% relative to the controls were defined as undetectable.
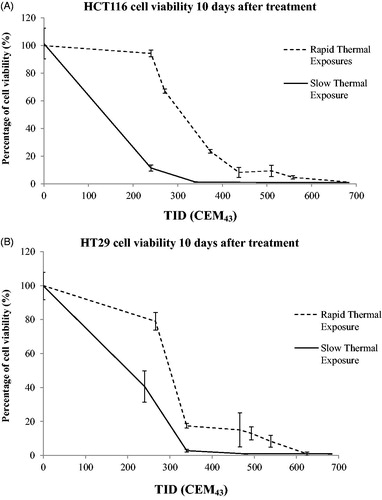
Figure 6. Comparison of cell viability following ‘rapid’ ablative and ‘slow’ hyperthermic thermal exposures. Ten days after treatment, the viability of HCT116 (A) and HT29 (B) cells treated with ‘rapid’ ablative exposures (quantified as minTID) was greater than that for cells treated with ‘slow’ hyperthermic thermal exposures (quantified as average TID). Results are presented as means ± std. dev. of two datasets from a single experiment that has been repeated 3 times with similar results.
Cell visualization: fluorescent microscopy
Confocal fluorescent microscopy was used to visualize thermally treated cells in order to investigate morphological changes induced by heating and to assess the level of cellular adhesion to the substrate and any subsequent proliferation as a function of time. Following treatment, cells were placed on poly-L-lysine coated coverslips in 500 μl of medium and were allowed to attach. At various time points (immediately, and 2, 4, 7 and 14 days after treatment), plated coverslips were submerged in 4% paraformaldehyde for 20 min to fix cells. They were then washed three times with PBS containing calcium and magnesium, and permeabilized for 10 min with 0.1% Triton X-100. Cells were washed three times with PBS, and nonspecific binding sites were blocked with PBS buffer containing 5% semi-skimmed milk. Actin microfilaments were then stained with TRITC-conjugated phalloidin in blocking buffer (1:500 dilution) for 1 h at room temperature. Coverslips were washed five times with PBS, mounted on slides using anti-fade gold (molecular probes) and visualized using a 20× lens (EC Plan-NeoFluar 20x, NA 0.5) on a Carl Zeiss confocal fluorescent microscope (Zeiss LSM700, Germany).
The relationship between TID and Arrhenius coefficients
The activation energy (ΔE) and frequency factor (A) of the ‘slow’ hyperthermic and ‘rapid’ ablative reactions were calculated using a method described in [Citation18]. Briefly assuming a ‘top-hat’ thermal history for both ‘slow’ hyperthermic and ‘rapid’ ablative thermal exposures, the cell injury rate (k) was calculated using:
(Equation 3)
(Equation 3)
where S is the experimentally determined fractional cell survival, k is the cell injury rate (sec−1) and t is the treatment time of cells (sec) at a constant temperature. An Arrhenius plot of Ln (k) versus the inverse of the absolute temperature 1/T (10−3 K−1) was then drawn. The activation energy (ΔE) is a function of the slope of the straight line fit of the data in the Arrhenius plot and the frequency factor can be calculated from its y-intercept using EquationEquation (5)
(Equation 5)
(Equation 5) :
(Equation 4)
(Equation 4)
(Equation 5)
(Equation 5)
where k is the cell injury rate (sec−1), A is the frequency factor (sec−1), ΔE is the activation energy (J mole−1), Rg is the universal gas constant (8.314 J mole−1 K−1), and T is the absolute temperature (K). To convert between the Arrhenius and the TID model, RCEM was calculated:
(Equation 6)
(Equation 6)
where RCEM(T) is the RCEM value at temperature T, T is the absolute temperature (K) [Citation8]. Inserting RCEM(T) into EquationEquation (1)
(Equation 1)
(Equation 1) allows calculation of a temperature-dependent TID for comparison with the standard method of calculation.
Statistical analysis
For the ‘slow’ hyperthermic exposure thermal dose quantification, the 5 repeat datasets were averaged. The results were then averaged for 5 repeats of each exposure to obtain a mean and standard deviation. Where cell viability data for three independent experiments were obtained, results are presented as mean ± SEM. Where 4 replicates of a single experiment are presented they are analyzed as mean ± standard deviation (std. dev.), as are all thermal data. All experiments were performed at least 3 times.
Results
Thermometry
The actual thermal dose delivery for ‘slow’ hyperthermic (PCR) exposures (5 repeats with 5 PCR tubes in 5 block positions using 1 thermocouple per PCR tube) for intended doses of 0, 120, 240, 340, 480, 680 and 720 CEM43 is shown in . The dose delivered is within 12% of that intended. This demonstrates the good reproducibility of the actual thermal dose delivery.
shows examples of the temperature history profiles measured using 5 thermocouples during a ‘rapid’ ablative thermal exposure intended to expose the cells to a thermal dose of 820 CEM43 using a 3 s exposure at an intended peak temperature of 57 °C. shows the total treatment time, maximum recorded temperatures and the total accumulated TID for each thermocouple (TC) location, during ‘rapid’ ablative thermal exposures. These measurements show a wide variation in measured TID throughout the samples. For example, for an intended treatment of 57 °C for 3 s giving a TID of 820 CEM43 the actual measured levels were 540 (tc1), 610 (tc 2), 720 (tc 3), 970 (tc 4) and 1450 CEM43 (tc 5). shows the heating up, steady state and cooling downtime, and the associated TID as determined by the thermocouple located in the bottom of the tube.
Table 3. ‘Rapid’ ablative thermal exposures: the intended thermal dose, total exposure duration (recorded by the lowest placed thermocouple (tc 1), plus peak temperature and local TID calculated from 5 thermocouples are shown.
Table 4. ‘Rapid’ ablative thermal exposures: the duration of, minimum TID accumulated in, and percentage of the total minTID in, each phase (increasing temperature, steady-state temperature, and reducing temperature) of the treatment as recorded by the lowest placed thermocouple (tc 1) for each test.
Viability of cells subjected to ‘slow’ hyperthermic heating regimes
The viability (normalized to the value for controls) of HCT116 and HT29 colon cancer cells exposed to 0, 120, 240, 480 and 720 CEM43, achieved using ‘slow’ hyperthermic exposures, was determined immediately, 1, 2, 4, 7 and 14 days, after treatment in 3 replicated experiments for each dose in order to characterize the longitudinal response of cells to a range of TIDs and to determine when to assess viability and whether survivors retain their proliferative characteristics. MTT assays showed that within 7 days of treatment, exposure of both cell lines to ≥480 CEM43 resulted in undetectable viability (). A TID of 120 CEM43 resulted in a reduction in the viability of HCT116 cells to ∼40% and HT29 cells to ∼22% one day after treatment, with the remaining cells retaining their clonogenic potential and proliferating. 95 ± 2% of HCT116 and HT29 cells treated with a TID of 240 CEM43 were non-viable at 4 and 7 days after treatment, respectively. However, the remaining cells in these two populations also retained their proliferative potential and 14 days after treatment the measured viability of HCT116 cells was 48 ± 21% that of control cells, and for similarly treated HT29 cells was 44 ± 14% ().
Confocal fluorescent microscopy showed that controls of both cell lines, attached to the well plates 2 days after sham treatment. These had attached and spread on the substrate, exhibiting bright microfilament staining and increasing numbers as shown in . Cells from both lines treated with a TID of 120 CEM43, had an abnormally rounded appearance 2 days after treatment () but had attached to the substrate by day 4 (). Cell division was evident 7 and 14 days after treatment (). A population of live, rounded, loosely attached or floating cells was also seen 2 days after treatment following a TID of 240 CEM43 (). After ∼4 days 2 distinct populations were evident. One showed bright actin filament staining and the second was more faintly stained (). In addition, some of the loosely attached and/or floating HCT116 and HT29 cells fully attached to the substrate and proliferated to form colonies ().
Dependence of cell viability on temperature and exposure duration
The validity of TID for ‘slow’ hyperthermic treatments delivered to both cell lines using a variety of temperature/duration conditions to achieve the same intended thermal doses was investigated for TIDs of 120 and 240 CEM43 one day after treatment. This time point accounts for cells that have died both from instantaneous necrosis and by programed cell death signaling pathways and excludes viability from the proliferation of unaffected survivors, as shown in . For the lowest dose, a TID of 123 ± 11 CEM43 was delivered using 44 °C for 60 min, 46 °C for 15 min and 48 °C for 3 min and 45 s. These doses resulted in viabilities (relative to controls) one day after treatment for HCT116 cells of 40 ± 3%, 36 ± 1% and 41 ± 2%, respectively and for HT29 cells of 42 ± 2%, 41 ± 1% and 50 ± 5% respectively. A TID of 242 ± 18 CEM43 was delivered using 46 °C for 30 min, 48 °C for 7.5 min and 50 °C for 112.5 s. This dose resulted in viabilities 1 day after treatment of 34 ± 4%, 38 ± 1% and 38 ± 2% respectively (HCT116) and from 21 to 23 ± 2% (HT29) relative to controls (). These results show that within each thermal dose group and measurement uncertainties the results do not vary, for a given peak temperature/exposure duration combination.
shows a comparison of the effects of ‘slow’ hyperthermic and ‘rapid’ ablative, thermal delivery on cell viability 10 days after treatment (as an indicator of maximum therapeutic response) for intended thermal doses between 240 and 680 CEM43. This time point was chosen in order to provide enough time for the small number of cells that were not killed to recover from the effects of heat and to proliferate sufficiently to give a detectable signal on the MTT assay. Cells treated with a TID of 248 ± 12 CEM43 delivered by heating to 47 °C for 15 min had viabilities of 11 ± 2% (HCT116) and 40 ± 10% (HT29) relative to sham-exposed cells. Treatment of both cell lines with TID of 345 ± 20, 500 ± 21, 700 ± 40 CEM43, using exposures longer than 10 min, resulted in undetectable cell viability after 10 days. Using ‘rapid’ ablative thermal exposures shorter than 10 s duration, with a target temperature of up to 57 °C, resulted in HCT116 cells having minimum TID (defined as that measured at tc1) values, shown in , of 240 (tube 1), 270 (tube 2), 370 (tube 3), 440 (tube 4), 510 (tube 5), 560 (tube 6) and 680 (tube 7) CEM43. These resulted in viabilities relative to control cells 10 days after treatment of 94 ± 2, 67 ± 1, 23 ± 1, 8 ± 4, 9 ± 4, 5 ± 1 and <2 ± 2%, respectively (). HT29 cells with minimum delivered TID () of 270 (tube 1), 340 (tube 2), 470 (tube 3), 490 (tube 4), 540 (tube 5) and 630 (tube 6) CEM43 exhibited viabilities 10 days after treatment of 79 ± 5, 17 ± 1, 15 ± 10, 13 ± 4, 8 ± 3 and <1 ± 1%, respectively, (). These results show that compared to similar thermal doses, ‘slow’ hyperthermic thermal exposures result in greater cytotoxicity than that achieved with ‘rapid’ heating.
Dependence of RCEM on temperature
The cell injury rates caused by the exposure of cells to the ‘slow’ hyperthermic () and ‘rapid’ ablative () treatments were calculated using EquationEquation (3)(Equation 3)
(Equation 3) . HCT116 tubes 1 and 2 and HT29 tube 1 () were excluded from these calculations because a significant percentage of the cells in these tubes were unaffected by the thermal insult and had proliferated by the time of the assessment, 10 days after treatment. HCT116 tube 7 and HT29 tube 6 () were also excluded from these calculations because in these tubes survival was undetectable making the calculation of injury rates using EquationEquation (3)
(Equation 3)
(Equation 3) impossible. shows that ‘rapid’ ablative thermal reactions at 56–57 °C caused injury rates of 0.7 to 1.5 s−1 compared to ‘slow’ hyperthermic treatments in the temperature range of 44–50 °C where these ranged from 2.4 × 10⁻⁴ (44 °C) to 1.3 × 10⁻² s−1 (50 °C). shows an Arrhenius plot of the logarithm of the experimentally-derived injury rates versus the inverse of the absolute temperature. The error bars depict the injury rate uncertainty due to the variation in the experimentally measured cell survival. A straight line fit of the data is possible in the temperature range of 44–57 °C. Using EquationEquation (5)
(Equation 5)
(Equation 5) the activation energy (ΔE) and frequency factor (A) of the thermal insults to the HCT116 and HT29 cells were calculated to be ΔE = 5.78 ± 0.04 × 10⁵ J mole−1 and A = 3.27 ± 11 × 1091 s−1. The variation in ΔE and A has been calculated from Arrhenius plots utilizing the minimum (mean minus standard deviation) and maximum (mean plus standard deviation) experimentally-derived injury rates for each data point. The cell survival S as predicted from the Arrhenius coefficients for each cell line was re-calculated using EquationEquations 3
(Equation 3)
(Equation 3) and Equation4
(Equation 4)
(Equation 4) , and were compared to the experimental cell survival data obtained for the HCT116 and HT29 cell lines. and show that the Arrhenius analysis provides a reasonable prediction of the survival of the 2 cell lines in the temperature range used. Of a total of 20 tests, 14 tests gave predicted and actual cell survival which agreed within 5%, 2 agreed within 10% and 4 within 16%.
Figure 7. Arrhenius plot of both ‘slow’ hyperthermic and ‘rapid’ ablative exposures for HCT116 and HT29 cells (A). The cell injury rate was calculated for both ‘slow’ hyperthermic exposures shown in figure 5 and the ‘rapid’ ablative treatments in figure 6. A comparison of the experimentally detected cell survival to that calculated using the Arrhenius kinetic parameters ΔE and A, and EquationEquations 3(Equation 3)
(Equation 3) and Equation4
(Equation 4)
(Equation 4) (B) is shown.
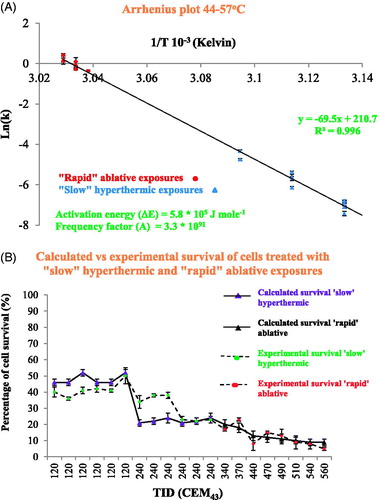
Table 5. Calculation of cell injury rate and comparison of cell survival predicted by the Arrhenius model with that measured experimentally: the temperature and duration (assuming top-hat thermal histories) of ‘slow’ hyperthermic and ‘rapid’ ablative exposures have been used to calculate the cell injury rate.
The activation energy ΔE was used to calculate RCEM (T) using EquationEquation (6)(Equation 6)
(Equation 6) at the temperatures for which viability was assessed ( and x-axis points of ). RCEM was calculated to be equal to 0.502 ± 0.002 at 44 °C, and increased with temperature, rising to 0.530 ± 0.002 at 57 °C. The error in RCEM (T) for each data point was calculated using the minimum and maximum ΔE. shows a plot of RCEM(T) versus temperature with an exponential fit in the temperature range 44–57 °C described by:
(Equation 7)
(Equation 7)
where T is the temperature (°C). In , the cell viability results from (for both ‘slow’ hyperthermic and ‘rapid’ ablative TIDs) re-plotted using RCEM (T), show that viability became undetectable at a temperature-corrected TID of 305 ± 10 CEM43 for both HCT116 and HT29 cells, irrespective of the heating strategy. These results show that Arrhenius analysis can predict the survival of cells with reasonable accuracy and can provide the basis for a more accurate interpretation of the TID equations if a temperature-dependent RCEM is used.
Figure 8. The dependence of RCEM on temperature. RCEM was calculated using EquationEquation (7)(Equation 7)
(Equation 7) and the activation energy values obtained from the Arrhenius plot and plotted as a function of temperature.
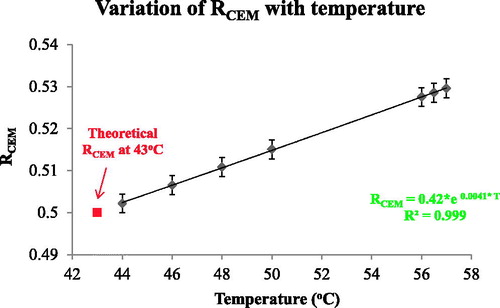
Figure 9. Comparison cell viability following ‘rapid’ ablative and ‘slow’ hyperthermic exposures using a temperature-dependent RCEM to calculate the TID. The results of figure 6 were replotted using a TID calculated with RCEM=0.42 × e0.0041 × T (EquationEquation (7)(Equation 7)
(Equation 7) . Cell viability is undetectable for both heating strategies when TID >305 + 10 CEM43.
Discussion
TID has been used as a parameter to describe the effects of heat in a variety of biological models [Citation23–25]. The TID model does not directly predict the survival of cells after thermal exposure and different TID thresholds for cell and tissue damage have been postulated. These TID thresholds depend on the tissue under investigation (e.g., skin, cornea, tumor, nerves, etc.), the degree of damage (minor, extensive or total) and the method of its assessment (e.g., chronic vs. acute, clonogenic potential vs. membrane disruption vs. metabolic assays vs. histology). Detailed reviews of TID thresholds for a variety of biological damage endpoints can be found elsewhere [Citation24,Citation25] and show the extensive variation of the sensitivity of cells and tissues to thermal insults [Citation26]. However, TID’s simplicity and the ease with which TID can normalize the biological effects of different thermal histories has helped its adoption in the clinic where a TID of 240 CEM43 is widely accepted as the minimum required for ablative thermal treatments [Citation27]. However, this value derives from in-vitro studies using exposure times that are significantly longer, and peak temperature rises that are significantly lower, that are commonly used for tissue ablation. For this reason, the relationship between TID and the biological consequences of the rate of heat delivery has been investigated in HCT116 and HT29 cell lines in this study. These cells represent well-characterized in-vitro models of colon cancer adenocarcinoma with epithelial morphology and doubling times of ∼24 h [Citation28,Citation29]. Unless stated otherwise, TID is calculated using EquationEquation (1)(Equation 1)
(Equation 1) with R = 0.5 for T > 43 °C and R = 0.25 for T < 43 °C.
The PCR thermal cycler used to deliver intended pre-determined thermal dose during ‘slow’ hyperthermic heating gave the required TID to within better than 12% in all cases studied (). shows the timeline over which cells respond to thermal insult before ultimately either recovering or succumbing to death. The viability of both cell lines treated with a TID of 240 CEM43 delivered using ‘slow’ hyperthermic exposures decreases for 2 days after treatment. These cells were abnormally rounded and tended to aggregate in a manner different from that for healthy adherent cells, as shown by confocal microscopy (). also shows that the rate of cytotoxicity slows between day 2 and day 4, when microscopy shows clear evidence of cell attachment, and reduced rounding and aggregation (). In addition, 2 distinct cell populations are seen in both images. One retains its clonogenic potential (as demonstrated by an increase in the number of cells on day 7 and day 14) and shows bright actin filament staining (and increasing size), and the second exhibits fainter actin staining. We hypothesize that this second population of cells are dying (arrowed areas, ). By day 7, cells treated with a TID of 240 CEM43 had a viability of <5% (). Although low in numbers, these cells have clonogenic and proliferative potential as shown microscopically by their observed spread to the surrounding substrate (). The data in and agree with previous observations (briefly described in [Citation30]) that the TID parameter is useful for planning treatments involving these ‘slow’ hyperthermic thermal exposures. However, the data in and demonstrate that longitudinal studies are also important for effective characterization of the cytotoxic effect of thermal dose, and that reliance only on initial effects may not be indicative of longer-term cell viability (compare survival for TIDs of 120 and 240 CEM43 on day 1 and day 14 in ). This choice of cell viability assessment method and identification of relevant time points is important due to the known timelines of different programed mechanisms of cell death [Citation23]. False negative findings, where ‘dormant’ cells which have a transient loss of their adherent and proliferative phenotype are overlooked either because they do not form colonies within the experimental time frame, or because they are removed as part of a floater cell population, must be avoided. Additionally, false positive findings, where viability assessed on the day of treatment (day 0) includes viable cells destined to die through a programed form of cell death at a later time point, should be excluded. In the case of this study, where the MTT assay was used, the data in allowed informed selection of time points that best represent the fate and survival of cells subjected to both high and low TIDs (all delivered as ‘slow’ hyperthermic exposures). For lower TID (120 and 240 CEM43), and show detectable cell viability at later time points (e.g., day 14), and the lower the TID, the higher the number of unaffected cells and the earlier proliferation is seen. For 120 CEM43, increased cell viability was evident between days 1 and 2 for HT29 cells and between days 2 and 4 for HCT116 cells. For 240 CEM43, proliferation is seen between days 7 and 14, for both cell lines. Hence assessing cell viability for low TID exposures (≤240 CEM43) at later time points (i.e., >day 1, for HT29) would provide a misleading indication of viability due to the signal detected from the survivors’ progeny. These cells will increase in number over time. They have had no thermal exposure and their existence will increasingly mask the extent of the therapeutic effect on the initial cell population i.e., the response that will be predicted by any dosimetry model. Thus the earliest time point at which the assessment of the viability of cells treated with 120 and 240 CEM43 could be undertaken in order to minimize false positive and false negative contributions is day 1.
shows that for higher TIDs (>240 CEM43), assessing cell viability at earlier time points (e.g., day 1) would significantly overestimate ultimate cell viability. For example, cells subjected to 480 and 720 CEM43 when assessed on day 1 show ∼20% cell viability but undetectable levels from day 7 onwards (for both cell lines). Where cell viability became undetectable after 10 days, it remained undetectable at later time points (e.g., day 14). Thus shows that, for higher TIDs, cell viability is adequately assessed using any time point between day 7 and 14. In this study, day 10 was chosen. These dose-dependent times of assessment response obtained from ‘slow’ hyperthermic exposures were applied to ‘rapid’ ablated exposures because the same cell death mechanisms were expected to occur in both heating regimes. This assumption was not contradicted by any of the experimental findings in this study. For any cell line in vitro with unknown thermal sensitivity, a longitudinal assessment of cell survival, as undertaken in this study, can be performed in order to identify the correct time points at which to assess the response of cells to heat treatments. For clinical applications in which such longitudinal assessment of the tissue type under investigation may not be possible, quantification of the thermal dose should be based on a ‘worst-case’ parameter value from the available literature in order to stand the best chance of achieving the >99% cell kill typically required for cancer therapy.
In assessing the effect of a given TID on a cell population, the ideal situation would be that all cells are subjected to a uniform temperature, that is raised from, and returned to, baseline instantaneously, for a precisely know length of time (a ‘top hat’ distribution). This is not realizable in practice for ‘rapid’ ablative exposures which require higher temperature and shorter duration. For these, it is important to minimize the inhomogeneity in thermal dose, which is often due to heat conduction throughout volumes either from external sources (e.g., water baths) or convecting from internal sources (e.g., different temperature solutions being mixed). Fundamentally, this requires the contribution to the TID from the periods of temperature rise and fall to be minimized and the contribution from constant temperature heating to be maximized. In the present study, these challenges were addressed by pre-heating a relatively large volume of the medium into which a much smaller aliquot of cells in a cooler suspension was added, with the aim of maximizing the rate of rise to the target temperature. In addition, at the end of heating, the bottom of the tube containing the cells was immediately placed on dry ice. The relative success of the chosen technique is demonstrated in . Whilst the majority of thermal dose was delivered at a constant temperature (58–76%, with a potential ‘outlier’ of 42%), significant dose was still accumulated during heating (22–34%, with potential ‘outliers’ of 14% and 43%), and with a small, but not negligible, dose arising during cooling (6–22%, with an outlier of 36%).
Where volumes of liquid are heated to high temperatures for short periods of time, such as in this ‘rapid’ ablative heating study, temperature homogeneity is unlikely to be achieved throughout the sample. For example, the smallest TID difference that was measured between the bottom of the sample (∼540 CEM43) and the top (∼1450 CEM43) thermocouple during one of the ‘rapid’ ablative thermal exposures () demonstrates the difficulty in relating an average TID to the thermal treatment outcome. The largest difference (490–193 000 CEM43) further demonstrates the potential scale for non-uniform dosing throughout the medium volume. Furthermore, whilst the thermocouples recorded temperature at fixed positions from which thermal dose could be calculated, it is important to acknowledge that the injected cell medium moves as illustrated in Appendix A. As a result, cells will be subjected to a wide range of TID which should lie between the minimum and maximum measurements shown in . However, it is impossible to know the temperature history of any individual cell or the distribution of doses experienced by the cell population. For these reasons an alternative approach to quantifying dose is necessary. If the experimental procedures detailed in this study are performed under carefully controlled conditions, as described above, a temperature gradient with the lowest temperature in the bottom of the tube and the highest temperature at the top is created, as would be expected when cold liquid is introduced into the bottom of a volume of warmer liquid. Measurement of the temperature at the bottom of the tube throughout exposure (as shown in ) allows estimation of the lowest temperature, and therefore the minimum thermal dose (minTID) that could be experienced by any cell in the treatment volume. The advantage of this approach is that it is reasonable to assume that the cells exposed to the least dose would have the greatest chance of surviving and therefore of being detected in viability assays.
Using this approach, the cytotoxicity observed when a minTID >340 CEM43 was achieved using ‘rapid’ ablative exposures was lower than that seen using the same average TID for ‘slow’ hyperthermic exposures, as shown in . This is an unexpected result because a significant number of cells would have experienced significantly higher thermal doses during ‘rapid’ ablative exposure, which according to could be from 1940 to 193 000 CEM43. The viability of cells treated with ‘rapid’ ablative thermal exposures became undetectable for minTID between 540 and 620 CEM43 for HT29 and 560 and 680 CEM43 for HCT116. For ‘slow’ hyperthermic exposures undetectable survival was achieved with average thermal doses between 240 and 340 CEM43. This result suggests that a TID target in clinical applications of thermal ablation in cancer therapy of 650 CEM43 may offer better efficacy for exposures delivered over a time shorter than 10 s. The mathematical dependence of the TID parameter on temperature suggests that only a small change in target temperature is necessary to achieve this target for ‘rapid’ ablative thermal exposures. For example, and assuming a top hat temperature elevation, a 3 s exposure at 55.2 °C would provide ∼235 CEM43. To achieve 650 CEM43, the target temperature has to be elevated by only 1.5 °C–56.7 °C.
Arrhenius analysis and the damage index have also been used to describe thermal insults to tissue [Citation19]. The TID and Arrhenius models share similar physical principles. The advantage of the Arrhenius approach is that cell survival can be predicted directly, but in some cases, the mathematical description of the equations underestimates the cell’s thermal resilience at low temperatures [Citation31]. In this study, it has been shown that Arrhenius equations can be used to predict cell survival after exposure of cells to ‘slow’ hyperthermic and ‘rapid’ ablative treatments in the range of 44–57 °C with reasonable accuracy associated with an error that does not exceed 16% survival ( ). The results for both cell lines were combined in order to generalize the results from this study within the bounds of the available cell models. Thus the coefficient values (ΔE and A) obtained from are applicable to the description of the survival of both cell lines. In addition, the Arrhenius activation energy ΔE, as extracted from the measurement of the experimental cell survival (and hence injury rates) can be used to calculate a temperature-dependent RCEM () that offers a more accurate prediction of cell survival at high magnitude thermal insults, irrespective of the heating strategy employed () and shows that viability is undetectable if cells are exposed to a TID of 305 ± 10 CEM43, irrespective of the heating strategy.
The results presented in this study show that, for the two cell lines studied RCEM increases with temperature according to EquationEquation (7)(Equation 7)
(Equation 7) . At high temperatures, such as those encountered in ‘rapid’ ablative treatments, even a small change in R will have a significant effect on the calculation of TID. For example, using the widely accepted value of RCEM=0.5, EquationEquation (1)
(Equation 1)
(Equation 1) , with a temperature of 57 °C held for 2 s, (assuming a top hat temperature distribution) gives an estimated minTID of 550 CEM43 (close to the highest minTID at which viability above 3% was detected for either cell line as shown in ), adjusting RCEM by 0.03 (calculated using EquationEquation (7)
(Equation 7)
(Equation 7) and shown in ) equates to an R-corrected minTID of 240 CEM43 (). This is lower than the average TID of 350 CEM43 () (or TID of 305 CEM43 if a temperature-dependent RCEM of 0.51 (EquationEquation (7)
(Equation 7)
(Equation 7) is used instead ()) that produces undetectable cell viability () during ‘slow’ hyperthermic exposures. It is also lower than the minTID of 630 CEM43 () (or TID of 300 CEM43 if a temperature-dependent RCEM of 0.53 (EquationEquation (7)
(Equation 7)
(Equation 7) is used instead ()) that produces complete cell kill () during ‘rapid’ ablative exposures. Thus the difference in survival of cells during the ‘rapid’ exposure may not be an unexpected result and using a temperature-dependent RCEM, as shown here, can improve the normalization of different thermal histories using the TID model. Although EquationEquations 6
(Equation 6)
(Equation 6) and Equation7
(Equation 7)
(Equation 7) extend the original TID model to provide a continuously varying temperature-dependent RCEM, instead of 2 temperature-stepped values (0.25 and 0.5), they remain simple equations that attempt to describe very complex physical and biological functions [Citation32–35] which collectively underlie the response of cells to thermal insults and ultimately determine whether they live or die. These considerations underline the usefulness of a simplified TID model with well-characterized parameters (such as a temperature-dependent RCEM) for prediction.
In comparing the use of the TID and Arrhenius analysis in predicting the biological effects of thermal treatments, there needs to be a note of caution, since different injury models may have different sensitivities to the thermal insult, making extrapolation of TID values inaccurate. Additional mechanisms may be in play which may result in non-linear responses, such as the dependence of cell killing on the rate of temperature rise. For example, elegant experiments undertaken by Dewhirst and colleagues have shown that for the same thermal dose, and using heating rates between 0.1 and 1 °C/min, rapid heating is more effective at causing vascular stasis than slower heating [Citation36]. In in-vitro experiments, Herman et al. [Citation37] have shown that if temperatures in the hyperthermia range up to 42.4 °C are used then slow heating rates are associated with increased survival of Chinese hamster ovary cells. More recently, Goldberg and colleagues showed that the Arrhenius damage integral may be dependent on the rate of heat transfer [Citation5]. Our study used relatively high heating rates for both ‘slow’ hyperthermic (3 °Cs−1) and ‘rapid’ ablative exposures (10 °Cs−1), and as such we cannot draw firm conclusions about the effect of heating rate on cell survival.
In summary, the data in this paper contribute to an improved understanding of the applicability of the TID and Arrhenius models to cancer cells heated in vitro and have a potential impact on attempts to standardize a dosimetric parameter for ‘rapid’ ablative heating. It has been demonstrated that:
Cells can withstand an average TID of 240 CEM43, delivered using a ‘slow’ hyperthermic (15 min, 47 °C) treatment, remaining in a loosely-adherent state for several days, while retaining their proliferative potential.
Spatially-averaged TID provides a reasonable predictor of cell viability for thermal exposures given using ‘slow’ hyperthermic treatments.
Although the range of delivered ‘rapid’ ablative doses within each sample volume can differ by several orders of magnitude, the minimum dose (minTID) has proved to be a useful concept to link with cell survival.
The standard TID equation is not adequate to normalize the biological effect of cells subjected to ablative thermal exposures >340 CEM43 unless a temperature-dependent RCEM as described here is used.
Using a temperature-dependent RCEM, undetectable cell viability is observed when cells are treated with a TID above 305 ± 10 CEM43, irrespective of the heating strategy.
Supplemental Material
Download MP4 Video (1.2 MB)Supplemental Material
Download MP4 Video (1.8 MB)Supplemental Material
Download PDF (383.6 KB)Supplemental Material
Download PDF (315.2 KB)Disclosure statement
No potential conflict of interest was reported by the authors.
References
- Lynn JG, Zwemer RL, Chick AJ, et al. A new method for the generation and use of focused ultrasound in experimental biology. J Gen Physiol. 1942;26:179–193.
- ter Haar G. Therapeutic applications of ultrasound. Prog Biophys Mol Biol. 2007;93:111–129.
- Shaw A, ter Haar G, Haller J, et al. Towards a dosimetric framework for therapeutic ultrasound. Int J Hyperthermia. 2015;31:182–192.
- Van Rhoon GC, Samaras T, Yarmolenko PS, et al. CEM43 C thermal dose thresholds: a potential guide for magnetic resonance radiofrequency exposure levels?. Eur Radiol. 2013;23:2215–2227.
- Mertyna P, Goldberg W, Yang W, et al. Thermal ablation a comparison of thermal dose required for radiofrequency-, microwave-, and laser-induced coagulation in an ex vivo bovine liver model. Acad Radiol. 2009;16:1539–1548.
- Thompson SM, Callstrom MR, Butters KA, et al. Heat stress induced cell death mechanisms in hepatocytes and hepatocellular carcinoma: in vitro and in vivo study. Lasers Surg Med. 2014;46:290–301.
- Dewey WC, Hopwood LE, Sapareto SA, et al. Cellular responses to combinations of hyperthermia and radiation. Radiology. 1977;123:463–474.
- Sapareto S, Dewey W. Thermal dose determination in cancer therapy. Int J Radiat Oncol Biol Phys. 1984;10:787–800.
- Hahn GM, Ning SC, Elizaga M, et al. A comparison of thermal responses of human and rodent cells. Int J Radiat Biol. 1989;56:817–825.
- Roizin-Towle L, Pirro JP, McDowell J. A comparison of the heat and radiation sensitivity of rodent and human derived cells cultured in vitro. Int J Radiat Oncol Biol Phys. 1986;12:647–653.
- Brüningk SC, Ijaz J, Rivens I, et al. A comprehensive model for heat-induced radio-sensitisation. Int J Hyperthermia. 2017;5:1–11.
- Roti Roti JL. Cellular responses to hyperthermia (40-46 degrees C): cell killing and molecular events. Int J Hyperthermia. 2008;24:3–15.
- Hazle JD, Diederich CJ, Kangasniemi M, et al. MRI-guided thermal therapy of transplanted tumors in the canine prostate using a directional transurethral ultrasound applicator. J Magn Reson Imaging. 2002;15:409–417.
- McDannold N, Tempany CM, Fennessy FM, et al. Uterine leiomyomas: MR imaging-based thermometry and thermal dosimetry during focused ultrasound thermal ablation. Radiology. 2006;240:263–272.
- Borrelli MJ, Thompson LL, Cain CA, et al. Time-temperature analysis of cell killing of BHK cells heated at temperatures in the range of 43.5 degrees C to 57.0 degrees C. Int J Radiat Oncol Biol Phys. 1990;19:389–399.
- Dewey WC. Arrhenius relationships from the molecule and cell to the clinic. Int J Hyperthermia. 1994;10:457–483.
- Walsh LP, Anderson JK, Baker MR, et al. In vitro assessment of the efficacy of thermal therapy in human renal cell carcinoma. Urology. 2007;70:380–384.
- He X, Bhowmick S, Bischof JC. Thermal therapy in urologic systems: a comparison of arrhenius and thermal isoeffective dose models in predicting hyperthermic injury. J Biomech Eng. 2009;131:074507–07450712.
- Viglianti BL, Dewhirst MW, Abraham JP, et al. Rationalization of thermal injury quantification methods: application to skin burns. Burns. 2014;40:896–902.
- Moritz AR, Henriques FC. Studies of thermal injury: II. The relative importance of time and surface temperature in the causation of cutaneous burns. Am J Pathol. 1947;23:695–720.
- Henriques FC. Studies of thermal injury; the predictability and the significance of thermally induced rate processes leading to irreversible epidermal injury. Arch Pathol (Chic). 1947;43:489–502.
- Reddy G, Dreher MR, Rossmann C, et al. Cytotoxicity of hepatocellular carcinoma cells to hyperthermic and ablative temperature exposures: in vitro studies and mathematical modelling. Int J Hyperthermia. 2013;29:318–323.
- Mouratidis P, Rivens I, ter Haar G. A study of thermal dose-induced autophagy, apoptosis and necroptosis in colon cancer cells. Int J Hyperthermia. 2015;14:1–13.
- Yarmolenko PS, Moon EJ, Landon C, et al. Thresholds for thermal damage to normal tissues: an update. Int J Hyperthermia. 2011;27:320–343.
- Dewhirst MW, Viglianti BL, Lora-Michiels M, et al. Basic principles of thermal dosimetry and thermal thresholds for tissue damage from hyperthermia. Int J Hyperthermia. 2003;19:267–294.
- Dewhirst MW, Abraham J, Viglianti B. Evolution of thermal dosimetry for application of hyperthermia to treat cancer. Adv Heat Transfer. 2015;47:397–421.
- Sapareto SA. Thermal isoeffect dose: addressing the problem of thermotolerance. Int J Hyperthermia. 1987;3:297–305.
- Brattain MG, Levine AE, Chakrabarty S, et al. Heterogeneity of human colon carcinoma. Cancer Metastasis Rev. 1984;3:177–191.
- Von Kleist S, Chany E, Burtin P, et al. Immunohistology of the antigenic pattern of a continuous cell line from a human colon tumor. J Natl Cancer Inst. 1975;55:555–560.
- Dewey WC, Diederich CJ, Dewhirst MW. Hyperthermia classic commentary: 'Arrhenius relationships from the molecule and cell to the clinic' by William Dewey, Int. J. Hyperthermia, 10:457-483, 1994. Int J Hyperthermia. 2009;25:21–24.
- Pearce JA. Comparative analysis of mathematical models of cell death and thermal damage processes. Int J Hyperthermia. 2013;29:262–280.
- Rosenberg B, Kemeny G, Switzer RC, et al. Quantitative evidence for protein denaturation as the cause of thermal death. Nature. 1971;232:471–473.
- Eyring H. The activated complex in chemical reactions. J Chem Phys. 1935;3:107.
- Yelon A, Movaghar B. Microscopic explanation of the compensation (Meyer-Neldel) rule. Phys Rev Lett. 1990;65:618–620.
- Qin Z, Balasubramanian SK, Wolkers WF, et al. Correlated parameter fit of Arrhenius model for thermal denaturation of proteins and cells. Ann Biomed Eng. 2014;42:2392–2404.
- Dewhirst M, Gross JF, Sim D, et al. The effect of rate of heating or cooling prior to heating on tumor and normal tissue microcirculatory blood flow. Biorheology. 1984;21:539–558.
- Herman TS, Gerner EW, Magun BE, et al. Rate of heating as a determinant of hyperthermic cytotoxicity. Cancer Res. 1981;41:3519–3523.