
Abstract
Background: Hyperthermia has proved successful in treating cutaneous human papillomavirus infectious diseases such as plantar wart and condyloma acuminata (CA). Moreover, this treatment provides improved therapeutic efficacy in these conditions as compared with conventional therapies.
Objectives: To investigate the global proteome changes in CA in response to hyperthermia and achieve a better understanding of the mechanisms of hyperthermia therapy against HPV-infectious diseases.
Methods: CA tissue was obtained from patients undergoing pathological examinations. Diagnosis was verified as based on results of both HE staining and HPV-DNA PCR assay. Hyperthermia was achieved with a 44 °C water bath. Differentially expressed proteins (DEPs) were identified by iTRAQ labeling, SCX chromatography and LC-MS/MS assay. Validation of proteomic results was performed using real-time qPCR and western blot, while bioinformatic analysis of DEPs was accomplished by R 3.4.1, STRING and Cytoscape softwares.
Results: In response to hyperthermia, a total of 102 DEPs were identified with 37 being upregulated and 65 downregulated. Among these DEPs, hyperthermia induced proteins involved with anti-viral processes such as OAS1, MX1, BANF1, CANX and AP1S1, whereas it inhibited proteins that participated in cellular metabolism, such as GALT, H6PD, EXOSC4 and EXOSC6; protein translation, such as RPS4Y1; as well as keratinocyte differentiation, such as KRT5, KRT27, KRT75, KRT76 and H2AFY2.
Conclusions: Hyperthermia inhibited enzymes and molecules responsible for metabolism modulation and keratinocyte differentiation in CA tissue, whereas it promoted factors involved in anti-viral responses. Such effects may, in part, contribute to the efficacy of local hyperthermia therapy against HPV infection.
Introduction
Condyloma acuminatum (CA) is a common, sexually-transmitted disease observed worldwide that develops from human papillomavirus (HPV) infection. Among all HPV subtypes, CA is primarily the result of either a HPV 6/11 (low-risk types) or HPV 16/18 (high-risk types) infection [Citation1]. CA patients are typically treated with physical therapies such as CO2 laser ablation and cryotherapy, however, recurrence is oftentimes observed due to failures in eliminating invisible HPV-infected loci [Citation2]. Although 5-aminolaevulinic acid photodynamic therapy (ALA-PDT) is effective in treating latent HPV infection and reducing recurrence of CA [Citation2], the relatively high medical expenses and pain associated with this therapy limits its application, especially in patients with massive lesions. Therefore, there exists a clear need for the development of more effective and economic therapeutic methods.
Local hyperthermia has been widely used as an adjunctive therapy in the treatment of various cancers including cervical [Citation3], melanoma [Citation4], breast [Citation5] and bladder [Citation6] cancers. Within our clinic, we have also applied local hyperthermia as a means for treatment of several cutaneous human papillomavirus (HPV) infectious diseases such as plantar wart [Citation7] and CA [Citation8]. This has proved a valuable approach as indicated by improved therapeutic efficacies and reductions in recurrence rates as compared to conventional therapies [Citation9]. Preliminary results from our, as well as other, laboratories have revealed that the therapeutic effects of local hyperthermia in treating cancers and HPV-infectious diseases were, in part, due to its immune-stimulating actions resulting in enhanced antigen presentation [Citation10] and/or the induction of immune-active molecules [Citation11]. However, much of the underlying mechanisms of local hyperthermia therapy, especially in treatment against HPV infection, remains unknown and requires further investigation.
Isobaric tags for relative and absolute quantitation (iTRAQ) is a quantitative proteomics technology which uses covalently-bonded isotope labeled molecules to detect the simultaneous expressions of global proteins in up to 8 samples [Citation12,Citation13]. As a powerful proteomic detection tool, iTRAQ technology possesses a high degree of quantification accuracy and reproducibility [Citation14,Citation15] and thus is extensively implemented in proteomic comparisons among different samples or treatments. Therefore, as an approach to achieve an overview of protein alterations during local hyperthermia therapy, we applied iTRAQ technology to evaluate protein expression changes at the proteomic level as resulting from ex-vivo hyperthermia treatment in CA tissue.
To our knowledge, this is the first proteomic detection of differentially expressed proteins in CA tissues in response to hyperthermia. The resultant bioinformatics analyses of DEPs offer considerable instructive information about the underlying mechanisms for the therapeutic effects of local hyperthermia. Such insights not only provide the foundation for the design of subsequent studies, but will enable an improved efficacy in the use of local hyperthermia therapy.
Materials and methods
Cell culture
HaCaT and CaSki cells were purchased from GeneChem (Shanghai, China) and cultured in a cell incubator at 37 °C, 5% CO2, in Dulbecco’s Modified Eagle Medium (HaCaT cells; Biological Industries, Israel) and RPMI 1640 medium (CaSki cells, Biological Industries, Israel) containing 10% fetal bovine serum and 1% penicillin and streptomycin (Biological Industries, Israel). Cells were subcultured using 0.25% trypsin with 0.02% EDTA (Biological Industries, Israel) and seeded for further experiments when cells achieved a confluence of 70–80%.
Tissue and pathological diagnosis
Fresh CA tissue was obtained from patients that underwent pathological examinations at The First Hospital of China Medical University. All CA tissue samples were dissected into quadrants and assigned to one of the following four conditions: HE staining (1), DNA extraction (1) and hyperthermia treatment (2). For HE staining and pathological diagnosis, CA tissues were first fixed in 4% paraformaldehyde for over 24 h at room temperature followed by sequential dehydration through a series of ethanol gradients and then embedded in paraffin wax. Embedded tissues were sectioned (6 μm thickness) with a microtome and then stained with hematoxylin and eosin (Solarbio, China). After staining, the slices were covered with a coverslip, mounted with one drop of neutral resin (Solarbio, China) and then forwarded to a pathologist for microscopy inspection.
DNA extraction and PCR assay
Cell cultures were digested with use of 0.25% trypsin (Biological Industries, Israel), washed 3 times with PBS and collected following centrifugation (800 g for 5 min). CA tissue was ground into a fine powder in liquid nitrogen. DNA was then extracted from each sample with the use of Dneasy Blood & Tissue Kit (Qiagen, Germany) following the manufacturers’ instructions. Extracted DNA samples were then subjected to PCR assay with use of a Veriti 96 Well Thermal Cycler (Applied Biosystems, USA). The primers used for HPV DNA amplification were as follows:
FAP59/64 sense - 5'-TAACWGTIGGICAYCCWTATT-3'
FAP59/64 antisense - 5'-CCWATATCWVHCATITCICCATC-3'
GP5+/6+ sense - 5′-TTTGTTACTGTGGTAGATACTAC-3′
GP5+/6+ antisense - 5′-GAAAAATAAACTGTAAATCATATTC-3′
Each PCR reaction mixture contained 12.5 μl of GoTaq Colorless Master Mix (Promega, USA), 2 μl of DNA sample, 1 μl of each primer and 8.5μl nuclease-free water to achieve a final volume of 25 μl. The PCR reaction condition was set to 94 °C for 10 min, followed by 45 cycles of 94 °C for 1.5 min, 50 °C for 1.5 min and 72 °C for 1.5 min. The reaction was then terminated at 72 °C for 10 min.
After PCR amplification, all samples were subjected to an agarose gel electrophoresis assay. The agarose gel was prepared with the use of 0.5 g agarose gel powder (Sigma Aldrich, USA), 50 ml of 1% TBE buffer (Solarbio, China) and 5 μl of type I nucleic acid dye (Solarbio, China). Samples (10 μl) were loaded onto the agarose gel and separated at 100 V for 30 min at room temperature. After electrophoresis, the gel was exposed under UV light in a MF-ChemiBIS 2.0 Bio-Imaging Systems (DNR, Israel).
Hyperthermia treatment
Two of the dissected CA tissue samples from each patient were separately immersed in RPMI 1640 medium within 60 mm Petri dishes and assigned to either the hyperthermia or control group. All hyperthermia group dishes were carefully wrapped with parafilm and subjected to a 44 ± 0.1 °C water bath (Thermo Fisher Scientific, USA) for 30 min, whereas control group dishes were treated likewise in a 37 °C water bath (Thermo Fisher Scientific, USA). After hyperthermia treatment, all the dishes were returned to the 37 °C incubator for a 6 h recovery before protein extraction or a 2 h recovery before mRNA extraction.
Protein extraction and isobaric labeling
CA tissue samples from each group were ground into a fine powder in liquid nitrogen, and then mixed with 5 times volume of TCA/acetone (1:9) by vortexing, maintained at −20 °C for over 4 h, washed 3 times with pre-cooled acetone and desiccated in a fume hood. Dried tissue powder (30 mg) was suspended in 30 times volume of SDT buffer (4% SDS, 100 mM Tris-HCl, 1 mM DTT, pH7.6). The suspension was then vortexed, sonicated and heated in a boiling bath for 5 min. After centrifugation at 14,000 g for 40 min, the supernatant was collected, filtered with use of a 0.22 μm microfiltration membrane (PALL, USA) and quantified using the BCA method (P0012, Beyotime, China). FASP digestion was performed using 4 μg Trypsin per 200 μg protein and peptide quantification was performed according to Wisniewski, et al. [Citation16]. Each peptide sample (100 μg) was labeled with use of the iTRAQ Reagent – 8plex Multiplex Kit (AB SCIEX) following protocols supplied. Six CA samples were labeled with iTRAQ tags 113, 114 or 115 for control patients 1, 2 and 3, and 116, 117 or 118 for hyperthermia patients 1, 2 and 3, respectively. The 6 labeled samples were then pooled for further experiments.
SCX chromatography
SCX chromatography was performed with the help of Shanghai Applied Protein Technology. Briefly, labeled peptides were fractionated by SCX chromatography using the AKTA Purifier system (GE Healthcare). The dried peptide mixture was reconstituted, acidified with buffer A (10 mM KH2PO4 in 25% of ACN, pH 3.0) and loaded onto a PolySULFOETHYL 4.6 × 100 mm column (5 µm, 200 Å, PolyLC Inc, Maryland, USA). The peptides were eluted at a flow rate of 1 ml/min with a gradient of 0–8% buffer B (500 mM KCl, 10 mM KH2PO4 in 25% of ACN, pH 3.0) for 22 min, 8–52% buffer B during min 22–47, 52–100% buffer B during min 47–50, 100% buffer B during min 50–58, and buffer B was then reset to 0% after 58 min. The elution was monitored by absorbance at 214 nm and fractions were collected every 1 min. A total number of 10 fractions were collected, desalted on C18 Cartridges (Empore™ SPE Cartridges C18 (standard density), bed I.D. 7 mm, volume 3 ml, Sigma) and concentrated by vacuum centrifugation.
LC-MS/MS and protein identification
Mass spectrometry was performed with the help of Shanghai Applied Protein Technology. In brief, fractionated samples were separated with use of a nano HPLC system Easy nLC (Thermo Fisher Scientific, USA), and then subjected to a Q Exactive mass spectrometer (Thermo Fisher Scientific, USA) that was operated in a positive ion mode. MS parameters were set as follows:
Survey scan range – 300–1800 m/z for HCD fragmentation
Automatic gain control (AGC) target – 3e6
Maximum inject time – 10 ms
Dynamic exclusion duration – 40.0 s
Survey scans resolution – 70,000 at 200,m/z
Hcd spectra resolution – 17,500 at 200 m/z
Isolation width – 2 m/z
Normalized collision energy – 30 ev
Underfill ration – 0.1%
For protein identification, Q Exactive raw data were processed with the use of Proteome Discoverer 1.4 software (Thermo Fisher Scientific, USA) and searched against the UniProt HomoSapiens protein database downloaded from http://www.uniprot.org (Uniprot_HomoSapiens_154578_20160822.fasta) using Mascot 2.2 (Matrix Science, UK). Search parameters were set as follows:
Digestion enzyme – Trypsin
Max missed cleavages – 2
Fixed modifications – Carbamidomethyl (C), itraq 8plex (N-term and K)
Variable modifications – Oxidation (M), itraq 8plex (Y)
Peptide mass tolerance – ±20 ppm
Fragment mass tolerance – 0.1 Da
Protein mass – Unrestricted
Database pattern – Decoy
Peptide FDR – ≤0.01
Protein quantification– Protein ratios were calculated as the median of only unique peptides of the protein
Experimental bias – Normalizes all peptide ratios by the median protein ratio.
Only proteins that were identified in all 6 samples were selected. The expression changes of identified proteins were calculated by dividing the iTRAQ reporter intensities of hyperthermia groups by that of control groups. Differentially Expressed Proteins (DEPs) were recognized when they met a criteria of 1.2-fold change (>1.2 or <0.833) and an associated paired t-test p values < .05.
Bioinformatics analysis
Annotation of identified proteins and gene ID conversion were performed using the org.Hs.eg.db package (Rstudio based on R3.4.1, Boston, MA). Differentially Expressed Proteins (DEPs) were categorized by k-means clustering and hierarchical clustering using the cluster package (Rstudio based on R3.4.1, Boston, MA). The optimal cluster number was determined using gap statistics and clustering results were visualized with the use of the pheatmap package (Rstudio based on R3.4.1, Boston, MA). For functional analyses of DEPs, Gene ontology (GO) enrichment and Kyoto Encyclopedia of Genes and Genomes (KEGG) pathway enrichment analysis were performed with use of the clusterProfiler package (Rstudio based on R3.4.1, Boston, MA) according to Yu et al. [Citation17]. The enrichment score was calculated from the p values of enrichment analysis (−log10(p values) × 10). The protein-protein interaction (PPI) network was constructed with use of the Search Tool for the Retrieval of Interacting Genes/Proteins (STRING, http://www.string-db.org/). Interaction modules and hub-proteins were analyzed with use of MCODE and CentiScaPe plugins in Cytoscape 3.5.1 with default parameters. Modules with a MCODE score greater than 2 were selected for further analysis. Proteins with a centrality score greater than the threshold value of 2.7755 were considered as hub-proteins.
Real-time quantitative PCR assay
Three fresh CA tissue samples were collected, bisected, assigned to either the hyperthermia or control group and subjected to the experimental conditions as described above. The mRNA of each sample was extracted with use of the miRNeasy Mini Kit (Qiagen, Germany) according to the protocols supplied and quantified with use of a ND1000 nanometer. The mRNA (1 μg) was then utilized as templates for synthesis of complementary DNA (cDNA) with use of the GoScriptTM Reverse Transcription System (Promega, USA) following the manufacturers’ instructions.
Primer sequences for OAS1 (sense 5′-ACTACCAGCAACTCTGCATCTA-3′, antisense 5′-CTCCACCACCCAAGTTTCCT-3′), MX1 (sense 5′-CCTCGTGTTCCACCTGAAGA-3′, antisense 5′-CTCCAGCAGATCCCTGAAATATG-3′), AP1S1 (sense 5′-TGTGCGAGCTGGACATCAT-3′, antisense 5′-CATCCTCCTCTTGCAGTAGGT-3′), BANF1 (sense 5′-GCTGGGATTGGTGAAGTCCT-3′, antisense 5′-ACAAGTGTCTTTCAGCCATTCC-3′), CANX (sense 5′-CTGGTTATCCTCTTCTGCTGTTC-3′, antisense 5′-CTTCTCCTTCCTCCTCCTCATC-3′), EXOSC4 (sense 5′-AAGCAGCCATCCTCACACA-3′, antisense 5′-CACAAAGTCTCTCATGGGTATCC-3′), GALT (sense 5′-TCATGGTTGGCTACGAAATGC-3′, antisense 5′-GTTGCTGTCTCCCTGTCCTT-3′), KRT5 (sense 5′-AGATCGCCACTTACCGCAA-3′, antisense 5′-GCCATATCCAGAGGAAACACTG-3′), EXOSC6 (sense 5′-AGATGTACGACCTGGTGGTG-3′, antisense 5′-CTGATTCAGCACAGGCATGAG-3′), KRT76 (sense 5′-AAGGCTAAGGATGACCTGGC-3′, antisense 5′-CACACGGCACTCTGACATTC-3′) and GAPDH (sense 5′-AAGAGCACAAGAGGAAGAGAGAGAC-3′, antisense 5′-GTCTACATGGCAACTGTGAGGAG-3′) were designed using PrimerPrimier 6.0 software (Palo Alto, CA) and BLAST against the NCBI database.
The mRNA expression levels were quantified by the 7900HT Fast Real-Time PCR System (Applied Biosystems, USA) with use of RT2 SYBR Green qPCR Mastermix (Promega, USA) following the protocol supplied. GAPDH was used as an endogenous loading control.
Protein extraction and Western blotting
Four fresh CA samples were collected, bisected and subjected to similar hyperthermia treatment as indicated above, and then recovered for 6 h at 37 °C, washed briefly with ice-cold PBS and grounded into a fine powder in liquid nitrogen. Each tissue powder was lysed using 300 μl RIPA buffer (Beyotime, China) premixed with PMSF (Beyotime, China), protease inhibitor cocktail (Roche, Switzerland) and phosphatase inhibitor (Roche, Switzerland) according to the manufacturer’s protocols. After centrifugation at 4 °C × 15,000 g for 10 min, the supernatants were collected and quantified with use of the BCA protein assay kit (Beyotime, China).
For western blot assay, 20 μg of each sample protein was loaded with SDS buffer (Beyotime, China) and denatured at 95 °C for 10 min in a metal bath. Primary antibodies used in western blotting were rabbit anti-human GALT (ab178406, Abcam, UK), keratin-5 (#25807, Cell Signaling Technology, USA), Calnexin (#2679, Cell Signaling Technology, USA), MX1 (#37849, Cell Signaling Technology, USA), GAPDH (ab181602, Abcam, UK) monoclonal antibodies and mouse anti-human keratin-76 monoclonal antibody (ab16111, Abcam, UK). The secondary antibodies were HRP-conjugated goat anti-rabbit and anti-mouse IgG polyclonal antibody (ZB-2301 and ZB-2305, ZSGB-BIO, China). Antibodies were all diluted according to instructions applied.
Statistics and figures
Paired t-tests were utilized for analyzing proteomic, real-time qPCR and western blotting results of CA tissues. A p value <.05 was required for results to be considered statistically significant. Results were expressed as the mean ± SEM. All statistical calculations were performed with use of R 3.4.1 software and figures were drawn with use of the ggplot2 package in R software (Rstudio based on R3.4.1, Boston, MA).
Results
Diagnosis of CA as determined by HE staining and HPV identification
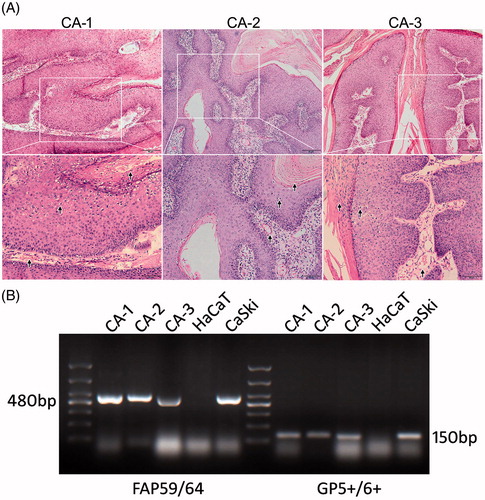
A biopsy and HE staining were performed on samples dissected from tissues of the 3 patients and were then evaluated by a dermatologic pathologist. Pathological examination revealed characteristic changes such as papillomatosis, koilocytes in the stratum spinosum, parakeratosis in stratum corneum, enlargement of dermal papillae and expansion of dermal capillaries (). A subsequent HPV-DNA PCR assay using FAP59/64 primer pairs (480 bp) and GP 5+/6+ primer pairs (150 bp) verified the existence of HPV DNA copies in tissue samples of the patients (). HaCaT cells were used as negative controls, whereas CaSki cells were used as positive controls of HPV-DNA copies. Taken together, a diagnosis of CA was made and the remaining samples of the 3 patients were then subjected to further experiments.
Figure 1. Diagnosis of CA. (A) HE staining and pathological examination of the samples dissected from the 3 samples of CA tissue. Arrows indicate partial characteristic pathological features that substantiate the diagnosis. (B) PCR amplification of HPV-DNA samples from the 3 tissue samples were separated by agarose gel electrophoresis. A 100 bp DNA ladder was used to illustrate DNA amplicon length. DNA from HaCaT cells were used as a negative control, whereas DNA from CaSki cells were used as a positive control.
Quantitative proteomic analyses identified differentially expressed proteins in CA tissue subjected to hyperthermia treatment
To examine potential protein alterations resulting from local hyperthermia therapy, CA tissues in the presence or absence of ex-vivo 44 °C hyperthermia treatment from 3 patients were subjected to an iTRAQ-based quantitative proteomic analysis following procedures illustrated in . Based upon the criteria described above, a total of 20,208 unique peptides that mapped to 4128 non-redundant proteins were identified. As screened by a 1.2-fold cut-off criterion (treatment group/control group >1.2 or <0.833) together with a paired t-test p values <.05, 102 proteins were ultimately identified as differentially expressed proteins (DEPs, ), among which 37 were up-regulated and 65 down-regulated (). The top 10 up and down-regulated proteins are shown in .
Figure 2. Workflow of the study and Volcano Plot for protein expressions. (A) A brief summary of procedures involved with sample preparation, grouping, iTRAQ labeling, MS detection and bioinformatics analysis used in this study. (B) The Volcano plot for quantifiable proteins identified by LC-MS/MS. Spots on the top-right quadrant indicate significantly upregulated proteins (p values <.05) with a fold change greater than 1.2, spots on the top-left quadrant indicate significantly downregulated proteins (p values <.05) with a fold change less than 0.833 and the other spots indicate proteins failing to meet these criteria of fold change and/or p values.
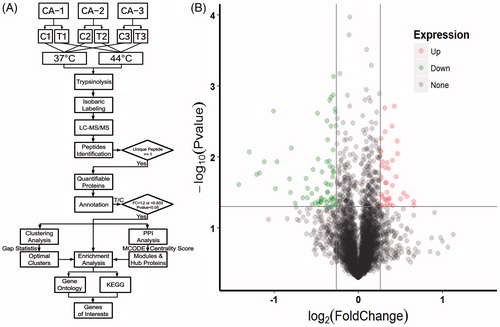
Table 1. The top 10 up- and down-regulated proteins identified from iTRAQ analysis.
Validation of gene expressions on mRNA levels using RT-qPCR assay
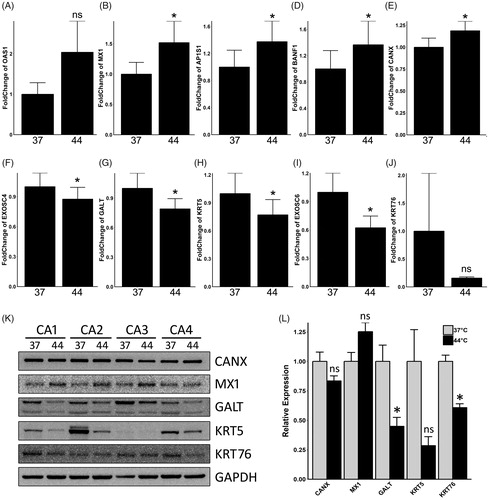
Protein alterations in CA tissue induced by hyperthermia may likely be due to increased transcriptions. Therefore, a real-time qPCR assay was utilized to assess mRNA changes of 10 selected proteins identified from the iTRAQ assay (OAS1, MX1, AP1S1, BANF1, CANX, EXOSC4, GALT, KRT5, EXOSC6 and KRT76). For this procedure, 3 new CA tissue samples were collected, bisected and treated as described above. The RNA samples were extracted after a 2-h recovery period in 37 °C. The qPCR results revealed that a significant mRNA up-regulation was observed for MX1, AP1S1, BANF1 and CANX (), while EXOSC4, GALT, KRT5 and EXOSC6 were all downregulated (). Although mRNA of OAS1 was up-regulated () and KRT76 downregulated (), these changes failed to achieve a statistically significant difference due to variations of values within samples. The results obtained from qPCR were closely related with those obtained with the iTRAQ assay, which validated the results of protein alterations observed in CA tissues subjected to hyperthermia.
Figure 3. Validation of proteomic results on mRNA levels by both real-time qPCR and western blot assay. Relative fold change of mRNA expression levels of OAS1 (A), MX1 (B), AP1S1 (C), BANF1 (D), CANX (E), EXOSC4 (F), GALT (G), KRT5 (H), EXOSC6 (I) and KRT76 (J) are illustrated in the bar plots. Protein expressions of CANX, MX1, GALT, KRT5 and KRT76 were illustrated in (K), and GAPDH was used as a loading control. The grayscale analysis of western blot results was shown in barplot (L). CA samples were assigned to either 37 °C control group (37) or 44 °C hyperthermia (44). Asterisk (*) indicates statistically significant differences between the hyperthermia and control groups, whereas ns indicates non-significant differences.
Validation of gene expressions on protein levels using Western blot assay
For direct protein expression validation, five major target genes identified from the iTRAQ assay (CANX, MX1, KRT5, KRT76 and GALT) were detected by western blotting using specific monoclonal antibodies, and GAPDH was used as a loading control. Similar to qPCR assay, the western blot assay showed that the protein levels of KRT5, KRT76 and GALT were majorly down regulated in CA samples in response to ex-vivo hyperthermia, whereas MX1 was up-regulated. CANX, however, did not show obvious alteration in protein expression (). Additionally, a grayscale analysis of western blot result was performed with use of Adobe Photoshop 7.0 software. A paired t-test of the grayscale values indicated that among all four CA samples the protein alterations of MX1 and KRT76 were statistically significant whereas alterations of CANX, MX1 and KRT5 were not (). Further considering the grayscale value of each individual sample, it can be inferred that the statistical insignificance of MX1 and KRT5 were due to individual variations. In conclusion, these results demonstrated that the protein levels of many target genes were altered in CA tissues during hyperthermia treatment. Moreover, it should be noted that individual protein expression variations existed within different samples during ex-vivo hyperthermia treatment. Such variation may, in part, explain the differences observed in therapeutic responses of patients receiving local hyperthermia treatment against HPV-infectious diseases in clinics.
Enrichment analysis of DEPs revealed altered functions in relation to metabolism, differentiation and anti-viral activity in CA tissue subjected to hyperthermia
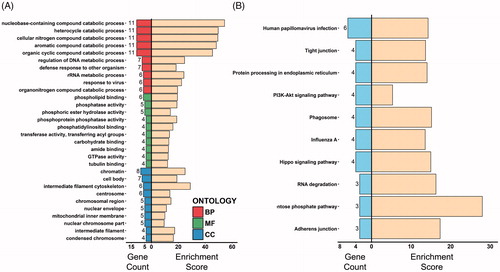
The 102 DEPs identified were first subjected to GO enrichment analysis with the use of the clusterProfiler package in R 3.4.1 software. The enriched terms of biological process (BP), molecular function (MF) and cellular component (CC) were sorted by gene count and the top ten terms of the three GO categories with a p value <.05 are summarized in . The results revealed that the DEPs obtained principally participated in metabolic and catabolic processes as well as defense activities against viruses and other organisms (BP). These effects were exerted through influencing molecular reactions involving phosphor- and acyl-groups and other enzymes (MF) within the nucleus, mitochondria and cell skeleton (CC). A KEGG enrichment analysis was then performed on DEPs using the same R package. The results were sorted as described above and the top ten KEGG terms are presented in . Similarly, the DEPs participated in defense activity related pathways, such as human papillomavirus infection, influenza A, phagosome and protein processing in endoplasmic reticulum; metabolism and cell survival-related pathways, such as pentose prophase, PI3K-Akt and Hippo signaling pathways; and cell skeleton and structure related pathways, such as tight and adherens junctions.
Figure 4. Gene ontology and KEGG enrichment analysis of DEPs. (A) The top ten gene counts of GO-BP (top 10 bars), MF (middle 10 bars) and CC (bottom 10 bars) terms are illustrated on the left side, with respective enrichment scores (−log10 (p values) ×10) shown on the right. (B) The top ten gene counts of KEGG terms are illustrated on the left side, and their respective enrichment scores (−log10 (p values) ×10) are shown on the right.
Clustering combined with biological process enrichment analysis revealed up-regulation of anti-viral activity as well as downregulations of metabolism and differentiation in CA tissue subjected to hyperthermia
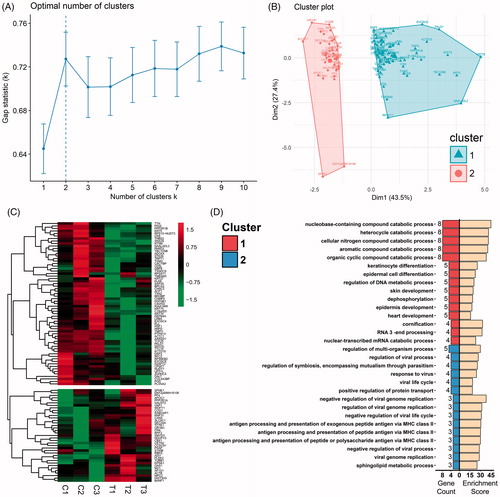
To further assess functional alterations of CA tissue in response to hyperthermia a k-means clustering analysis was applied to the 102 DEPs with the use of the factoextra package (Rstudio based on R3.4.1, Boston, MA). As calculated with the gap statistics method, the optimum k value suggested the finest clustering result to be 2 clusters (), which was then visualized as shown in . A hierarchical clustering analysis was then employed to assess the 102 DEPs as achieved with use of the pheatmap package in R 3.4.1. By applying the optimum k value of 2, the hierarchical clustering generated identical results as those obtained with the k-means clustering (). Combining the two clustering methods, the 102 DEPs can be allocated into 2 clusters, with Cluster 1 containing 65 down-regulated proteins and Cluster 2, 37 up-regulated proteins. To gain a more explicit understanding of these clustered proteins, a Biological Process (BP) enrichment analysis from GO was utilized to individually analyze the two clusters. The results of this analysis revealed that the down-regulated proteins of Cluster 1 were more enriched in processes involving metabolism, catabolism and keratinocyte differentiation, whereas the up-regulated Cluster 2 proteins were more enriched in processes involving antigen presentation and defense responses against viruses ().
Figure 5. Clustering analysis of the DEPs and GO-BP enrichment of clusters. (A) The optimal cluster number was evaluated with use of gap statistics. Dashed line indicates the optimal k value of 2. (B) K-means clustering analysis of DEPs applying optimal k value revealed 2 distinct clusters, with triangles indicating Cluster 1 and spots Cluster 2. (C) Hierarchical clustering analysis of DEPs applying the optimal k value. ‘C’ Refers to the 37 C control groups whereas ‘T’ refers to the 44 C hyperthermia groups. Gene symbols of DEPs are illustrated on the right side. (D) Biological process terms of the top 15 gene count in the GO-BP enrichment analysis for Cluster 1 (top 15 bars on the left) and Cluster 2 (bottom 15 bars on the left). Bars on the right represent respective enrichment scores (−log10 (p values) ×10).
Protein-protein interaction analysis for the identification of interaction modules and hub proteins of DEPs in CA tissue subjected to hyperthermia
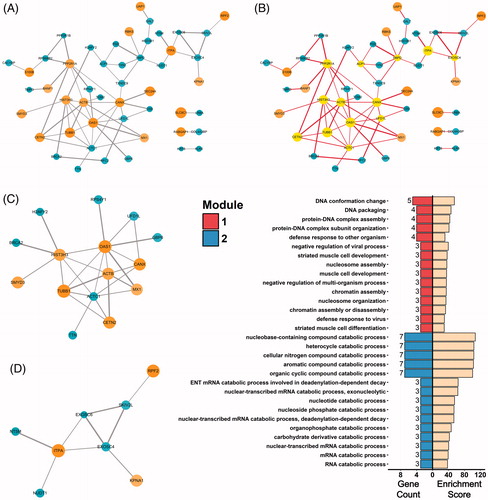
To explore possible interactions in the relationships of the 102 DEPs, the STRING online database was utilized to calculate protein-protein interaction (PPI) scores. After establishing a threshold interaction score of 0.4 (by default), a PPI network containing a total of 49 nodes with 68 interactions were identified (visualized by Cytoscape 3.5.1 software in ). Subsequently, by adopting the CentiScaPe plugin in Cytoscape, 13 proteins (CETN2, PPP2R1A, HIST3H3, TUBB1, ACTB, OAS1, ACTC1, CANX, ACP1, UFD1L, H6PD, ITPA, EXOSC4) were filtered out from the network with a centrality degree greater than the threshold value of 2.7755 (). These were therefore considered the hub proteins. Within the entire PPI network, two interaction modules were mined with use of the MCODE plugin in Cytoscape by setting the cutoff degree to 2 (). A BP enrichment analysis performed on the two modules showed that Module 1 was more enriched in processes related to DNA assembly and anti-viral activities, whereas Module 2 was more enriched in processes involving metabolism and catabolism ().
Figure 6. Protein-protein interactions of DEPs. (A) PPI network of DEPs visualized by Cytoscape. Circles indicate up- or down-regulated DEPs. Edges connecting the circles indicate protein-protein interactions, with thickness of the edges representing confidence of the bonds. (B) Hub proteins identified by CentiScaPe were highlighted in the PPI network. (C and D) Interaction module 1 (C) and module 2 (D) mined from the PPI network with use of MCODE analysis. (E) Biological process terms of the top 15 gene count in the GO-BP enrichment analysis for Module 1 (top 15 bars on the left) and Module 2 (bottom 15 bars on the left). Bars on the right represent respective enrichment scores (−log10 (p values) ×10).
Discussion
During clinical application, local hyperthermia has been shown to be particularly more advantageous in treating massive or multiple HPV infected lesions [Citation8,Citation18,Citation19] by interfering with only one specific lesion region or component [Citation19], we have speculated that the efficacy of local hyperthermia may be due to its immunologic effects against HPV. Findings from a series of experiments conducted in our laboratory [Citation11,Citation20–23] have revealed that local hyperthermia not only edited the HPV genome and induced apoptosis of HPV-infected keratinocytes, but also activated multiple anti-HPV cytokines and promoted maturation of Langerhans cells, which may induce strong systemic anti-HPV immunity to result in the alleviation of massive or multiple lesions present throughout the body. The proteomic and bioinformatic assays carried out in this study further confirmed these speculations that hyperthermia may work through inhibition of biochemical processes related to energy and nucleic acid metabolism as well as keratinocyte differentiation, and stimulation of processes involved with antigen presentation and anti-virus activity.
Metabolism modulation is one of the most important strategies utilized by HPVs to infect and transform host cells. HPV oncoproteins, such as E6 and E7, affect metabolic enzymes or related signaling pathways to enhance energy production in keratinocytes [Citation24], elevate protein synthesis [Citation25] and promote cellular proliferation [Citation26]. Besides, the complete differentiation and keratinization procedure of keratinocytes also plays an additional pivotal role in the life cycle of HPVs [Citation27]. By coupling with normal epithelium developmental processes, HPVs can impede regular immune responses [Citation28], and therefore escape identification and elimination by intrinsic and innate immunities. On the proteomic level, we found that hyperthermia reduced expression of energy metabolic enzymes such as Galactose-1-phosphate uridyl transferase (GALT) and GDH/6PGL endoplasmic bifunctional protein (H6PD), as well as several keratins (Keratin 5, Keratin 27, Keratin 75 and Keratin 76) responsible for cornification. By doing so, hyperthermia may likely obstruct the normal proliferation and differentiation processes of HPV-infected keratinocytes and, in this way, interfere with HPV life cycle.
On the other hand, the study revealed that multiple biological processes involved with viral responses were enhanced and proteins with anti-viral activities such as 2'-5'-oligoadenylate synthase 1 (OAS1), Interferon-induced GTP-binding protein Mx1 (MX1), Barrier-to-autointegration factor 1 (BANF1), Calnexin (CANX) as well as the AP-1 complex subunit sigma-1A (AP1S1) were induced by hyperthermia. These proteins have been reported to be crucial for anti-viral responses involving viral genome degradation [Citation29,Citation30], interferon activation [Citation31,Citation32], viral replication inhibition [Citation33,Citation34] as well as antigen presentation [Citation35,Citation36]. Therefore, we proposed that by induction of these key factors, hyperthermia has the potential to interfere with HPV DNA replication and expression as well as HPV antigen presentation and, in this way, boost the immunologic clearance of HPV infections.
Usually, proteins within the same interaction module possess similar functions [Citation37], and the GO-BP enrichment analysis of the two major interaction modules mined from the PPI-network revealed a highly similar functional involvement as compared to those identified by clustering, indicating that the interaction modules mined from the PPI network were crucial to the overall proteomic changes that result from hyperthermia, and therefore worthed further attention and more detailed investigations.
By combining proteomic and bioinformatics analyses, results a considerable amount of new and interesting information regarding local hyperthermia therapy against CA has ensued. We will be more concentrated on the processes involving energy generation and cornification control of keratinocytes as well as proteins with anti-viral activities identified by this work in our future studies. However, it should also be noted that both expression patterns and responsiveness of some DEPs to hyperthermia showed considerable variation among different CA samples. Hence, in order to obtain more robust results, an increasing number of samples should be included in any further investigations.
Overall, we believe these current results, in particular, those derived through analyzing the hub proteins and their potential interactions, provide a foundation for future avenues of research into the detailed mechanisms involved with the efficacy of local hyperthermia and will guide us to improve the implementation of this promising clinical therapeutic method against cutaneous HPV infection.
Supplemental Material
Download JPEG Image (965.1 KB)
Supplemental Material
Download TIFF Image (13.7 KB)Supplemental Material
Download TIFF Image (9.4 KB)Supplemental Material
Download TIFF Image (14.6 KB)Supplemental Material
Download TIFF Image (14.1 KB)Supplemental Material
Download TIFF Image (15.3 KB)Supplemental Material
Download TIFF Image (18.2 KB)Supplemental Material
Download TIFF Image (15.3 KB)Supplemental Material
Download PDF (221.7 KB)Acknowledgements
We thank the ED-IT Editorial Service for revision of this manuscript for submission in English.
Disclosure statement
No potential conflict of interest was reported by the authors.
Additional information
Funding
References
- Scheinfeld N. Update on the treatment of genital warts. Dermatol Online J. 2013;19:18559.
- Yu X, Zheng H. Infections after photodynamic therapy in Condyloma acuminatum patients: incidence and management. Environ Sci Pollut Res. 2018;25:14000–14005.
- Franckena M. Review of radiotherapy and hyperthermia in primary cervical cancer. Int J Hyperther. 2012;28:543–548.
- Shi Z, Lan B, Peng B, et al. Combination therapy with BH3 mimetic and hyperthermia tends to be more effective on anti-melanoma treatment. Biochem Biophys Res Commun. 2018;503(1):249–256.
- Lee H, Park HJ, Park CS, et al. Response of breast cancer cells and cancer stem cells to metformin and hyperthermia alone or combined. PloS One. 2014;9:e87979.
- Crezee H, Inman BA. The use of hyperthermia in the treatment of bladder cancer. Int J Hyperther. 2016;32:349–350.
- Huo W, Gao XH, Sun XP, et al. Local hyperthermia at 44 degrees C for the treatment of plantar warts: a randomized, patient-blinded, placebo-controlled trial. J Infect Dis. 2010;201:1169–1172.
- Huo W, Li GH, Qi RQ, et al. Clinical and immunologic results of local hyperthermia at 44 degrees C for extensive genital warts in patients with diabetes mellitus. Int J Hyperther. 2013;29:17–20.
- Gao XH, Gao D, Sun XP, et al. Non-ablative controlled local hyperthermia for common warts. Chinese Med J. 2009;122:2061–2063.
- Milani V, Noessner E, Ghose S, et al. Heat shock protein 70: role in antigen presentation and immune stimulation. Int J Hyperther. 2002;18:563–575.
- Zhu LL, Gao XH, Qi R, et al. Local hyperthermia could induce antiviral activity by endogenous interferon-dependent pathway in condyloma acuminata. Antiviral Res. 2010;88:187–192.
- Ross PL, Huang YN, Marchese JN, et al. Multiplexed protein quantitation in Saccharomyces cerevisiae using amine-reactive isobaric tagging reagents. Mol Cell Proteomics. 2004;3:1154–1169.
- Pierce A, Unwin RD, Evans CA, et al. Eight-channel iTRAQ enables comparison of the activity of six leukemogenic tyrosine kinases. Mol Cell Proteomics. 2008;7:853–863.
- Li Z, Adams RM, Chourey K, et al. Systematic comparison of label-free, metabolic labeling, and isobaric chemical labeling for quantitative proteomics on LTQ Orbitrap Velos. J Proteome Res. 2012;11:1582–1590.
- Wang H, Alvarez S, Hicks LM. Comprehensive comparison of iTRAQ and label-free LC-based quantitative proteomics approaches using two Chlamydomonas reinhardtii strains of interest for biofuels engineering. J Proteome Res. 2012;11:487–501.
- Wisniewski JR, Zougman A, Nagaraj N, et al. Universal sample preparation method for proteome analysis. Nat Methods. 2009;6:359–362.
- Yu G, Wang LG, Han Y, et al. clusterProfiler: an R package for comparing biological themes among gene clusters. Omics. 2012;16:284–287.
- Li X, Zhang C, Hong Y, et al. Local hyperthermia treatment of extensive viral warts in Darier disease: a case report and literature review. Int J Hyperther. 2012;28:451–455.
- Hu L, Qi R, Hong Y, et al. One stone, two birds: managing multiple common warts on hands and face by local hyperthermia. Dermatol Ther. 2015;28:32–35.
- Wang X, Gao XH, Li X, et al. Local hyperthermia induces apoptosis of keratinocytes in both normal skin and condyloma acuminata via different pathways. Apoptosis. 2009;14:721–728.
- Li X, Gao XH, Jin L, et al. Local hyperthermia could induce migrational maturation of Langerhans cells in condyloma acuminatum. J Dermatol Sci. 2009;54:121–123.
- Wang X, Gao XH, Hong Y, et al. Local hyperthermia decreases the expression of CCL-20 in condyloma acuminatum. Virol J. 2010;7:301.
- Yang Y, Wang H, Zhang X, et al. Heat increases the editing efficiency of human papillomavirus E2 gene by inducing upregulation of APOBEC3A and 3G. J Invest Dermatol. 2017;137:810–818.
- Cuninghame S, Jackson R, Lees SJ, et al. Two common variants of human papillomavirus type 16 E6 differentially deregulate sugar metabolism and hypoxia signalling in permissive human keratinocytes. J Gen Virol. 2017;98:2310–2319.
- Spangle JM, Munger K. The human papillomavirus type 16 E6 oncoprotein activates mTORC1 signaling and increases protein synthesis. J Virol. 2010;84:9398–9407.
- Mazurek S, Zwerschke W, Jansen DP, et al. Effects of the human papilloma virus HPV-16 E7 oncoprotein on glycolysis and glutaminolysis: role of pyruvate kinase type M2 and the glycolytic-enzyme complex. Biochem J. 2001;356:247–256.
- Graham SV. Keratinocyte differentiation-dependent human papillomavirus gene regulation. Viruses. 2017;9(9):245.
- Klymenko T, Gu Q, Herbert I, et al. RNASeq analysis of differentiated keratinocytes reveals a massive response to late events during human papillomavirus type 16 infection, including loss of epithelial barrier function. J Virol. 2017;91(24):e01001–e01017.
- Silverman RH. Viral encounters with 2',5'-oligoadenylate synthetase and RNase L during the interferon antiviral response. J Virol. 2007;81:12720–12729.
- Thavachelvam K, Gad HH, Ibsen MS, et al. Rapid uptake and inhibition of viral propagation by extracellular OAS1. J Interferon Cytokine Res. 2015;35:359–366.
- Haller O, Staeheli P, Kochs G. Interferon-induced Mx proteins in antiviral host defense. Biochimie. 2007;89:812–818.
- Reiser J, Hurst J, Voges M, et al. High-risk human papillomaviruses repress constitutive kappa interferon transcription via E6 to prevent pathogen recognition receptor and antiviral-gene expression. J Virol. 2011;85:11372–11380.
- Wiebe MS, Traktman P. Poxviral B1 kinase overcomes barrier to autointegration factor, a host defense against virus replication. Cell Host Microbe. 2007;1:187–197.
- Ibrahim N, Wicklund A, Jamin A, et al. Barrier to autointegration factor (BAF) inhibits vaccinia virus intermediate transcription in the absence of the viral B1 kinase. Virology. 2013;444:363–373.
- Ritz U, Momburg F, Pilch H, et al. Deficient expression of components of the MHC class I antigen processing machinery in human cervical carcinoma. Int J Oncol. 2001;19:1211–1220.
- Takatsu H, Sakurai M, Shin HW, et al. Identification and characterization of novel clathrin adaptor-related proteins. J Biol Chem. 1998;273:24693–24700.
- Fan Q, Liu B. Identification of the anticancer effects of a novel proteasome inhibitor, ixazomib, on colorectal cancer using a combined method of microarray and bioinformatics analysis. OTT. 2017;10:3591–3606.