
 ?Mathematical formulae have been encoded as MathML and are displayed in this HTML version using MathJax in order to improve their display. Uncheck the box to turn MathJax off. This feature requires Javascript. Click on a formula to zoom.
Abstract
Purpose: Hyperthermia treatment quality determines treatment effectiveness as shown by the clinically derived thermal-dose effect relations. SAR based optimization factors are used as possible surrogate for temperature, since they are not affected by thermal tissue properties uncertainty and variations. Previously, target coverage (TC) at the 25% and 50% iso-SAR level was shown predictive for treatment outcome in superficial hyperthermia and the target-to-hot-spot-quotient (THQ) was shown to highly correlate with predictive temperature in deep pelvic hyperthermia. Here, we investigate the correlation with temperature for THQ and TC using an ‘intermediate’ scenario: semi-deep hyperthermia in the head & neck region using the HYPERcollar3D.
Methods: Fifteen patient-specific models and two different planning approaches were used, including random perturbations to circumvent optimization bias. The predicted SAR indicators were compared to predicted target temperature distribution indicators T50 and T90, i.e., the median and 90th percentile temperature respectively.
Results: The intra-patient analysis identified THQ, TC25 and TC50 as good temperature surrogates: with a mean correlation coefficient R2T50 = 0.72 and R2T90=0.66. The inter-patient analysis identified the highest correlation with TC25 (R2T50 = 0.76, R2T90=0.54) and TC50 (R2T50 = 0.74, R2T90 = 0.56).
Conclusion: Our investigation confirmed the validity of our current strategy for deep hyperthermia in the head & neck based on a combination of THQ and TC25. TC50 was identified as the best surrogate since it enables optimization and patient inclusion decision making using one single parameter.
1. Introduction
The therapeutic benefit of hyperthermia as adjuvant to radio- and chemo-therapy has been proved in a number of clinical trials [Citation1–3]. In the literature, treatment outcome has been prospectively and retrospectively correlated to different thermal dose parameters [Citation4–6]. Following these thermal- and thermal-dose effect relations, a target conformal increase of the temperature should further enhance this clinical effectiveness [Citation7]. However, temperature is difficult to predict, due to large thermal tissue property uncertainties and hence cannot be prescribed. Establishing a prescriptive quality parameter prognostic for the treatment outcome would help in the development of new devices or techniques and for a further spread of hyperthermia adoption as an addition to first line radio- and chemo-therapy [Citation8,Citation9]. Although a single unique thermal dose parameter has not been established, the need for such a parameter is widely accepted by the hyperthermia community [Citation10–14].
Despite the demonstrated thermal- and thermal-dose-effect relations, there is no consensus amongst hyperthermia researchers whether the specific absorption rate (SAR) or temperature distribution should be optimized [Citation15]. Of course, as increasing temperature is the main aim of hyperthermia, optimizing the temperature distribution seems the most logic objective and some effectiveness was shown [Citation16]. However, for deep pelvic hyperthermia, the benefit of optimizing the temperature pattern was lost under the very large uncertainties of thermal tissue properties [Citation13,Citation17]. On top of that, temperature optimization generally exploits global optimizers, which are prone to suboptimal solutions and require a considerable computational effort. Besides, global algorithms require problem-specific parameter tuning and are limited in handling large problem sizes, i.e., optimization complexity rises exponentially with the number of unknowns [Citation18]. Optimization of the SAR pattern, on the other hand, facilitates convex optimizers, which enable real-time re-optimization during treatment [Citation9]. The possibility of ascribing treatment quality with SAR indicators is very attractive when considering the above and taking also into account that hyperthermia applicators are generally designed based on electromagnetic and dosimetric characteristics, which are predictable at a higher accuracy [Citation19,Citation20].
In their study, Canters et al. [Citation13] used the predicted temperature parameters as a basis for selecting a set of quality indicators and optimization functions for deep pelvic hyperthermia applied with the BSD2000 Sigma 60 applicator. Their results distinguished the so-called target to hot-spot quotient (THQ) as most predictive for median target temperature, T50. Earlier, a relation was found between the Target Coverage of the 25% iso-SAR volume and clinical outcome for superficial hyperthermia [Citation14]. Still, their predictive value for either clinical outcome and temperature for other scenarios, such as head & neck (H&N) hyperthermia, is unknown. In the work of Iero et al. [Citation21], in a simplified setup, the spatial relation between the SAR and temperature is shown to mimic a convolution, with the Green’s function depending on the thermal parameters. Hence, although a correlation between SAR and temperature is to be expected, the actual predictive power of SAR-based quality parameters should be verified in a realistic clinical scenario like H&N hyperthermia.
At Eramsus MC, the Visualization Tool for Electromagnetic Dosimetry and Optimization (VEDO) is used in clinical routine to plan and visualize the administered hyperthermia treatment. A key role is played by the possibility of performing online treatment re-optimization in case of patient complain (or in case of a negative feedback from the interstitial thermometry, when available). Generally, this task as well as power regulation, is based on the SAR statistics reported on the VEDO console. These are aimed at objectively inform physicians about the quality of the estimated administered treatment [Citation13]. In addition, we recently derived a dedicated set of thermal tissue parameters enabling the prediction of median target temperature T50 at an estimated accuracy better than 1 °C [Citation22]. Therefore, as clinical decision making is based on SAR indicators, this paper aims to investigate the correlation between these SAR quality indicators and the main predicted temperature indicators.
The objective of this study was to evaluate the predictive value of clinically adopted and relevant SAR based indicators for treatment quality during H&N hyperthermia. Specifically, two different evaluations have been carried out: (1) an intra-patient analysis aimed at establishing the optimal SAR-based parameter for optimization purposes on a per-patient basis; (2) an inter-patient analysis aimed at determining which SAR-based parameter is the most suitable for treatment decision making and patient inclusion. The analysis has been conducted using fifteen 3D models generated during hyperthermia treatment planning (HTP) for patients with H&N cancer treated with HYPERcollar3D [Citation23]. To avoid optimization bias, two different optimization approaches and random perturbations were adopted.
2. Materials & methods
2.1. Evaluation dataset
The evaluation dataset consists of fifteen 3D patient models generated during HTP for patients with H&N cancer that were planned for treatment with the HYPERcollar3D [Citation23]. Six of the fifteen included patient models showed a hyperthermia target volume1 (HTV) above 50cm3. These have been marked as HTV > 50 cm3 (). Such a threshold was theoretically derived as the focusing capabilities of phased array applicator [Citation24–26] and experimentally shown in [Citation23,Citation27]. For the case at hand, this has been evaluated to be approximately 50 cm3.
The HYPERcollar3D is a ring-shaped phased array made up of twenty patch antennas distributed over three rings and operating at 434 MHz. Twelve out of the twenty antennas are selected, as twelve amplifiers are available for the clinical treatment [Citation23]. A water bolus fills the space between the applicator and the patient to avoid undesired heating that may arise at the patient’s skin and to enhance electromagnetic coupling [Citation23].
Patient specific 3D models and simulation results were obtained using the clinical HTP procedure, as explained in detail in Rijnen et al. [Citation28] and Paulides et al. [Citation15]. Below, the HTP process is summarized following the scheme of . Patient-specific models were created by delineation of various tissues based on computerized tomography scans using a custom atlas-based auto segmentation routine followed by a manual adjustment in software tool iSeg (v.3.8 Zurich Medtech, Zurich, Switzerland) [Citation29]. Electromagnetic and constant thermal tissues parameters, as reported in [Citation22,Citation28,Citation29], were assigned to the segmented tissues of the 3-D patient-specific models. Of this list, the greatest unknowns are the thermal tissue properties. In previous work, we solved this issue by determining tissue parameters specifically for this application by parameter tuning such that the difference between predicted values from HTP and invasively measured temperatures in H&N tumors was minimized. Hence, while every patient-model is different in morphology, these tissue parameters aggregate information from a representative group of H&N patients and, therefore, are appropriate for our analysis [Citation29]. The 3D patient-specific models were imported into Sim4Life (v. 3.4 Zurich MedTech AG, Zurich, Switzerland) along with a 3D applicator model including a water bolus (modeled as water with [Citation22,Citation28–30]) between the applicator and the patient surface. Using this setup, the total field was computed for a 1-V sinusoidal signal excitation at 434 MHz for each antenna. The electric field per antenna was normalized for 1 W radiated power and the SAR pattern optimized. The two optimization approaches used were the particle swarm optimization (PSO) of the target to hot-spot quotient (THQ) [Citation28] and the FOcusing via Constrained power Optimization (FOCO) [Citation21]. These methods are described in the following paragraphs. VEDO was used for optimization, visualization and generating the SAR quality parameters [Citation28].
Figure 1. Schematic work-flow of the adopted methodology.
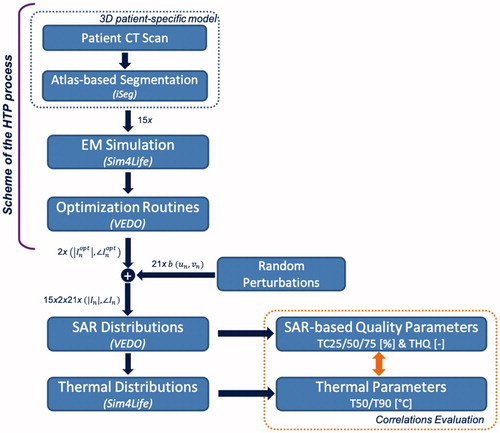
Table 1. Electromagnetic and thermal tissue parameters at 434 MHz accordingly to Verhaart et al. [Citation22].
2.1.1. PSO-Optimized target to hot-spot quotient
The optimization strategy implemented in VEDO is based on the notion that planning in hyperthermia treatment is a multi-objective optimization problem with a twofold aim: (1) maximizing the SAR within the target volume and (2) minimizing the SAR in hot-spots in healthy tissues. Starting from this consideration, the cost function is the Target to Hotspot SAR Quotient, defined as:
(1)
(1)
where, <SARtarget> is the mean SAR in the target volume and <SARHS> is the average SAR in hotspots, defined as the 1% volume of healthy tissues where the highest SAR occurs. One percent was chosen since this is approximately 50 ml, i.e. 55 ± 8ml, and connects in absolute volume to the definition in Canters et al. where 0.1% was used for the pelvic region. Note that the CT scan instruction for hyperthermia are from tip of head to including supraclavicular [Citation28]. Note that THQ is a-dimensional since it is the ratio of the average SAR in two different volumes.
This optimization problem is non-convex and must be tackled by a global optimizer, for which the Particle Swarm Optimization (PSO) was used [Citation31].
2.1.2. Focusing via constrained power optimization
An alternative strategy is to cast the HTP in terms of a convex optimization problem that is aimed at restricting the SAR level in the healthy tissues while maximizing SAR within the hyperthermia target volume (HTV). In FOCO, hot-spot occurrence is prevented by a patient-specific mask function which limits excessive power deposition level in healthy tissues.
When one of the field components can be considered to be dominant above the other ones, by simply setting the phase reference of the system, FOCO transforms the non-convex problem into a convex one [Citation32]. This results in only one solution, i.e. the globally optimal one. A brief mathematical formulation of the adopted approach is given in the following.
Let us consider r ∈ Ω a generic point of the 3D region of interest (Ω), the SAR can be expressed as: SAR(r) = σ(r)|E(r)|2/2ρ(r), where σ is the conductivity [S/m], ρ is the mass density [kg/m3] and |E(r)|2 is the squared amplitude of the total electric field generated by ‘weighted’ N monochromatic sources surrounding Ω.
Considering a target point set within the target area (rt ∈ Ω) the constrained focusing problem can be stated as:
Determine the set of the array’s complex excitations coefficients such to maximize the squared amplitude of the field in the target point, i.e., |E(rt)|2, while enforcing arbitrary upper bounds in the rest of the domain of interest.
This maximization problem is non-linear and belongs to the class of NP-hard problems2 [Citation18], as the cost functional |E(rt)|2 is a non-negative quadratic polynomial with respect to the unknowns, In. Hence, the global optimality of the solution is not ensured and global optimization procedures are needed.
When one of the field components can be considered to be dominant above the other ones, Ei rt . ., as in the case of the HYPERcollar3D [Citation33], FOCO circumvents the above difficulty by exploiting the degree of freedom on the field phase reference, assuming that the field in the target point is real [Citation21,Citation34]. Under such a circumstance, the problem can then be stated as:
Find In (n = 1,…,N) such to:
(2.a)
(2.a)
subject to:
(2.b)
(2.b)
(2.c)
(2.c)
Constraints (2.b)–(2.c) define a convex set of unknowns [Citation34]. The cost function (2.a) is a linear function of the unknowns. Hence, the overall constrained focusing problem is now conveniently cast as a convex programing problem. As such, the globally optimal solution can be efficiently determined via local optimization procedures. Finally, the ‘mask’ function, i.e., (r) is a non-negative arbitrary function. It allows enforcing patient-specific constraints on the power deposition outside the target area, i.e., Π(rt), which is defined accordingly to Bellizzi et al. [Citation33].
The mask function is set as (r) = A/(σN(r) + A) where
(r) represents the electric conductivity distribution normalized to the maximum values in each patient and A is a scalar set according to Bellizzi et al. [Citation32]. Hence, the maximum allowed electrical field value in normal tissue is related to SAR by using a mask function weighted to the tissue specific conductivity. In addition, FOCO aims at maximizing the SAR in the HTV while enforcing constraints elsewhere. Note that this formulation always results in high THQ values independent of the actual mask.
2.2. Quality indicators
The SAR quality indicators studied are used in the clinic and hence implemented in VEDO. These allow understanding of the quality of the SAR distribution induced into the patient. The considered quality indicators are the target coverage and the THQ. The target coverage has been evaluated at 25%/50%/75% (TC25/TC50/TC75) level and is defined as the volume percentage of the HTV covered by 25%/50%/75% iso-SAR value when the SAR distribution is normalized to the maximum SAR in the whole patient model. As an example, TC25 equal to 50% means that the normalized SAR distribution is ≥0,25 in one half of the HTV. THQ is defined in Section 2.1.1.
A straightforward way to analyze the quality of a hyperthermia treatment is to take into account both the power deposited within the HTV and the SAR peaks outside, i.e., the so called hot-spots. As a matter of fact, the target coverage gives information on the iso-SAR level covering the HTV, i.e., within the target volume, whereas the THQ is somehow a balance of the power deposited within and outside the HTV (note, 1/THQ was also investigated in [Citation13]). Hence, we decided to investigate these SAR quality metrics as particularly suitable and relevant for this analysis.
SAR-based indicators have been correlated to temperature-based indicators being correlated to clinical outcome [Citation4–6,Citation10–13]. Those are the T50 and the T90, defined as the lower temperature covering respectively 50% or 90% of the HTV volume.
Our analyses have been carried out evaluating the correlation coefficient (R2) for each of the considered SAR indicators with both T50 and T90. The values of the coefficients R2 ∈ (0,1) indicate the degree of correlation between the SAR quality indicators and the predicted T50 or T90. In all temperature calculations, the input power was increased up to maximum patient tolerance, i.e., until the temperature in normal tissue reaches 44 °C. Considering two variable, A and B, with N scalar observations, then the correlation coefficient is defined as:
(3)
(3)
where, μA/B and σA/B are the mean and standard deviation of A and B, respectively. In this analysis, A represents the SAR quality metrics (i.e., TC25, TC50, TC75 and THQ) and B the chosen temperature outcome metrics (i.e., T50 and T90). The calculated correlation coefficients have been analyzed by two different evaluations. A first per-patient analysis, i.e., intra-patient, aimed at investigating and identifying the best SAR-based cost function for optimization purposes. A second inter-patient analysis was then aimed at determining the most temperature predictive parameter to be used for decision making and patient inclusion.
It is worth to note that FOCO was needed in addition to the THQ PSO-optimized approach for our purpose in the presented analysis. First, because we recently showed that the FOCO approach performs better in terms of T50 predictions for large target volumes [Citation32]. Second, the above described THQ PSO-optimized approach would have been intrinsically biased since the cost function, i.e., THQ, is also one of the evaluation metrics. Therefore, we deem our current approach of using two different optimization algorithms with different levels of perturbations more suitable for this analysis.
2.3. Details on data generation
The goal of this work was to assess if SAR-based quality metrics are correlated with treatment quality, using the predicted median temperature, T50, and the T90 as surrogate of the clinical outcome (i.e., accounting for the treatment outcome). The overall process is summarized in a flowchart depicted in .
Our procedure starts with optimizing the complex signals feeding the applicator by means of the two optimization routines. For each patient, both HTP optimizers lead to a corresponding optimized excitation set (Inopt) (middle dashed box in . These latter are determined such that the induced SAR distribution is focused within the target volume. This corresponds to ‘high’ values of the SAR quality parameters. By considering only this subset of the data, our evaluation would contain an optimization bias. Hence, for each patient, we extended the dataset by generating various excitation signals inducing several distinct SAR distributions. For each, we calculated the induced temperature distributions. Hereto, we perturbed the optimized excitation signals, i.e., Inopt. Obviously, the more we perturb the optimal excitation signals, the more the SAR distribution parameters deviate from the optimal values. In this way, also the lower values of the SAR quality metrics are achieved. This approach was used and deemed better than choosing completely random excitations, as in that case, focusing would not occur at all. By doing so, one is able to evaluate the possible correlations based on relevant results (orange bottom dashed box in .
As far as the realization of the perturbations is concerned, 20 different cases were considered for each patient and each optimized complex signal. Hereto, both the amplitude () and phase (
) of the excitations were perturbed as
and
where un and vn are random uniformly distributed numbers
and b monitors the perturbation intensity (from
5% to
100% in steps of 5%). In conclusion, SAR distributions for 2 optimization routines, 15 patient models and 21 complex signals were used for evaluating the correlations. Of course, in each experiment (and for each optimizer and each antenna) the perturbation was randomly determined according to the enforced distribution. Note that our goal was not to simulate noise but rather perturbations. Hence, similar results are expected if perturbations are applied in some other way.
2.4. Details on the bio-heat transfer calculation
The initial body temperature is set according to the physiologic body temperature, i.e., set equal to 37 °C. The water bolus boundary condition was modelled as a convective boundary condition with a heat transfer coefficient of 292 W/m2kg °C and a temperature of 30 °C whereas the internal air boundary condition was modelled using a heat transfer coefficient of 50 W/m2kg °C and a temperature of 37 °C [Citation22]. Finally, the external air boundary condition was modelled with a heat transfer coefficient of 850 W/m2kg °C and assuming a room temperature of 20 °C [Citation22]. Temperature simulations were calculated in Sim4Life software using Pennes’ Bio-Heat equation [Citation35]. Steady state temperatures were obtained by increasing total radiated power of the antennas combined, and hence SAR, to achieve a maximum of 44 °C in normal tissue, where normal tissue are all tissues outside the HTV.
3. Results
and report the results of the intra-patient analysis. Here, the correlation coefficients between the considered SAR indicator set with both T50 and T90 (respectively in and ) have been evaluated for each patient separately. A mean correlation coefficient R2 = 0.72 for T50 and of R2=0,66 for T90 were found. This suggests that TC25 and TC50 can be exploited for optimization purposes besides THQ. Instead, a weaker correlation was found for TC75 with both T50 and T90, i.e. R2 = 0.57 and R2 < 0.5 respectively. The same trend is observed for the smaller and the larger HTV volume classes.
Table 2. Correlation coefficient (R2) with the median temperature T50 on a per-patient basis.
Table 3. Correlation coefficient (R2) with the median temperature T90 on a per-patient basis.
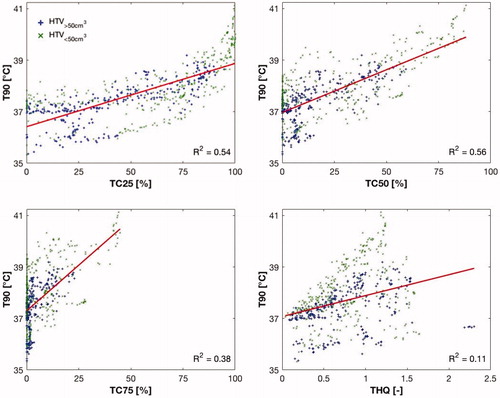
and report the results of the inter-patient analysis. Each sub-graph reports the comparison of one of the considered SAR-based quality metrics set with T50 and T90, in and respectively. Following the procedure in Section 2.3, each star represents the value of a SAR-based quality metric (i.e., THQ and TC25/50/75) and the corresponding temperature metric (i.e., T50 and T90). Here, the correlation coefficients between SAR quality indicator and the temperature metrics have been evaluated considering all included patients combined. A sub-graph for each indicator is reported and the correlation to the target temperature metrics have been calculated and reported. Results achieved in our inter-patient analysis identified a good correlation of temperature metrics with TC25 (R2T50 = 0.76, R2T90=0.56) and TC50 (R2T50 = 0.74, R2T90 = 0.56), and a weaker one with TC75, THQ where R2 remains < 0.5.
Figure 2. Inter-patient correlation of all indicators with T50. Each indicator is individually plotted. On each subfigure, the SAR indicator name is displayed and the correlation coefficients (R2) are reported.
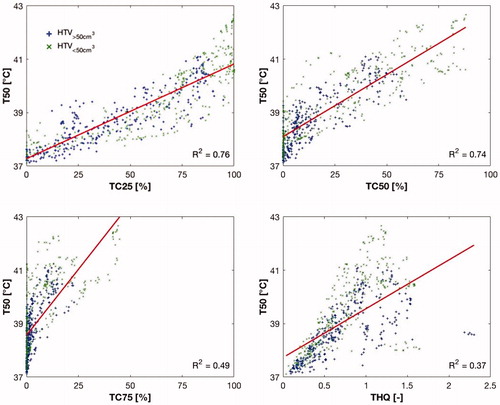
Figure 3. Inter-patient correlation of all indicators with T90. Each indicator is individually plotted. On each subfigure, the SAR indicator name is displayed and the correlation coefficients (R2) are reported.
reports the results shown in and for the smaller and larger target volumes separately, using HTV= 50 cm3 as threshold. and show the results for smaller target volumes in green whereas the larger in blue. confirms the relations with TC25, TC50 and TC75, whereas the THQ-related correlation coefficients are different for different sized target volumes. In particular, these are greater in case of HTV< 50 cm3 (R2T50 = 0.46, R2T90 = 0.15) and decrease in case of larger HTV (R2T50 = 0.37, R2T90 = 0.01).
Table 4. Inter-patient correlation coefficient (R2) with T50 and T90 for all patients and separately for the large and small cases.
4. Discussion
In this work we investigated the correlation of SAR quality indicators with treatment quality outcome for the head and neck region using the HYPERCollar3D applicator. Our intra-patient analysis confirmed the clinically adopted THQ as a good SAR optimization function and identified TC25 and TC50 as possible optimization functions. On the other side, in contrast with what found by Canters et al. [Citation13] for deep pelvic hyperthermia, the inter-patient analysis herein reported identified a better correlation of TC25 and TC50, as compared to THQ, to the predicted temperature. As such, for the case of head and neck with the HYPERCollar3D applicator, both TC25 and TC50 are a better discriminant for the quality of a treatment.
Treatment quality has been herein evaluated according to the thermal dose effect relations which advocate the use of CEM43°CT90 [Citation2] and the median HTV temperature T50 [Citation7]. For the particular case of head and neck hyperthermia, Verhaart et al. [Citation22] showed that T50 can be predicted with a median accuracy of 0.8 °C, even when ignoring the temperature dependence of tissue cooling. Although thermal modeling is generally strongly affected by uncertainties, the thermal tissue properties used in this study were optimized and validated using temperatures measured by interstitially placed thermometer probes [Citation21,Citation23]. Hence, our 3D simulations provide the level of certainty required for predictive simulations for this specific application. Also, Kok at al. [Citation36] indicated that, although absolute temperature simulations are affected by uncertainties, relative changes can be predicted with good accuracy. However, an important ‘parallel’ effect of hyperthermia is perfusion increase [Citation37] and this was shown to play a crucial role in exploiting 3D dosimetry based on patient-specific temperature simulations [Citation22]. Here, group optimized constant thermal tissue properties were used in all patients. Hence, based on the clinical dose effect relation, we adopted temperature-based quality parameters, i.e., T50 and T90, as surrogates for treatment clinical outcome. Finally, the chosen SAR indicator set was deducted from the one embedded into the VEDO console as clinic decision making is currently based on these indicators. Also, similar SAR indicators set were already investigated in [Citation13] and [Citation14] and correlated to treatment quality respectively for deep hyperthermia in the pelvic region and for superficial hyperthermia.
4.1. Intra-patient analysis
In the current clinical optimization routine at the Erasmus MC, the planning of a hyperthermia treatment for the head and neck region is performed by optimizing the THQ [Citation9,Citation28]. The results delivered by our intra-patient analysis confirmed the effectiveness of this approach, as THQ was found to highly correlate to the target temperatures indicators, as shown in and . However, our results also suggest TC50 and TC25 as suitable optimization functions. Due to the high focusing capabilities of the HYPERCollar3D, it is worth noting that the HYPERCollar3D is able to deliver a conformal heating pattern so TC25 values are always high (≈≥75%). Therefore, TC50 is a more sensitive cost function that will allow improving T50 also towards 43 °C.
The results for Patient O were specifically analyzed because of the very low correlation between THQ and thermal proprieties found, as in and . Here, a large metal implant that strongly disturbed the SAR distribution was present in the target area leading to a very high local temperature peak. To show that the effect of this peculiar (clinically realistic) case does not affect the overall analysis, we also evaluated all statistics excluding this case. The results remain consistent, i.e., a maximum difference of 3% in TC25/50/75 and ≈ 14% in THQ, where R2 still always remains below 0.45.
4.2. Inter-patient analysis
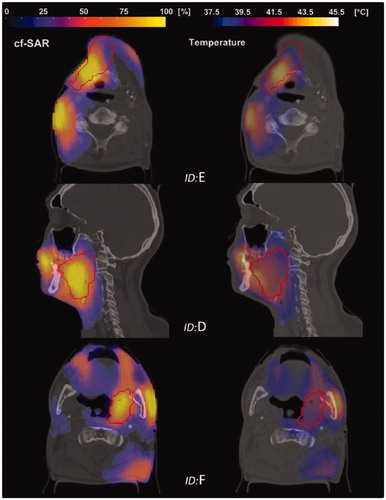
The presented analysis shows a different SAR-temperature relation for the head and neck region as compared to the one for deep regional hyperthermia [Citation13], where THQ was found to be most favorable quality indicator. Our results, instead, show that THQ correlates poorly to the predicted target temperature (R2 < 0.5) whereas TC25 and TC50 correlate better to the predicted temperature. Note that the heating patterns achieved during H&N hyperthermia with HYPERCollar3D applicator and deep pelvic hyperthermia are very different. A much more target conformal heating is achieved, and undesired SAR secondary peaks generally occur in proximity of the skin, as shown in . Overall, the coverage factor accounts for the amount of power deposited within the target area while the limiting hot-spot effect is reduced by the water bolus, e.g., in . Hence, the predictive value of THQ is lower in semi-deep hyperthermia compared to deep-regional hyperthermia in the pelvis. We found that TC25 and TC50 are the most favorable SAR indicators. This matches with the study by Lee et al. [Citation14], whom identified a correlation between treatments in which TC25 was above 75% as indicator for a good treatment. Using our results, this would mean that on average T50 should be greater than 40 °C.
Figure 4. Normalized SAR distribution (left column) and corresponding temperature distribution (right column) for patients ID E, D and F (1st, 2nd and 3rd row respectively). Undesired heating in the proximity of the skin is mitigated by the effect of the water bolus.
Finally, we conducted the same analysis for the data without patient O. The mean values derived in our intra-patient analysis ( and ) differ maximum for ≈ 5% when excluding this difficult, but realistic, case.
5. Conclusion
In this work, we evaluated the predictive value of clinically adopted and relevant SAR indicators in H&N hyperthermia for treatment quality. The analysis has been conducted using fifteen 3D patient specific models generated during HTP for patients with H&N cancer treated with HYPERcollar3D. In order to avoid optimization bias, two different optimization approaches have been used and 21 different random perturbations levels for each optimization approach and each patient were considered.
The inter-patient investigation identified a higher correlation for TC50 (R2T50=0.74, R2T90=0.56) than for THQ (R2 < 0.5). Hence, the decision on whether to treat or not is best based on TC50. The per-patient analysis identified equal correlations between T50 and T90 with TC50 and THQ (R2T50=0.72, R2T90=0.66). Hence, optimization of a per-patient based during treatment can be done on both. These results confirm the effectiveness of our current clinical approach. However, in our quest towards standardized parameters and since TC50 is already often used in applicator quality assurance, we advocate using TC50 as optimization cost function for target conformal applicators.
Results have been generated with specific reference to patients with H&N cancer treated with HYPERcollar3D, i.e. target conformal hyperthermia. Comparative evaluation of our findings with the results from Canters et al. [Citation13] for deep pelvic HT with BSD systems revealed contrasting correlations with temperature of the same SAR quality parameters. Hence, we expect that the optimum optimization and evaluation metric is dependent on the focusing ability of an applicator. Such dependence would make our analysis very important for new conformal applicators that are under development [Citation38–41]. Application of these results to other anatomical sites and applicators are matter of ongoing research.
Disclosure statement
No potential conflict of interest was reported by the authors.
Notes
Additional information
Funding
Notes
1 HTV represents the target for the hyperthermia treatment and it is delineated by a physician. Details in [Citation31].
2 Non-determistic polynomial-time hard problem
References
- Franckena M, Stalpers LJA, Koper PCM, et al. Long-term improvement in treatment outcome after radiotherapy and hyperthermia in locoregionally advanced cervix cancer: an update of the Dutch Deep Hyperthermia Trial. Int J Radiat Oncol Biol Phys. 2008;70:1176–1182.
- Thrall DE, Rosner GL, Azuma C, et al. Using units of CEM 43C T90, local hyperthermia thermal dose can be delivered as prescribed. Int J Hypertherm. 2000;16(5):415–428.
- Nakagawa Y, Kajihara A, Takahashi A, et al. BRCA2 protects mammalian cells from heat shock. Int JHypertherm. 2018;34(6):795–801.
- Sherar M, Liu F-F, Pintilie M, et al. Relationship between thermal dose and outcome in thermoradiotherapy treatments for superficial recurrences of breast cancer: data from a phase iii trial. Int J Radiat Oncol Biol Phys. 1997;39:371–380.
- Thrall DE, LaRue SM, Yu D, et al. Thermal dose is related to duration of local control in canine sarcomas treated with thermoradiotherapy. Clin Cancer Res. 2005;11:5206–5214.
- van der Horst A, Versteijne E, Besselink MG, et al. The clinical benefit of hyperthermia in pancreatic cancer: a systematic review. Int J Hypertherm. 2018;34(7):969–979.
- Franckena M, Fatehi D, Bruijne M. d, et al. Hyperthermia dose-effect relationship in 420 patients with cervical cancer treated with combined radiotherapy and hyperthermia. Eur J Cancer. 2009;45:1969–1978.
- van Leeuwen CM, Oei AL, Chin KW, et al. A short time interval between radiotherapy and hyperthermia reduces in-field recurrence and mortality in women with advanced cervical cancer. Radiat Oncol. 2017;12:75.
- Paulides MM, Verduijn GM, Van Holthe N. Status quo and directions in deep head and neck hyperthermia. Radiat Oncol. 2016;11:21.
- de Bruijne M, van der Holt B, van Rhoon GC, et al. Evaluation of CEM43 degrees CT90 thermal dose in superficial hyperthermia: a retrospective analysis. Strahlenther Onkol. 2010;186:436–443.
- van Rhoon GC. Is CEM43 still a relevant dose paramenter for hyperthermia treatment monitoring? Int J Hypertherm. 2016;32:50–62.
- Rau B, Gaestel M, Wust P, et al. Preoperative treatment of rectal cancer with radiation, chemotherapy and hyperthermia: analysis of treatment efficacy and heat-shock response. Radiat Res. 1999;151:479–488.
- Canters RAM, Wust P, Bakker JF, et al. A literature survey on indicators for characterisation and optimisation of SAR distributions in deep hyperthermia, a plea for standardisation. Int J Hyperthermia. 2009;25:593–608.
- Lee HK, Antell AG, Perez CA, et al. Superficial hyperthermia and irradiation for recurrent breast carcinoma of the chest wall: Prognostic factors in 196 tumors. Int J Radiat Oncol Biol Phys. 1998;40:365–375.
- Paulides MM, Stauffer PR, Neufeld E, et al. Simulation techniques in hyperthermia treatment planning. Int J Hyperthermia. 2013;29:346–357.
- Crezee J, Van Haaren PMA, Westendorp H, et al. Improving locoregional hyperthermia delivery using the 3-D controlled amc-8 phased array hyperthermia system: a preclinical study. Int J Hypertherm. 2009;25:581–592.
- Canters RAM, Paulides MM, Franckena M, et al. Benefit of replacing the sigma-60 by the sigma-eye applicator. a monte carlo-based uncertainty analysis. Strahlenther Onkol. 2013;189:74–80.
- Wolpert DH, Macready WG. No free lunch theorems for optimization. IEEE Trans Evol Computat. 1997;1:67–82.
- de Bruijne M, Samaras T, Bakker JF, et al. Effects of waterbolus size, shape and configuration on the SAR distribution pattern of the Lucite cone applicator. Int J Hyperthermia. 2006;22:15–28.
- Seebass M, Beck R, Gellermann J, et al. Electromagnetic phased arrays for regional hyperthermia: optimal frequency and antenna arrangement. Int J Hypertherm. 2001;17:321–336.
- Iero DA, Crocco L, Isernia T. Thermal and microwave constrained focusing for patient-specific breast cancer hyperthermia: A robustness assessment. IEEE Trans Antennas Propagat. 2014;62:814–821.
- Verhaart RF, Verduijn GM, Fortunati V, et al. Accurate 3D temperature dosimetry during hyperthermia therapy by combining invasive measurements and patient-specific simulations. Int J Hyperthermia. 2015;31:686–692.
- Togni P, Rijnen Z, Numan WCM, et al. Electromagnetic redesign of the HYPERcollar3D. applicator: toward improved deep local head-and-neck hyperthermia. Phys Med Biol. 2013;58:5997–6009.
- Bucci OM, Gennarelli C, Savarese C. Representation of electromagnetic fields over arbitrary surfaces by a finite and nonredundant number of samples. IEEE Trans Antennas Propagat. 1998;46:351–359.
- Bellizzi GG, Bevacqua MT, Crocco L, et al. 3-D field intensity shaping via optimized multi-target time reversal. IEEE Trans Antennas Propagat. 2018;66:4380–4385.
- Bellizzi GG, Iero DAM, Crocco L, et al. 3-D field intensity shaping: the scalar case. IEEE Antennas and Wireless Propagat Lett. 2018;17(3):360–363.
- Paulides MM, Vossen SHJA, Zwamborn APM, et al. Theoretical investigation into the feasibility to deposit RF energy centrally in the head-and-neck region. Int J Radiat Oncol Biol Phys. 2005;63:634–642.
- Rijnen Z, Togni P, Roskam R, et al. Quality and comfort in head and neck hyperthermia: A redesign according to clinical experience and simulation studies. Int J Hyperthermia. 2015;31(8):823–830.
- Fortunati V, Verhaart RF, van der Lijn F, et al. Tissue segmentation of head and neck ct images for treatment planning: A multiatlas approach combined with intensity modeling. Med Phys. 2013;40:071905.
- Gabriel S, Lau R, Gabriel C. The dielectric properties of biological tissues: II. Measurements in the frequency range 10 Hz to 20 GHz. Phys Med Biol. 1996;41:2251–2269.
- Cappiello G, Mc Ginley B, Elahi MA, et al. Differential evolution optimization of the SAR distribution for head and neck hyperthermia. IEEE Trans Biomed Eng. 2017;64:1875–1885.
- Bellizzi GG, Drizdal T, van Rhoon GC, et al. The potential of constrained SAR focusing for hyperthermia treatment planning: analysis for the head & neck region. Phys Med Biol. 2018;64:015013.
- Bellizzi GG, Drizdal T, Rhoon GV, et al. Advances in multi-target FOCO for hyperthermia treatment planning: a robustness assessment. 12th European Conference on Antennas and Propagation (EUCAP), 2018, London, England, April 2018.
- Isernia T, Panariello G. Optimal focusing of scalar fields subject to arbitrary upper bounds. Electron Lett. 1998;34:162–164.
- Pennes HH. Analysis of tissue and arterial blood temperatures in the resting human forearm. J Appl Physiol Vol. 1. 1948;1:93–122.
- Kok HP, Korshuize-van Straten L, Bakker A, et al. Online adaptive hyperthermia treatment planning during locoregional heating to suppress treatment-limiting hot spots. Int J Radiat Oncol Biol Phys. 2017;99:1039–1047.
- Dewhirst MW, Lee C-T, Ashcraft KA. The future of biology in driving the field of hyperthermia. Int J Hypertherm. 2016;32:4–13.
- Dobiscek Trefná H, Vrba J, Persson M. Evaluation of a patch antenna applicator for time reversal hyperthemia. Int J Hypertherm. 2010;26:185–197.
- Takook P, Persson M, Gellermann J, et al. Compact self-grounded bow-tie antenna design for an UWB phased-array hyperthermia applicator. Int J Hypertherm. 2017;33(4)387–400.
- Winter L, Ozerdem C, Hoffmann W, et al. Design and evaluation of a hybrid radiofrequency applicator for magnetic resonance imaging and rf induced hyperthermia: electromagnetic field simulations up to 14.0 Tesla and proof-of-concept at 7.0 tesla. PloS One. 2013;8:e61661.
- Niendorf T, Oezerdem C, Ji Y, et al. Radiative RF antenna arrays for cardiac, brain and thermal magnetic resonance at ultrahigh and extreme magnetic field strengths: Concepts, electromagnetic field simulations and applications. In 2017 International Conference on Electromagnetics in Advanced Applications (ICEAA). IEEE. p. 1567–1570.